GAME ON? Bullish Ascending Triangle VS Unresolved Bearish H&SFor the past two and a half months, Bitcoin has been going nowhere, coiling sideways with an upside bias in what appears to be a bullish ascending triangle pattern.
Today's 3% + rally is edging ever closer to breaking out above the triangle's flat upper boundary.
A successful conclusion to such a bullish break should vault Bitcoin up toward the noted target at 109,071, which is in close confluence with the 61.8% fib retracement of the entire decline from last year's all-time high.
In the way, is the fib 38.2% retracement level, which may act as a resistance level at 98k.
Also fighting against the potential bullish push are three unresolved downside price targets: 79,495, 76,100, and 71,580.
Failure to launch after a breakout and retest of the horizontal upper boundary of the ascending triangle, any subsequent breach of the rising lower boundary, depending on the point in time and place at which price may breach that line, and an additional downside price target will fall smack dab in the belly of the standing downside price target window.
It's not game time yet, but it's getting close. Where will you be placing your bets?
Triangle

3 year cup and handle in XINA50C&H over 3 years. Reasonable risk entry defined by an ascending triangle.
This can be traded using Singapore USD-denominated futures.
Not a recommendation, for learning purposes only.

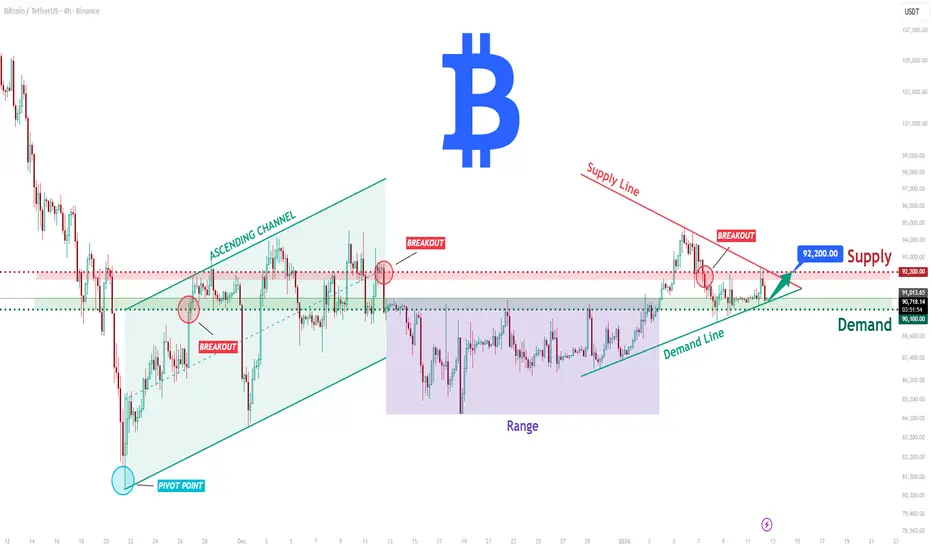
BTCUSDT Long: Demand Holding at 90,100 - Eyes on 92,200 SupplyHello traders! Here’s a clear technical breakdown of BTCUSDT (4H) based on the current chart structure. After a strong bearish move, BTC formed a clear pivot low, from which price transitioned into a bullish recovery phase. From this pivot point, the market developed a well-defined ascending channel, confirming a shift in market structure and increasing buyer control through a sequence of higher highs and higher lows. This channel guided price higher until BTC reached a key Supply Zone around 92,000–92,200, where selling pressure emerged. At this supply area, price experienced a rejection and breakout failure, indicating that sellers are actively defending this level. Following the rejection, BTC briefly broke below short-term structure and moved into a consolidation range, reflecting temporary balance between buyers and sellers. More recently, price has started to recover again, respecting a rising Demand Line, which signals that buyers are still defending the broader bullish structure.
Currently, BTC is trading between a key Demand Zone near 90,100–90,300 and the overhead Supply Zone around 92,200. This area represents a critical decision zone for the market, where the next directional move is likely to be defined.
My scenario: as long as BTCUSDT holds above the Demand Zone and continues to respect the rising demand trend line, the bullish bias remains valid. I expect buyers to attempt another push toward the 92,200 Supply Zone. A clean breakout and acceptance above this level would confirm bullish continuation and open the door for further upside. However, a strong rejection from supply followed by a breakdown below demand would weaken the structure and increase the probability of a deeper corrective move. For now, price remains in a compression phase between demand and supply — patience and proper risk management are key. Manage your risk!
Still on our way to a new ATH300$ as a new ATH almost seems programmed to me when I look at this chart.
- we BOUNCED from the 200MA as displayed here
- LONG liquidations are occurring less and less on the WEEKLY basis
- SHORT liquidations keep growing since we broke out of the falling wedge on the DAILY basis
- RSI is turning bullish on the 1W as displayed here
- bullish crossover is about to happen on the 1W MACD as displayed here
The tables have turned :)
We are currently in an ascending triangle pattern as displayed here (bullish).
244$ will become very interesting. Will we see a breakout from the triangle pattern towards 300-322$? I think there is a bigger chance the next time we close in on 244$. If we hit 300-322$, we will revisit 244$ again and see if it will hold or not.
Do not see this as an financial advise. I'm just sharing my idea/view on SOL.
Thanks for reading and please support this idea if you liked it! Trade safe. Solana 4 ever!

ETHEREUM - Retest resistance before a possible declineBINANCE:ETHUSDT is trading within the range of 3050-3150, with a local and global bearish trend. The market is still waiting for positive drivers, and until they appear, it is possible to trade within the channels...
Against the backdrop of a global downtrend, Bitcoin is forming a bullish wedge/ascending triangle, which in the current circumstances I consider to be a consolidation pattern before a possible liquidation and decline to 80-75K, which in general could trigger a decline across the entire market. Ethereum is forming a trading range against the backdrop of a local downtrend.
Focus on trading boundaries, namely resistance at 3150
After a short squeeze and a price decline to 3060, a liquidity pool of 3060-3050 (area of interest for MM) has formed below the local level
Resistance levels: 3150 - 3181
Support levels: 3083, 3056, 3000
A retest of 3150 and a lack of momentum may confirm the dominance of bears in the market, which in turn may form a false breakout of resistance and a reversal to the zone of interest and liquidity pool 3050.
Best regards, R. Linda!

GOLD - Consolidation near 4600. Breakout or correction?FX:XAUUSD has updated its ATH to 4600. A local range is forming, with growth potential, against the backdrop of escalating geopolitical risks and concerns about the independence of the Fed, which remain.
Trump's consideration of military operations in Iran amid internal unrest and the tense situation in the Russia-Ukraine conflict (emergency UN Security Council meeting) create geopolitical risks.
Questions for the Fed: A criminal investigation has been launched against Chairman Powell, heightening concerns about pressure on the central bank's independence.
US employment data (NFP) for December (+50K) was weaker than expected, supporting expectations of Fed policy easing. Attention is shifting to December inflation data (CPI), which will assess the likelihood of a rate cut in March (current probability ≈30%).
The correction may continue, but the combination of risks and soft monetary policy creates medium-term support for further growth.
Resistance levels: 4600, 4625, 4650
Support levels: 4561, 4550, 4517
Since the opening of the session, gold has exhausted its intraday ATR reserve, which creates additional opportunities for consolidation or correction, within which the market may test key support zones, such as the previous ATH, before continuing to grow. A long squeeze of the specified support may provide the market with liquidity for further growth. However, an aggressive market could trigger a breakout of 4600 without correction...
Best regards, R. Linda!

USDJPY - Consolidation may turn into upward distribution FX:USDJPY is storming the resistance zone of the current consolidation. Focus on 157.88, a breakout of the current border could trigger an upward movement...
The Japanese yen is testing the intermediate bottom, hinting that the currency is preparing to continue falling. Against the backdrop of a weak yen and a strong dollar, the currency pair may continue its upward trend.
Retesting resistance, the reaction from the bears is weakening, and the bulls are trying to keep the price above 157.88. If there is no reaction (pullback), then growth may continue from the 157.15 - 157.88 zone, provided that the price closes above the level.
Resistance levels: 157.88
Support levels: 157.15, 156.18
Technically, against the backdrop of an uptrend, consolidation is forming, within which the market is not updating local lows, but is gradually contracting towards resistance at 157.88. There is a high probability of a breakout (possibly after a slight correction to local support). Nearest targets: 160.0 - 161.5
Best regards, R. Linda!

CIFR Given breakoutTypical swing targets after breakout :
First target: ~$20 – near recent highs
Second target: ~ –$25 – psychological + analyst midpoint
Extended target: $30+ – if momentum and market context remain strong

Selena | XAUUSD – M30 | Ascending Channel Under HTF ResistancePEPPERSTONE:XAUUSD
Despite bullish momentum inside the channel, price remains below the recent swing high and HTF resistance. This keeps the structure conditional, with continuation dependent on a confirmed break in market structure.
Key Scenarios
✅ Bullish Case (Conditional)
– Strong reaction from channel support
– M30 close above 4495 → Bullish BOS confirmed
🎯 Target 1: 4525
🎯 Target 2: 4550 (Range High / Liquidity)
🎯 Target 3: ATH expansion
❌ Bearish Case
– Failure to hold channel support
– Acceptance below 4420
🎯 Downside: 4380 → 4320
Current Levels to Watch
Resistance 🔴: 4495
Support 🟢: 4420
Invalidation ❌: M30 close below channel
⚠️ Disclaimer: This analysis is for educational purposes only. Not financial advice.
❌ Bearish Case
– Failure to hold channel support
– Acceptance below 4420
🎯 Downside: 4380 → 4320
Current Levels to Watch
Resistance 🔴: 4495
Support 🟢: 4420
Invalidation ❌: M30 close below channel
⚠️ Disclaimer: This analysis is for educational purposes only. Not financial advice.

XAUUSD Long: Demand Defended - Bulls Prepare for Push To $4,530Hello traders! Here’s a clear technical breakdown of XAUUSD (3H) based on the current chart structure. Gold is trading within a well-defined ascending channel, confirming sustained bullish control and a strong trending environment. Price has consistently respected both the channel support and resistance, forming higher highs and higher lows. This structure highlights healthy momentum rather than an exhausted move.
Earlier, XAUUSD pushed into the Supply Zone around 4,500–4,530, where selling pressure appeared and price experienced a sharp rejection. This rejection led to a corrective pullback, during which price briefly broke below short-term structure before finding support at the Demand Zone near 4,400. This area aligns with the channel support and acted as a key reaction level. Within the pullback, price formed a Head and Shoulders–type corrective pattern, which completed near demand. Instead of continuation lower, sellers failed to follow through, and buyers stepped in aggressively. Price reclaimed structure with a clean breakout back above local resistance and the rising Demand Line, signaling that the move lower was corrective rather than a trend reversal. Currently, XAUUSD is holding above the 4,400 Demand Zone and continues to respect the ascending channel. Price is consolidating and building higher lows, suggesting accumulation before the next impulse.
My scenario: as long as Gold holds above the demand zone and the rising demand line, the bullish structure remains intact. I expect buyers to defend this area and push price toward the 4,530 Supply Zone (TP1). A clean breakout and acceptance above supply would confirm bullish continuation and open the door for further upside expansion. However, a decisive breakdown below the demand zone would weaken the structure and increase the risk of a deeper correction. For now, the trend favors the bulls, with demand holding and momentum gradually rebuilding. Manage your risk!

Copper Macro Bullish Ascending Wedge TriangleLong term bullish on Copper
Looks like 50% from here to reach standard Asc Triangle target
Look for various set up entries on the way up
If Copper is going up then Copper miners will go up too and some may be in Asc Wedges too
If the price drops back to the BAGL Bottom ascending grind line then that will be a nice low risk entry point
Good luck with your trading

BTCUSDT: Consolidates Above Support, Bulls Preparing Next MoveHello everyone, here is my breakdown of the current BTCUSDT setup.
Market Analysis
BTCUSDT previously traded inside a well-defined range, where price moved sideways for an extended period, indicating balance and accumulation between buyers and sellers. This consolidation phase ended with a clean breakout to the upside, confirming a shift in market control toward buyers. Following the breakout, price respected a rising trend line, forming higher highs and higher lows, which validated a bullish market structure. As BTC continued higher, it reached a key Resistance Zone around 91,700, where selling pressure appeared. Price reacted from this area and pulled back, but the move remained corrective rather than impulsive. During the pullback, BTC found support at the Support Zone near 90,100, which aligns with previous breakout structure and the rising trend line. At the same time, price is trading below a descending triangle resistance line, suggesting compression and preparation for a directional move.
Currently, BTC is holding above the support zone and the ascending trend line, while consolidating below resistance. This structure suggests buyers are still defending the market, and the overall bullish bias remains intact as long as support holds.
My Scenario & Strategy
My primary scenario: as long as BTCUSDT remains above the 90,100 Support Zone and continues to respect the rising trend line, the bullish bias remains valid. I expect buyers to defend this area and attempt a breakout above the 91,700 Resistance Zone, which would open the door for continuation toward higher levels.
However, a decisive breakdown below support and the trend line would weaken the bullish structure and increase the probability of a deeper corrective move. Until that happens, price action favors consolidation followed by potential upside continuation.
That's the setup I'm tracking. Thank you for your attention, and always manage your risk.

Sell-Side Bias Favored at Daily PremiumDAILY
4H
Price is currently trading into daily premium and interacting with buy-side liquidity near the recent highs.
While a 4H CHoCH has formed, the displacement occurred directly into prior supply without clear acceptance. Until the daily closes strong above the highs, upside continuation remains unproven.
Failure to hold above the broken high would increase the probability of this move resolving as a buy-side liquidity sweep, opening the door for downside rotation toward sell-side liquidity near 154.50.
Bias favors the sell scenario unless daily acceptance confirms otherwise.

SILVER (XAGUSD): Waiting for Breakout
I see a bullish accumulation pattern on Silver on a daily time frame.
The price is currently testing a significant horizontal resistance
based on a current ATH.
Its breakout and a daily candle close above 84.0 level
will provide a strong signal to buy.
I will expect another wave up then at least to 90.0 level.
❤️Please, support my work with like, thank you!❤️
I am part of Trade Nation's Influencer program and receive a monthly fee for using their TradingView charts in my analysis.

APLD: Momentum Confirms Triangle BreakoutAPLD - CURRENT PRICE : 37.68
APLD Breaks Symmetrical Triangle – Momentum Confirms Trend Continuation
Applied Digital Corporation (APLD) continues to trade within a strong long-term uptrend, with price holding well above the rising EMA 200 , signaling sustained institutional support and a structurally bullish market environment.
From a price-structure perspective, APLD has broken out of a bullish symmetrical triangle , supported by clear volume expansion, confirming genuine buying interest rather than a false breakout. This pattern reflects a period of healthy consolidation before trend continuation, with price now attempting to resume its prior upside trajectory.
Momentum further reinforces the bullish setup. The three highlighted green vertical lines mark previous instances where RSI crossed above 70, and in each case, price continued to rise afterward, demonstrating that overbought readings in this stock have historically acted as trend-confirmation signals rather than reversal warnings. RSI has once again moved above 70, aligning with the current breakout and strengthening the case for continued upside.
Based on the technical structure, the first upside target is $47, while the second target at $58 represents the x-to-x measured move of the symmetrical triangle . On the downside, $28 remains the key support and invalidation level. As long as price holds above this level and the EMA 200, the technical bias remains firmly bullish, with pullbacks viewed as opportunities within an ongoing uptrend.
ENTRY PRICE : 35.00 - 37.68
FIRST TARGET : 47.00
SECOND TARGET : 58.00
SUPPORT : 28.00
Notes : On 09 Jan 2026, major Wall Street analysts update their ratings for Applied Digital Corporation (APLD), with price targets ranging from $40 to $58. (Source: moomoo)

XAUUSD: Descending After Fake Breakout - Bears in ControlHello everyone, here is my breakdown of the current XAUUSD setup.
Market Analysis
XAUUSD initially spent a prolonged period trading inside a well-defined range, where price respected clear support and resistance boundaries. This range reflected market indecision, with neither buyers nor sellers able to gain sustained control. Eventually, price broke out to the upside, confirming bullish intent and triggering a strong impulsive rally.
Currently, after the rejection, price broke back below short-term structure and started forming a descending triangular structure, defined by a clearly respected descending resistance line. Each bullish attempt toward this trendline has been rejected, signaling that sellers remain in control. At the same time, price is gradually rotating lower toward the 4,350 Support Zone, which previously acted as a key demand and breakout area.
My Scenario & Strategy
My primary scenario: as long as XAUUSD remains below the 4,490 Resistance Zone and continues to respect the descending resistance line, the bearish bias remains valid. Rejections from this trendline favor further downside continuation toward the 4,350 Support Zone, which is the first major downside target. If price breaks and accepts below the 4,350 Support Zone, this would confirm bearish continuation and open the door for a deeper corrective move toward lower support levels.
However, if buyers manage to reclaim the descending resistance line and achieve a clean breakout and acceptance above the 4,500 resistance area, the short bias would be invalidated and the market could transition back into bullish continuation. For now, structure favors sellers, momentum is weakening near resistance, and price remains capped below key supply.
That's the setup I'm tracking. Thank you for your attention, and always manage your risk.

BTCUSD Holds Buyer Zone - Bulls Target 91,500 ResistanceHello traders! Here’s my technical outlook of BTCUSD (2H) based on the current chart structure. BTC previously traded inside a well-defined range, where price moved sideways for an extended period, showing balance between buyers and sellers. This consolidation acted as an accumulation phase. A strong breakout to the upside from the range confirmed renewed bullish interest and initiated an impulsive move higher. Following the breakout, price respected a rising Support Line, forming a sequence of higher highs and higher lows, which confirms a bullish market structure. As BTC pushed higher, it reached the Seller Zone / Resistance Level around 91,500, where selling pressure emerged. Price reacted from this level and pulled back, indicating that sellers are actively defending this resistance. The pullback, however, remained controlled and corrective, with price returning toward the Buyer Zone, which aligns with a key Support Level around 89,200–90,000 and the rising support trend line. Currently, BTC is holding above the Buyer Zone and the ascending support line, showing that buyers are still defending structure. The recent price action suggests consolidation rather than a breakdown, keeping the bullish scenario valid as long as support holds. My scenario: as long as BTCUSD remains above the Buyer Zone and respects the rising Support Line, the bullish bias remains intact. I expect buyers to defend this area and attempt another push toward the 91,500 Resistance Level (TP1). A clean breakout and acceptance above resistance would confirm bullish continuation and open the door for further upside. However, a decisive breakdown below the Buyer Zone would weaken the structure and increase the probability of a deeper corrective move. For now, price is at a key decision area, and patience with proper risk management is essential. Please share this idea with your friends and click Boost 🚀

XAUUSD Rising Support Holds - Next Target 4,500 ResistanceHello traders! Here’s a clear technical breakdown of XAUUSD (4H) based on the current chart structure. After a prolonged consolidation phase, Gold was trading inside a well-defined range, indicating balance between buyers and sellers. This range acted as an accumulation zone before price initiated a bullish expansion. Following the breakout from the range, XAUUSD entered an ascending channel, confirming a shift toward buyer control with a sequence of higher highs and higher lows. During this phase, price respected both the channel support and resistance lines, using them as dynamic structure levels. As price approached the upper boundary of the channel and the Resistance / Seller Zone around 4,500–4,510, bullish momentum started to weaken. Multiple fake breakouts above resistance signaled strong selling pressure at the highs. This led to a sharp corrective move lower, where price broke below short-term structure before finding support. Currently, XAUUSD is holding above the Buyer Zone around 4,400, which aligns with a key Support Level and a prior breakout area. Price has already shown a reaction from this zone and is now forming higher lows along a newly respected rising support line, suggesting buyers are attempting to regain control. The recent breakout back above local resistance reinforces the idea of a corrective pullback rather than a full trend reversal. My scenario: as long as XAUUSD holds above the 4,400 Buyer Zone and respects the rising support line, the bullish bias remains valid. I expect buyers to defend this area and attempt another push toward the 4,500 Resistance / Seller Zone (TP1). A clean breakout and acceptance above this level would confirm bullish continuation and open the path for further upside. However, a decisive breakdown below the buyer zone would weaken the structure and increase the risk of a deeper correction back toward lower support levels. Please share this idea with your friends and click Boost 🚀

ETH: Symmetrical Triangle ScenarioETH is trading inside a daily symmetrical triangle: lower highs from $3,300–$3,350 and higher lows from $2,850–$2,900.
Liquidation heatmaps show over 1B USD in liquidations stacked both above and below price, so a break of structure can move fast.
📈 Long Idea – Trade the Upside Break
- Trigger: Daily close above 3,300 (triangle resistance and recent supply).
- Entry: Breakout close or retest of $3,300 as support with bullish reaction.
- Invalidation: Close back inside the triangle / below ~$3,150
- Targets:
- T1: $3,500–$3,600
- T2: $3,900–$4,000 on a full triangle measured move and short squeeze.
📉 Short Idea – Trade the Downside Break
- Trigger: Daily close below $2,900 (triangle support).
- Entry: Breakdown close or bearish retest of $2,900 from below.
- Invalidation: Reclaim and close back above $3,000 (bear trap).
- Targets:
- T1: $2,700–$2,600
- T2: $2,200–$2,300 if long liquidations cascade.
🧠 Key Trading Principles
- React, don’t predict: Let a daily close outside the triangle pick direction; this avoids guessing inside the chop.
- Expect volatility: With leverage heavy on both sides, post‑break moves can be unusually sharp, so size positions and stops accordingly.

GOLD - Storm 4475 ahead of the news. NFP aheadFX:XAUUSD is stabilizing at 4475 in a state of consolidation. However, ahead lie US employment data and the Supreme Court's decision on Trump's trade powers...
Fundamentals:
60K new jobs are expected to be created in December, unemployment may fall to 4.5%, and wage growth to 3.6% y/y. As for the Supreme Court, it will decide whether Trump can impose tariffs without Congress' approval (IEEPA law).
The market also continues to expect 2-3 interest rate cuts in 2026. Geopolitical tensions are supporting demand for defensive assets.
Today, the market is waiting for NFP. Strong data will lower expectations of Fed easing, strengthen the dollar, and put pressure on gold (to $4300), but weak NFP data will reinforce bets on rate cuts and support gold (to $4550). The court's decision on tariffs will affect trade policy and the dollar.
Resistance levels: 4475, 4500, 4525
Support levels: 4460, 4442, 4427
A breakout and consolidation above 4475 could open the way to 4500, a breakout of which could trigger a rally to 4525-4550, but given the volatility of the news, the market may test the support zone before a possible rise.
Best regards, R. Linda!

ETERNAL is compressing under a major supply zone.ETERNAL (Zomato) Daily Chart
Validating this strictly against my breakout framework:
Flat resistance: ₹286–288
Touched 4+ times → strong supply zone
Rising trendline:
₹272 → ₹276 → ₹280 → ₹282 → higher lows
Buyers stepping in earlier each time
Price is compressing into resistance.
Apex not reached yet. Pressure building.
This is a textbook ascending triangle.
No breakout yet.
Today’s high was ₹292 but close is still below resistance.
Real confirmation happens only on a daily close above ₹291 with volume.
Triangle height ≈ ₹16
Breakout projection → ₹304+
Watching this for a clean expansion move.
#ETERNAL #Zomato #NSE #TechnicalAnalysis #Breakout
This is for educational purpose. Do your research before you invest.

Nifty Defence Index is poised for a potential breakout Nifty Defence Index is poised for a potential breakout from a symmetrical triangle within a sustained uptrend channel, supported by recent geopolitical developments and pre-budget optimism that could further fuel upside momentum.
📊 Technical Setup: Bullish Continuation Potential
Price Action: The Nifty India Defence Index is currently trading near ₹7,891.65, showing signs of consolidation within a well-defined symmetrical triangle pattern. This formation is nested inside a broader ascending channel, indicating a long-term bullish structure.
Support Confirmation: Recent candles suggest that price is respecting the lower boundary of the channel, reinforcing it as a dynamic support zone.
Momentum Indicators: RSI readings across multiple timeframes (Weekly: 51.2, Monthly: 60.87) reflect neutral-to-positive momentum, with no signs of overbought conditions, leaving room for further upside.
📰 News-Driven Catalysts: Budget Optimism & Geopolitical Tailwinds
Recent developments have added fuel to the technical setup:
Pre-Budget Rally: Defence stocks like BEL, HAL, BDL, and Mazagon Dock have rallied up to 5% in early January 2026, driven by expectations of increased capital allocation in the upcoming Union Budget.
Geopolitical Escalation: The announcement of Operation Absolute Resolve and rising US-Venezuela tensions have triggered a global defence sector rally. Domestic players such as MTAR Technologies and Solar Industries surged over 6% and 3% respectively, pushing the Nifty Defence Index to a one-month high.
Policy Support: Fresh procurement approvals and a strategic push toward indigenous defence exports have reinforced investor confidence.
🔮 Forward Outlook: What to Watch
Factor Impact on Price Commentary
Triangle Breakout Bullish A breakout above the triangle’s upper trendline could trigger a sharp rally toward the channel’s upper boundary.
Budget 2026 Bullish Higher defence spending could act as a fundamental catalyst for sustained upside.
Global Tensions Bullish Continued geopolitical uncertainty may increase demand for defence assets.
RSI & Volume Neutral to Bullish RSI levels are constructive; watch for volume expansion on breakout confirmation.
🧭 Strategic Takeaway
If the index breaks above the triangle with volume confirmation, it could initiate a fresh leg toward ₹8,200–8,400, aligning with the channel’s upper resistance. Conversely, failure to hold the channel bottom (~₹7,700) may invite short-term consolidation. Traders should monitor budget announcements and global headlines closely, as they could act as immediate triggers.

$BIST:DENGE/FX:USDTRY update$BIST:DENGE/FX:USDTRY
risk of a decending triangle. cancelling long idea for now
