SPY when stars align!as i was helping someone better understand some of these terms, like golden pocket...
actually ill skip it. okay the SPY, everyone's favorite!... (to play 0dtes on) jk, i do it too sometimes.
This is a great example of a "high probability set up" . when you have multiple indicators pointing to the same thing.
we have not 1 not 2 not 3 but 4! indicators all lining up to a single area (when stars align, ahh) and it just so happens to be the area we were aiming for before we started charting. ADD CONVICTION
1. Previous S/R level & high volume area
2. Golden Pocket
3. Unfilled Gap
4. 50 Day Moving average
all lining up to the same key zone, that 402.50 area. im not saying we get there tomorrow or the next day, we could never see it again nothings for sure. but if we do this is a critical level of support. because if it holds, that's still a higher low on the daily and weekly time frame. what am i watching for this week? that 406.15 call it 406 to 407.50 area im watching to see if that holds support, or if we break through it and go down to test that 404.50 area. and if thats broken then im targeting 401.50 to 402.50/403.
Upside targets - almost every dollar is resistance and major major resistance around 417-422. 412 to 413.75 if we can get above that we could see alittle higher in the short term, im leaning slightly bearish to neutral. i want to see how the rest of the bank earnings affect the market this week. okay im tired and had to type this 3 separate times as this started with me showing a friend what the golden pocket was and how to use a basic fib. happy trading this week. cheers
Unfilledgap
Bitcoin - All levels on the weekly chart (must know!)
You can use these levels for your trades, because I am pretty sure we will see a reaction on all of them! These levels will be respected even on the 1-minute chart, so do not underestimate them!
If one of these levels is destroyed, it's likely that the price will move to the next level specified on the chart.
On the bullish side of the chart, we have a strong level that will be tested very soon. It's the POC of the previous market structure and a strong horizontal level at 29765.
Above this level, there is an unfilled GAP between 37836 and 32399. This is the only major unfilled GAP on the Binance chart. These types of gaps are called fair value GAPS.
0.618 LOG SCALE FIB (38981) is definitely the strongest resistance out there. Also, we have a POC of the previous structure exactly at the same level. If the price gets to this level, we will experience a massive, brutal crash. Make sure you get informed when we reach this level, so follow me to stay updated!
0.618 LINEAR SCALE FIB (48553) is at confluence with the previous swing high. It's definitely a strong resistance as well, but if the bulls destroy this level, then it opens the gate to a new all-time high (69000), which is the last resistance!
On the bearish side of the chart, there is only 1 strong level at this point, and it's the previous swing low at 15476. I think we will reach this level sometimes later this year or next year!
2 unfilled GAPs below the current price are also strong supports. They are between 22602 - 26508 and 17176 - 19549. I am telling you that these gaps are extremely massive, and the chances of filling them are soooooo high, sooner or later.
If the bulls fail to hold the 15476 level, we will go to 10k! It's a possible scenario, and it could happen, and the chances are not low at all.
Otherwise, this is a bearish Elliott Wave count, which is still my main count. Of course, I also have a bullish count, but I will switch to it after we reach levels above 43k.
This analysis is not a trade setup; there is no stop-loss, entry point, profit target, expected duration of the trade, risk-to-reward ratio, or timing. I post trade setups privately.
Thank you, and for more ideas, hit "Like" and "Follow"!
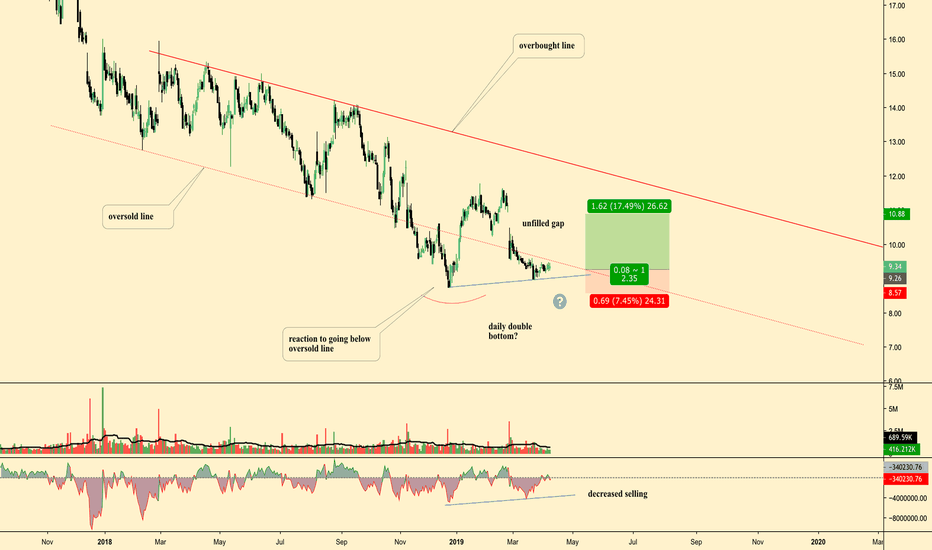
TIVO Long OppAnnotations and Ideas provided on chart
General Idea:
Possible Double Bottom, w/ second bottom forming higher low
decreased selling on second bottom
Price trading in oversold territory (below the channel)
Unfilled Gap that also coincides w/ local HVN (not marked)


