Gold Healthy PullbackGold is taking a short breather after a strong rally. Price recently tapped near the $4,230 zone before showing its first meaningful pullback in days.
The 33 EMA (pink line) is acting as dynamic support, if the price holds above it, we could see another leg higher toward the $4,280–$4,320 range. However, if that level breaks cleanly, the next strong demand sits around $4,020, where both the 100 EMA and previous accumulation zone align.
In simple terms, this is a healthy correction within a bullish trend. A bounce from either the 33 EMA or 100 EMA could easily trigger the next push upward.
Unichartz

Bitcoin Eyeing $108K ZoneCRYPTOCAP:BTC Daily Chart Analysis
Bitcoin is currently trading around $110,300, showing weakness after failing to hold higher levels. The market structure still looks corrective, and we can see price slowly drifting toward the nearest support zone around $108,000–$109,000.
If this zone holds, we might see a short-term bounce or relief rally. But if the market breaks below $108,000, the next major demand area lies near $104,000–$100,000, where buyers are likely waiting.
For now, the key is to watch how price reacts at this support. A strong bounce could confirm accumulation, while a breakdown might trigger deeper correction before any new bullish leg.
DYOR, NFA

TAO Eyes Next Leg Toward $700!BINANCE:TAOUSDT is breaking through a key resistance zone, signaling a strong shift in momentum.
This breakout not only confirms buyer strength but also opens the door for a potential move toward the $700 region, where the next major resistance lies.
As long as TAO holds above this breakout zone, the structure remains bullish and continuation toward higher levels looks likely.
DYOR, NFA
THANKS FOR THE READ

Altseason on the Horizon?Technically, BTC Dominance has retested the breakdown of the rising channel, confirming a clean rejection from the retest area.
If price manages to break below the current support zone, we could see a strong shift toward altcoins as capital starts rotating out of BTC.
This recent move also flushed out over-leveraged traders, resetting market positioning, a healthy sign before the next major leg.
Stay patient and always analyze your risk before entering any position. The next few weeks could be decisive for the altcoin market.
DYOR, NFA
Stay tuned for more update
THANKS FOR THE READING
#PEACE

Rebound in Motion: XLM Eyes Channel Top AgainCRYPTOCAP:XLM has bounced strongly from the lower trendline and re-entered the channel.
This move shows clear buyer strength and a potential shift in short-term momentum. As long as XLM holds within the channel, a retest of the upper boundary looks likely.

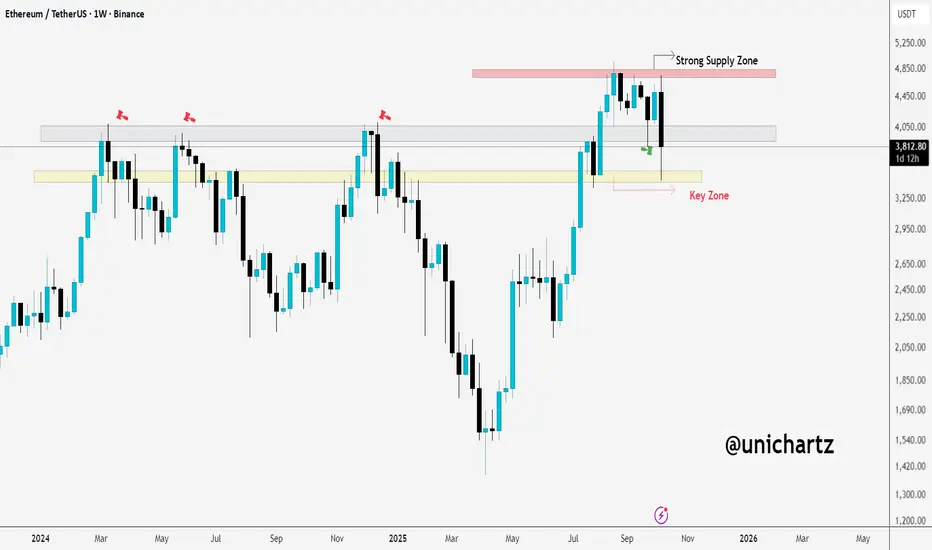
ETH in Danger: Breaking Below $3,200 Could Signal Bigger DropCRYPTOCAP:ETH is facing rejection from the strong supply zone around $4,800. The weekly candle failed to hold above that level and is now pulling back towards the key demand zone between $3,200–$3,300.
If the price fails to reclaim this support, we could see a more bearish scenario unfolding.
DYOR, NFA
Thanks for the reading
BTC Technicals Point to Strong Bullish Setup at $112K SupportLooking at this weekly CRYPTOCAP:BTC chart, you can see Bitcoin has been consistently holding above the 50 EMA, acting as solid support each time it retraces back to it. The key point to note here is how the price has tested this zone multiple times, forming a strong area of confluence. Each time, Bitcoin has successfully bounced, showing a solid structure to keep the uptrend intact.
At this moment, Bitcoin is facing resistance around $126,000, but the market looks strong, especially with the EMA holding as support. If the price breaks this resistance, we could be in for another leg up towards higher targets. The price action here indicates that bulls are in control, and the current setup suggests there's a good chance we might see more upside soon, especially if the zone around $112,000 holds as support.
Keep an eye on the key levels: if BTC holds above the 50 EMA and the confluence zone, the next push could be significant.
DYOR, NFA
#PEACE

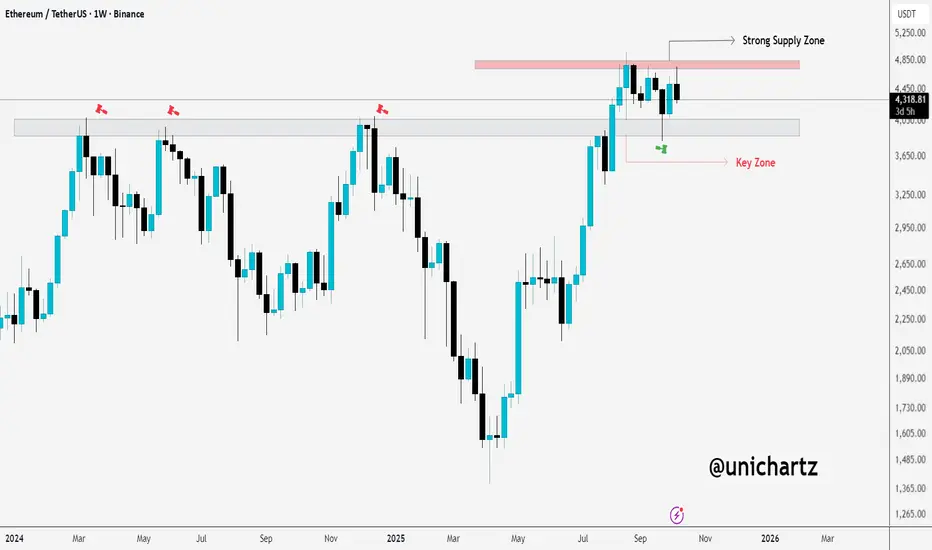
ETH at Critical Support: Can $3,850 Hold?CRYPTOCAP:ETH has faced a sharp rejection from the supply zone around $4,800 and is currently trading near $4,100. There's another strong support zone around $3,850.
I'm personally expecting a sharp rebound from this level. However, if the price fails to hold, we could see a further decline towards $3,600.
DYOR, NFA

BTC Dominance: Key Levels to WatchAfter the recent correction, BTC dominance is bouncing from the support zone at 59.64%. It looks like BTC dominance will likely retest the nearest resistance zone before any further downside.
If BTC.D breaks above this resistance, we could see more pressure on altcoins.
However, a rejection from this resistance zone could signal some relief for altcoins, giving them a chance to recover.
#PEACE
THANKS for the Read

TAO Surging Towards $415WRITE ANALYSIS
ChatGPT said:
TAO is approaching a critical resistance level near $415 after breaking above the descending trendline. This could lead to a test of the key zone, which has been a significant resistance in the past.
A successful break above this level might fuel further upside potential, while rejection could push the price back toward the support zone around $350–$375.
Keep an eye on price action around the key levels for potential breakout or pullback.
DYOR, NFA

$HYPER Near Demand Zone$HYPER is currently retesting its key support trendline after a steady uptrend.
If this zone holds, a rebound looks likely, but a breakdown could trigger deeper correction toward the S/R zone.
DYOR, NFA

ETH: Critical Levels to Watch Now!The chart shows Ethereum ( CRYPTOCAP:ETH ) on the weekly timeframe, and we're currently at a crucial point. Ethereum is approaching a strong supply zone around $4,800, which has acted as a resistance level in the past. This suggests that the price could face selling pressure in this range. If Ethereum fails to break through this level, it might experience a pullback or sideways movement.
On the other hand, the key zone around $4,100 is providing current support. As long as this level holds, there is potential for Ethereum to attempt another move upwards toward the supply zone at $4,800. However, if the price breaks below this key support zone, we could see a deeper pullback, possibly targeting lower support levels.
#PEACE
Stay tuned for more update
Breaking Resistance: Gold Eyes $4,500 by Year-EndLooking at this weekly chart of Gold (XAU/USD), we can clearly see the explosive price action that has been building up. The price has been climbing steadily, with the 33-period EMA providing strong support along the way. The breakout above the resistance zone is a strong signal that the bullish momentum is gaining strength.
However, the price is now approaching a key resistance level around $4,049, which could act as a significant hurdle. If this level holds, we might see some consolidation or a potential pullback before the next move up.
Keep an eye on how the price interacts with the resistance — a break above could signal further upside, while failure to break could lead to a retest of lower support levels. It’s a crucial moment for Gold, and any confirmation above this zone could trigger a strong continuation of the uptrend.

ADA Multi-Year Downtrend Nearing EndCardano CRYPTOCAP:ADA is forming higher lows and looks ready for a big breakout once it moves above the red resistance line. Price is currently in the accumulation zone, which means smart money might be loading up here.
Plan:
Buy Zone: Between 0.75 and 0.88
Stop Loss: Below 0.66 (if it drops there, the setup fails)
Targets:
TP1: 1.09
TP2: 1.35
TP3: 1.70
TP4: 2.18
TP5: 3.10
Strategy:
Start with a small position here. Add more only after a confirmed breakout above 0.90.
Once the first target hits, book some profits and move your stop loss to entry.
Note:
This is a long-term setup, could take several months to play out. Always do your own research (DYOR).

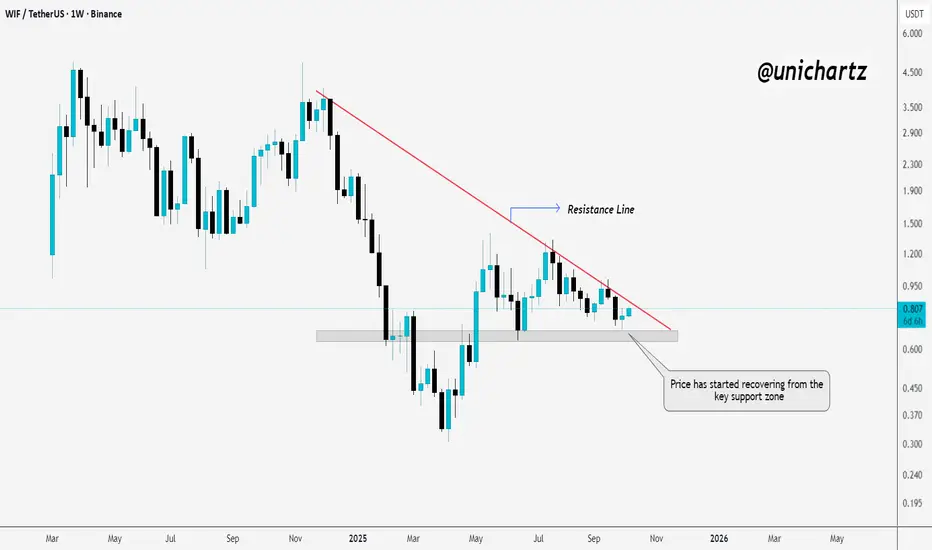
WIF Weekly Reversal SetupSEED_WANDERIN_JIMZIP900:WIF is showing early signs of strength after bouncing from the key support zone.
A breakout above the descending resistance line could confirm a fresh bullish wave.
DYOR, NFA
#PEACE
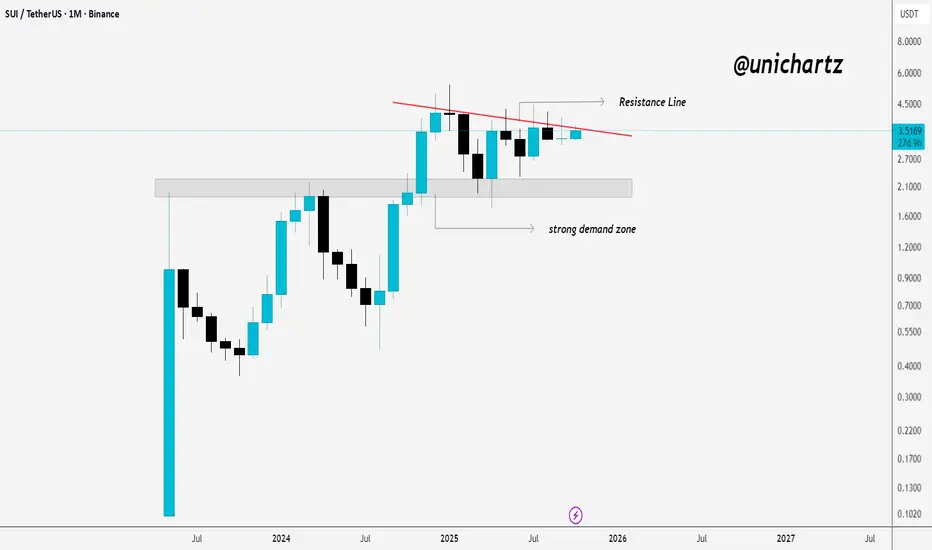
SUI Testing Monthly Resistance$SUI/USDT Monthly Chart
SUI is holding firm above the demand zone near $2.2, showing solid buyer interest. Price is now testing a descending resistance line that has capped previous rallies.
A monthly close above $3.8–$4 would signal a potential breakout and shift momentum toward the $5 zone. Until then, pullbacks to the demand area remain healthy for accumulation.
DYOR, NFA
$PUDGY: Watching for Flag Breakout
The CSECY:PENGU is still contained within the flag pattern, following a strong rally. While there’s upward momentum, the breakout hasn’t fully occurred yet.
Key points:
Resistance: Watch the 0.032 area as the flag's upper boundary. A breakout here could confirm a continuation of the bullish trend.
Support: The 0.026 support zone remains crucial. If price holds here, it could set up for another push higher.
For now, the price is stuck in the flag pattern, with the breakout above resistance being the next key move.
Follow us and stay tuned for more updates.
#PEACE
DYOR, NFA

SOL: Ready for a Big MoveWe can see CRYPTOCAP:SOL is currently in a period of accumulation, just like it was back in 2021 before a massive rally . The key rising support line has been holding up strong, and after periods of accumulation, the price has consistently exploded upwards, reaching new highs.
Right now , the price is approaching its previous all-time high (ATH), and if history repeats itself, we could be in for another "boom" phase. The price is holding well above the key support, which strengthens the bullish outlook.
Keep an eye on the price action around the ATH level, if we break through, it could signal the next major leg up. This setup looks very similar to past accumulation phases that led to significant price jumps.
#PEACE
Stay tuned for more updates

BNB Soars Above Key SupportLooking at this $BNB/USDT chart, here's a more concise breakdown:
Rising Support: The red line shows a strong support level that has held up since 2018, with the price bouncing off it several times, confirming its importance.
Accumulation Zone: Between 2020 and 2021, BNB traded sideways, building up buying pressure before the next move.
Breakout: After the accumulation phase, BNB broke out sharply, signaling the start of a strong upward trend.
Current Trend: The price is now above the rising support line, and the bullish momentum seems to be continuing, suggesting further potential upside.
In short , BNB is in a solid uptrend, with a key support line holding strong. The breakout indicates more gains ahead if the trend continues.

Price Poised for Bullish Flag Surge!$XRP/USDT chart shows an accumulation phase from April to June, followed by a breakout in July. Price is now testing a key zone, acting as support. If it holds, we could see more bullish momentum, especially with the triangle breakout. A break above 3.20 signals further upside.
If not, a retest of lower levels like the accumulation zone is possible. Watch for confirmation at this level.
DYOR, NFA

ETH Retest Done – ATH SoonEthereum has pulled back perfectly into its key resistance-turned-support zone and held strong. This successful retest is a healthy sign for the trend, showing buyers are stepping in to defend the level.
If momentum builds from here, CRYPTOCAP:ETH could gear up for another big leg higher toward new highs.
Stay tuned.
DYOR, NFA
Follow us for more market insights and daily updates on Tradingview.
#PEACE ✌

Bitcoin Roars Above $120K, ATH on the RadarBitcoin just blasted through resistance and is charging straight toward its all-time high.
The beast is alive and moving with power. 🚀
#PEACE

Gold’s Bull Run Could Test $4k by Year-EndGold has been on a powerful run, breaking out of previous consolidation zones and holding strong above its key moving averages. The momentum on the weekly chart looks intact, and price action is now pushing into the $3,800–$3,900 range.
If this trend continues, the next big psychological level to watch is $4,000. That zone also lines up with a strong area of interest where some profit-taking could happen. As long as gold stays above the 33 EMA and keeps closing strong on higher timeframes, the path toward $4k by year-end looks very realistic.
In short, buyers are clearly in control, and gold is steadily marching toward uncharted territory.
