WABI-BTC UPTrend is on its way. based upon 100 EMA and 55 EMA so close to cross each other and there white soldier i think is uptrend is coming. WLongby nightal1
Bitcoin waking up after being repeatedly poked with a stick..Good day Traders As I'm sure everyone and their pet poodle knows, bitcoin had a triangle breakout a few days ago with all the volume we were looking for. If you see my previous post, I thought we would first drop to just under $3k for a dead cat bounce to $5200, however, we've averted the weekly EMA15 and EMA200 bearish cross for now. The market was impatient and started the wave up without that drop and it seems we could be in the midst of a mid term change in trend already (just a pause in downtrend, as opposed to the end of the downtrend). Since we never had that drop, I think we could possibly reach an even higher fomo extension target than the $5200 I originally had in mind. During a strong trend reversal, it's not uncommon to have a 261.8 - 461.8 fib extension of the first breakout impulse wave. We have a number of bullish signals and patterns for a mid term trend change: Bullish crossover EMA10 and SMA100 about to take place Bullish crossover EMA10 and EMA50 complete (backtest to see how significant these crosses are on the daily chart) Price closed above SMA100, EMA10 and EMA50 on the daily Potential Inverse H&S - currently printing the right shoulder Breakout from symmetrical triangle (reversal scenario as opposed to the usual continuation pattern) I suspect we'll now have a 38.2-68.1 fib retracement of the recent breakout impulse). These impulse waves have been so strong that we haven't had much pullback since the start of Feb. We should find support at our daily SMA100, and start moving towards our IHS neckline for a potential breakout. The breakout will need strong increasing volume to break through major trendline resistance from our ATH. First TP is $4300/$4400 which is a 161.8 fib extension of the recent breakout impulse, and our daily SMA128 resistance, which has held as significant S/R in the past for bitcoin). This area has held as strong resistance since 28 November 2018, so we should have a better idea if this is in fact a change in trend once we reach those levels and assess the volume profile. If $4300/$4400 doesn't provide much resistance and we blast through with ease with increasing volume, then safe to say we're probably heading up, with a change in trend direction to fill those outstanding liquidity gaps in the $4- 5ks. Second TP is 261.8 fib extension target of $4760 - $4880 which is also the target for the inverse H&S. Third TP is the minimum target for the symmetrical triangle breakout, our daily SMA200 resistance and a 361.8 fib extension target of $5230/$5350. Any move above our daily SMA200, I expect to be a short-lived extension. That $6k resistance is not going to be an easy nut to crack, after serving as impenetrable support for almost a year and I suspect if we do fomo that high, we'll probably have a 461.8 fib bull trap extension limit of $5700-$5800, before resuming the downtrend from there, potentially to new lows. Good luck and happy trading! Previous chart: "Already bottomed" view (unlikely) : Longby Corn_ReaperUpdated 1112
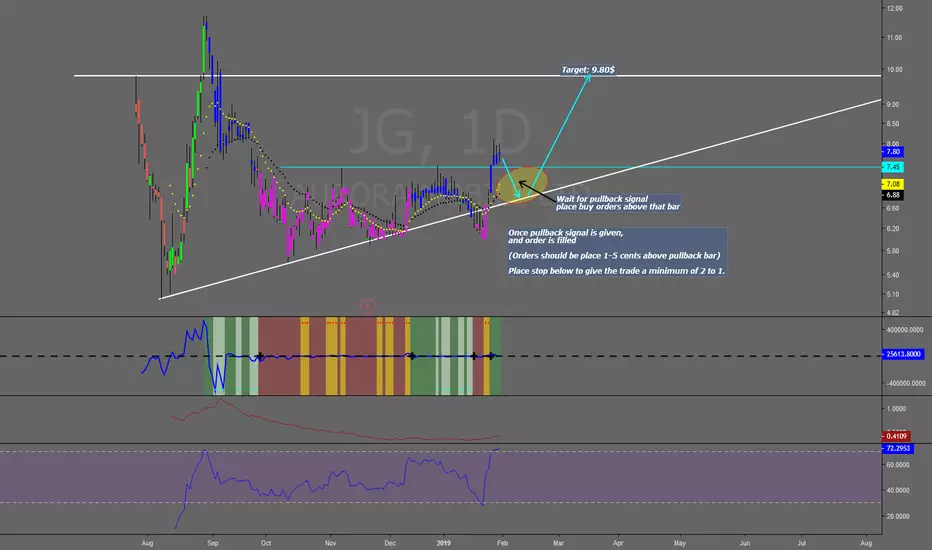
Pullback trade Pullback trade set up. Info is within the chart. Keep it simple. Best of luckLongby NYBKLYNUpdated 1
ETH/USDC longprice is forminh higher lows and higher highs . possible emma 8 cross over to the upside. possible retest of 111 price zone Longby yahdielo2
Buy GBPNZD +400pips | Best Chart UpdatedOpen Buy 1.8904 Goal: 1.9339 (Take Profit) +435pips SL : 1.8626 (-20pips only) Reasons: Strong Buyers at the New Support Area Price is ranging bouncing between support and resistance for 2 months. Enjoy!! WE OPEN ALREADY THIS ORDER !!!!Longby kingbabaofficielUpdated 6
EURUSD upward move The EURUSD is currently in a symmetrical triangle (blue trendlines). I believe this will break in a short term. I expect that it will make an upward movement. As you can see, the Elliot wave has been applied. Here you can find point E in the lower part of the triangle. If the elliot analysis is correct, the triangle will break in the next movement. I expect an uptrend because the green zone is currently being respected several times. Price is pushed upward multiple times. This gives an extra indication that we should think about a upward movement. Also there is a engulfing bar appearing. Nevertheless, it remains to be seen how this daily candle would close.These are motivations to believe that the EURUSD price will soon make an upward movement. If the analysis is correct, I would take a position with a TP at 1.15400 This is a level that is respected multiple times. So it is possible that this point can be a reversal point. Longby JvdB99Updated 4411
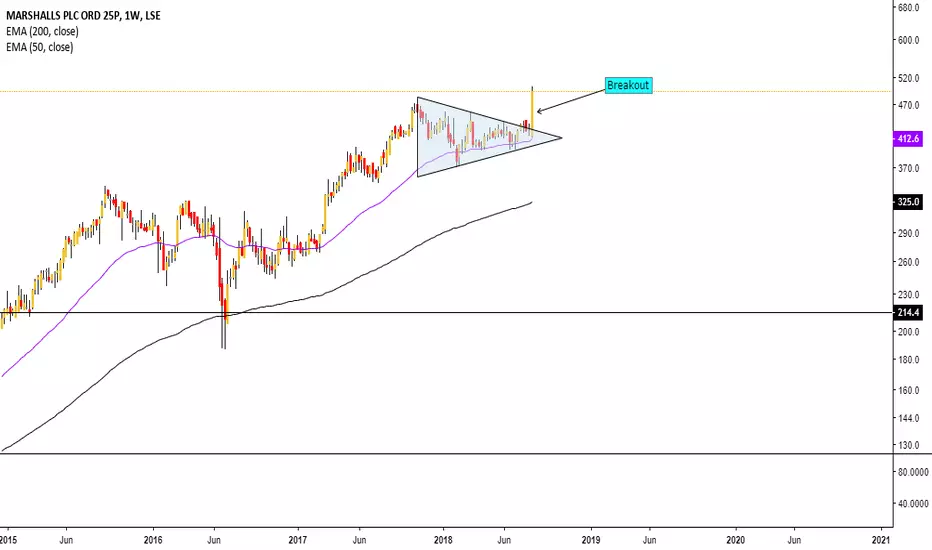
Convincing breakout for MSLH, despite "Beast from the East"Bullish, and breakout from a triangle pattern after good results. Target of around 550p. Longby andmk2Updated 3
GBP/USD buy rejection of houtly zone in confluence with fib retracement tool 0.382 and engulfing at the 1h. by yahdielo0
$GNL Channel up$GNL Testing bottom of the channel, close to support area. Let's see if it keep trending. $21.25 Longby Edogawa89Updated 3
BTC Ascending Triangle Bull Pump before correctionI think everyone is in agreement that this bull run is more persistent and consistent than expected and a correction could/should happen at anytime. I agree but it sure like this steady rise in growth isn't slowing down today. We are seeing an ascending triangle inside an ascending triangle, both bullish indicators that predict another pump in price. This may be the final move up in the short term before a correction would begin. My target for this action is 7600, with a correction back to 7100 over the week. 7100 would hit a previous support/resistance level and stay within my uptrend channel. Not advice to buy or sell! I'm just having fun (making money!) Have a Great Day! Longby bluemt95Updated 3
ZECUSDT/ZECUSD ZEC has broken out of it 27day downward channel!If you look yestday it broke out of the downward channel. It has come down and is attempting to use the former resistence line from the top of the channel. If it holds as support we could be starting mid term upward trend. As it has been in the a short-term upward trend for about 10 days, but now that we have broken out of that channel we still have many resistences to break such as one we have been below since Mays high and another since the high in January. We also have a current upward trendline if it breaks I am going to take profits. This is purely for education purposes for you and are my opinions this is not to be taken as trading advice.Zby bdfulker20
buy crudeoilbuy crudeoil cmp 66.32 sl 63.15( closing basis) target 1- 73.56 target 2- 89.27 target 3- 95.35 Longby ZanubiyaAbuUpdated 2
ADA/BTC - Cardano on the run !My 4 H chart says to me that Cardano may try to recover some ground ! Check it out ! The 13 MA is pointing up making me to believe its on its way to the first resistance level at 1888. If we pass 1888 we just need a hop above 1907 and then we brake the downtrend. What do you guys think about my logic ?Longby cmariusadrian114
EOS, Buy the Red, Sell the GreedEOS is nearing the 276 day uptrend which has held very strong and bounced off aggressively. We are also nearing a previous daily close meeting the trendline which is high confluence with oversold RSI conditions and volume squeeze. Leverage, 2x. Entry: 977 - 1020 Targets: 1300 1630 1950 2350 Stop Loss: Close Below 830 Risk:Reward = 14.5% : 34/69/103/144% Catalyst: Decentralized Exchange (2018/12/31) We are excited to announce EOSfinex - a high-performance, decentralized exchange to be built on EOS.IO Zoom out to see the full view. Dark Blue lines = Weekly swing highs/low. Light Blue lines = Daily swing highs/lowsLongby DyviumldUpdated 4
Finishing the 3rd Impulse Wave, now need a retraceWell that 3rd wave went up a bit higher and a lot faster than I expected. The bulls broke hard through the long term downtrend pink line. Now they need some good consolidation and retrace on the 4th wave to garner more support to get ready for the 5th wave. Ideally, the 4th wave retrace will drop back to the 6800-6900 level which should prove to be a good level of support now. Then the 5th wave will be free to move up to the 7800 level by Mid August. You can see I've then forecasted the abc correction wave back to the 6400-6600 level. This would be a really healthy sign representing a .618 fib level retracement by early September. Then we could begin another bull impulse wave through the previous resistance level of 7800 and go all the way up to 9200 level by October. Any other bullish EW folks have the same ideas? Have a great day!Longby bluemt95Updated 3
OMG another leg up sooner than laterOmiseGo is soft touching an ascending trend line, is in the pitchfork mid area, the only thing it needs is to cross above EMAs 10-26-55 and close the candle above them in the daily Chart. It's growth has been a sustainable one so I don't see other reason than a bitcoin price action reason not to have a healthy growth in the short-mid term for OMG. Modest Target should be the average line of the pitchfork in the mid run, that's over 300k sats. It also needs a lot of more volume and buying pressure to sustain the uptrend, but this is not outta ordinary situation in the actual market panorama. Can it go lower? yes, everything can turned out different in the next 12 hrs, at 6hrs chart it has support by Ichimoku cloud so the odds it can bounce from that point are good.Oby G0ldenross1
$ADA #CARDANO THIS IS WHY I LOVE TRADING CARDANO!!!!Hello Lads and Ladies, Today we are looking back into ADABTC one of my favourite coins to trade since almost 2 months now. It keeps the resistance and support lines very straight and respects them a lot. The price movement is also easy to predict if you are looking into this coin for a little while now. Previously we see ADABTC having a lot of price movement in the 3000 to 2850 channel. It left it once, went down to 2600, was wanting to go up, but somebody was selling 70btc worth of Cardamon at 2630, so we had a side movement for 2-3 days, from where it broke down again to 2400 immediately indicating that it is strongly oversold, especially when tracking the price hourly. From there it went up to 3000 as it was before having little stops at 2850. Then it made once again a movement from 3000 to 2850 to 3050 from where it came down to 2850 once again, as we see the chart right now. Since we are sitting at 2850 right now ADABTC needs to decide what to do. Either it tests the 2600 again or repeats its 3000 cycle. However, with the before standing news it should make a bigger scale move soon. The golden question is: Does ADABTC go down before it pumps again OR will it hover in its previous channel and then make a bigger move? I personally tend to believe that it will test the 2600 shortly again before the pump, just to pick up a better momentum. Although I would disagree with seeing it testing 2400 again. Here I would divide the probabilities in 85% and 15%. Everything around near 2600 is a good price to buy in, everything significantly below this line is a godly strong buy signal. In case of the pump we would have a strong resistance line at around 3100. Should we surpass this line, the next big stop will be at 3500 which also happens to be an overlaying double 61.8% fibs line.I very strongly believe that after reaching this one we will have a retracement back to the previous resistance line at 3100 which would act as a support line now. Anyhow, from there on the doors would be open for the strongly appealing and pulling target of 4185. I will locate a bigger chunk of sell orders all between 4050 and 4150 looking very closely when reaching these lines. Do not forget that there is always the small chance of around 0.5% that it will just RAGE QUIT, go completely opposite and retrace to the 1660 low of mid march!!! Either you #hodl or swing trade it - your decision what you are more comfortable with but both is very easy here : ) Like and Follow me and you will find this page interesting because I am a TA expert and day trader that does daily updates and new posts about the hottest and most discussed coins. Cheers, Tomas ALongby KongTrading1110
ETHUSD Bouncing back Up?1D Techinical Analysis shows almost 9 days in a row on the green side. Normally after that it came a retracement period (seems it was yesterday). Maybe not enough retracement after 9 days going up (we will see)? Our trade intends to catch the bounce back up to continue the lately Uptrend after yesterday retracement. Our Entry point would be 535 with a very Tight stop loss (Before traders we must be risk managers :)) If we don't reach our entry point, then no trade. Trade management and execution: I would take 1/4 of my position at each Take profit point. If after reaching T2, price come back to entry point, I would close the remaining position at the entry point. MT Alberto Longby KarySahUpdated 2
XVG HIGHER LOWShave the sellers been flushed out yet? still set up for higher low. uptrend looking solid.XLongby GJMRealEstate5
XRPBTC Bitcoin is going down, but Ripple has an uptrendDespite bitcoin going down and other alts following it, ripple seems to slightly go up. Resistance around 88k, I wonder what's next. Right now, as other alts are going down, ripple looks like a good alt to use to accumulate more BTC, but of course it's a risky thing. I'd personally buy when RSI is undersold and sell when it's close to the resistance, all of this just right now, not when it goes close to the apex (when the uptrend trend line crosses the resistance). I'm no financial advisor, just an idea/personal opinion.by kravenrobUpdated 6
ETH Coming Resistance and New highsETHEUR with current momentum is going to reach the next resistance soon. RSI at 1D chart is at 50.87 which is a sign of uptrend. Bears are trying to push the market down but the bulls are more active this weekend keeping the positive trend up. Most probably, within next week, ETH is going to touch the next resistance at 38.2% Fib which is arround 845ish Euro area and with this velocity we could have next high peak in 1D chart within a month time frame. Your comments are highly appreciated. Longby CheetahTrader4202