ETHUSD H4 | Bullish Bounce The price has bounced off our buy entry level at 3,050.58, which is a pullback support that aligns with the 50% Fibonacci retracement.
Our stop loss is set at 2,904.75, which is a pullback support that is slightly above the 78.6% Fibonacci retracement.
Our take profit is set at 3,270.27, which is a pullback resistance.
High Risk Investment Warning
Stratos Markets Limited (
USD

US Dollar: Bullish! Buy The Rip! Welcome back to the Weekly Forex Forecast for the week of Jan 12 - 16th.
In this video, we will analyze the following FX market: USD Dollar
The USD has had 2 weeks of bullish price action. A strong close last week showed good momentum to the upside. The buyside liquidity are the draw, so trade accordingly.
Be mindful that :
- Jan 13th is CPI Data news. High impact.
- Jan 14th there will be a tariffs decision by SCOUTUS that will likely impact the markets. Be careful trading on that Wed.
Enjoy!
May profits be upon you.
Leave any questions or comments in the comment section.
I appreciate any feedback from my viewers!
Disclaimer:
I do not provide personal investment advice and I am not a qualified licensed investment advisor.
All information found here, including any ideas, opinions, views, predictions, forecasts, commentaries, suggestions, expressed or implied herein, are for informational, entertainment or educational purposes only and should not be construed as personal investment advice. While the information provided is believed to be accurate, it may include errors or inaccuracies.
I will not and cannot be held liable for any actions you take as a result of anything you read here.
Conduct your own due diligence, or consult a licensed financial advisor or broker before making any and all investment decisions. Any investments, trades, speculations, or decisions made on the basis of any information found on this channel, expressed or implied herein, are committed at your own risk, financial or otherwise.

Bullish bounce off?Swissie (USD/CHF) is falling towards the pivot and could bounce to the 1st resistance, which has been identified as an overlap resistance.
Pivot: 0.7934
1st Support: 0.7898
1st Resistance: 0.7992
Disclaimer:
The opinions given above constitute general market commentary and do not constitute the opinion or advice of IC Markets or any form of personal or investment advice.
Any opinions, news, research, analyses, prices, other information, or links to third-party sites contained on this website are provided on an "as-is" basis, are intended to be informative only, and are not advice, a recommendation, research, a record of our trading prices, an offer of, or solicitation for, a transaction in any financial instrument and thus should not be treated as such. The information provided does not involve any specific investment objectives, financial situation, or needs of any specific person who may receive it. Please be aware that past performance is not a reliable indicator of future performance and/or results. Past performance or forward-looking scenarios based upon the reasonable beliefs of the third-party provider are not a guarantee of future performance. Actual results may differ materially from those anticipated in forward-looking or past performance statements. IC Markets makes no representation or warranty and assumes no liability as to the accuracy or completeness of the information provided, nor any loss arising from any investment based on a recommendation, forecast, or any information supplied by any third party

Could we see a reversal from here?Silver (XAG/USD) is reacting off the pivot and could drop to the pullback support.
Pivot: 85.35
1st Support: 77.60
1st Resistance: 88.28
Disclaimer:
The opinions given above constitute general market commentary and do not constitute the opinion or advice of IC Markets or any form of personal or investment advice.
Any opinions, news, research, analyses, prices, other information, or links to third-party sites contained on this website are provided on an "as-is" basis, are intended to be informative only, and are not advice, a recommendation, research, a record of our trading prices, an offer of, or solicitation for, a transaction in any financial instrument and thus should not be treated as such. The information provided does not involve any specific investment objectives, financial situation, or needs of any specific person who may receive it. Please be aware that past performance is not a reliable indicator of future performance and/or results. Past performance or forward-looking scenarios based upon the reasonable beliefs of the third-party provider are not a guarantee of future performance. Actual results may differ materially from those anticipated in forward-looking or past performance statements. IC Markets makes no representation or warranty and assumes no liability as to the accuracy or completeness of the information provided, nor any loss arising from any investment based on a recommendation, forecast, or any information supplied by any third party

Falling towards pullback support?Gold (XAU/USD) is falling towards the pivot and could bounce to the 1st resistance.
Pivot: 4,495.44
1st Support: 4,404.03
1st Resistance: 4,612.12
Disclaimer:
The opinions given above constitute general market commentary and do not constitute the opinion or advice of IC Markets or any form of personal or investment advice.
Any opinions, news, research, analyses, prices, other information, or links to third-party sites contained on this website are provided on an "as-is" basis, are intended to be informative only, and are not advice, a recommendation, research, a record of our trading prices, an offer of, or solicitation for, a transaction in any financial instrument and thus should not be treated as such. The information provided does not involve any specific investment objectives, financial situation, or needs of any specific person who may receive it. Please be aware that past performance is not a reliable indicator of future performance and/or results. Past performance or forward-looking scenarios based upon the reasonable beliefs of the third-party provider are not a guarantee of future performance. Actual results may differ materially from those anticipated in forward-looking or past performance statements. IC Markets makes no representation or warranty and assumes no liability as to the accuracy or completeness of the information provided, nor any loss arising from any investment based on a recommendation, forecast, or any information supplied by any third party

Bearish reversal for the Kiwi?The price is rising towards the pivot, which acts as an overlap resistance and could reverse to the 1st support.
Pivot: 0.5796
1st Support: 0.6748
1st Resistance; 0.5831
Disclaimer:
The opinions given above constitute general market commentary and do not constitute the opinion or advice of IC Markets or any form of personal or investment advice.
Any opinions, news, research, analyses, prices, other information, or links to third-party sites contained on this website are provided on an "as-is" basis, are intended to be informative only, and are not advice, a recommendation, research, a record of our trading prices, an offer of, or solicitation for, a transaction in any financial instrument and thus should not be treated as such. The information provided does not involve any specific investment objectives, financial situation, or needs of any specific person who may receive it. Please be aware that past performance is not a reliable indicator of future performance and/or results. Past performance or forward-looking scenarios based upon the reasonable beliefs of the third-party provider are not a guarantee of future performance. Actual results may differ materially from those anticipated in forward-looking or past performance statements. IC Markets makes no representation or warranty and assumes no liability as to the accuracy or completeness of the information provided, nor any loss arising from any investment based on a recommendation, forecast, or any information supplied by any third party

Bearish reversal off 50% Fib resistance?Aussie (AUD/USD) is reacting off the pivot and could reverse to the 1st support.
Pivot: 0.6718
1st Support: 0.6661
1st Resistance: 0.6752
Disclaimer:
The opinions given above constitute general market commentary and do not constitute the opinion or advice of IC Markets or any form of personal or investment advice.
Any opinions, news, research, analyses, prices, other information, or links to third-party sites contained on this website are provided on an "as-is" basis, are intended to be informative only, and are not advice, a recommendation, research, a record of our trading prices, an offer of, or solicitation for, a transaction in any financial instrument and thus should not be treated as such. The information provided does not involve any specific investment objectives, financial situation, or needs of any specific person who may receive it. Please be aware that past performance is not a reliable indicator of future performance and/or results. Past performance or forward-looking scenarios based upon the reasonable beliefs of the third-party provider are not a guarantee of future performance. Actual results may differ materially from those anticipated in forward-looking or past performance statements. IC Markets makes no representation or warranty and assumes no liability as to the accuracy or completeness of the information provided, nor any loss arising from any investment based on a recommendation, forecast, or any information supplied by any third party

BCHUSD H4 | Bearish BreakoutThe price is reacting off our sell entry level at 620.10, which is an overlap resistance.
Our stop loss is set at 660.37, which acts as a multi-swing high resistance.
Our take profit is set at 580.20, an overlap support.
High Risk Investment Warning
Stratos Markets Limited (

Bullish reversal setup?Fiber (EUR/USD) is falling towards the pivot, which acts as a pullback support, and could bounce to the 1st resistance, which is a pullback resistance.
Pivot: 1.1643
1st Support: 1.1617
1st Resistance: 1.1698
Disclaimer:
The opinions given above constitute general market commentary and do not constitute the opinion or advice of IC Markets or any form of personal or investment advice.
Any opinions, news, research, analyses, prices, other information, or links to third-party sites contained on this website are provided on an "as-is" basis, are intended to be informative only, and are not advice, a recommendation, research, a record of our trading prices, an offer of, or solicitation for, a transaction in any financial instrument and thus should not be treated as such. The information provided does not involve any specific investment objectives, financial situation, or needs of any specific person who may receive it. Please be aware that past performance is not a reliable indicator of future performance and/or results. Past performance or forward-looking scenarios based upon the reasonable beliefs of the third-party provider are not a guarantee of future performance. Actual results may differ materially from those anticipated in forward-looking or past performance statements. IC Markets makes no representation or warranty and assumes no liability as to the accuracy or completeness of the information provided, nor any loss arising from any investment based on a recommendation, forecast, or any information supplied by any third party

Bullish bounce off?USO/USD has bounced off the support level, which serves as a pullback support, and could bounce from this level to our take-profit.
Entry: 58.64|
Why we like it:
There is a pullback support level.
Stop loss: 57.36
Why we like it:
There is a pullback support level.
Take profit: 61.15
Why we like it:
There is a swing high resistance level.
Enjoying your TradingView experience? Review us!
Please be advised that the information presented on TradingView is provided to Vantage (‘Vantage Global Limited’, ‘we’) by a third-party provider (‘Everest Fortune Group’). Please be reminded that you are solely responsible for the trading decisions on your account. There is a very high degree of risk involved in trading. Any information and/or content is intended entirely for research, educational and informational purposes only and does not constitute investment or consultation advice or investment strategy. The information is not tailored to the investment needs of any specific person and therefore does not involve a consideration of any of the investment objectives, financial situation or needs of any viewer that may receive it. Kindly also note that past performance is not a reliable indicator of future results. Actual results may differ materially from those anticipated in forward-looking or past performance statements. We assume no liability as to the accuracy or completeness of any of the information and/or content provided herein and the Company cannot be held responsible for any omission, mistake nor for any loss or damage including without limitation to any loss of profit which may arise from reliance on any information supplied by Everest Fortune Group.

049: EUR/USD Long Investment Opportunity
In the currency market, there are movements that, to the untrained eye, may appear to be weakness. In reality, they are often a necessary step for more structured traders to position themselves efficiently. This is precisely what we are currently observing in the EUR/USD.
After a period of clearly visible bearish pressure, the exchange rate has shown clear signs of slowing. The decline was not accompanied by a true directional acceleration, but rather by a gradual absorption of momentum, typical of phases in which liquidity is raised before a potential turnaround.
Market Structure and Institutional Context
Analyzing the structure across multiple timeframes, it emerges that the downward movement is part of a broader rebalancing context. The lower areas have reacted in an orderly fashion, without impulsive breakouts, suggesting the presence of interest from significant traders.
This type of behavior is often associated with mitigation phases, in which the market returns to previously traded zones to allow for the construction of positions with an efficient risk profile. It's not about chasing the price, but waiting for the price to return to where the probabilities become asymmetric.
Price Action and Liquidity Management
From a price action perspective, the picture is consistent with a stop-hunting dynamic that has already occurred. Recent lows have attracted protective orders, which were subsequently absorbed without generating a credible downward continuation. This is one of the most reliable signs of exhaustion of short-term pressure.
When the market stops falling despite having "technical reasons" to do so, the message is clear: someone is patiently buying.
Volumes, Volatility, and the Absence of Panic
Another key element is volatility. There are no violent expansions or disorderly spikes. On the contrary, compression suggests a controlled environment, typical of accumulation phases. Volumes also confirm this interpretation, showing participation but not aggressive distribution.
In the absence of imminent macro shocks, this type of environment tends to favor progressive movements rather than chaotic reactions.
Sentiment and Positioning
Short-term sentiment remains biased toward the opposite side of the expected movement. Historically, when the less structured component of the market persists in one direction after a prolonged decline, the greatest risk is finding itself on the wrong side when the price reverses.
Institutional operators don't enter when the movement is evident. They enter when the market allows space, time, and liquidity.
Operational Scenario and Final Vision
The overall picture suggests a constructive configuration for a gradual recovery of the exchange rate. It's not a matter of anticipating an immediate explosion, but of positioning oneself at a time when the risk-to-potential return ratio becomes particularly favorable.
In these contexts, discipline matters more than speed. The market rewards those who wait, not those who rush.

NZDUSD LongHello traders, I am sharing my setup idea for the NZDUSD pair. According to the pattern I expect the pair to surge till the grey level.

Gold Breaks $4,600 on Fed Independence FearsGold Breaks Above $4,600 on Fed Independence Concerns
Gold surged to a record high above $4,600, supported by rising safe-haven demand after reports of a criminal probe involving Jerome Powell reignited concerns over the independence of the Federal Reserve.
The U.S. dollar weakened sharply, posting its worst decline in three weeks, as investors feared political pressure could tilt future policy in a more dovish direction. Geopolitical tensions, including unrest in Iran, further boosted demand for gold as a haven asset.
TECHNICAL VIEW (GOLD)
📈 Bullish Scenario
Bullish momentum remains active while price holds above the pivot zone (4581)
Upside targets: 4597
A 15M candle close above 4597 opens continuation toward 4619 and 4644
📉 Corrective Scenario
A 15M candle close below 4581 may trigger a pullback toward 4566
Acceptance below 4566 would signal a deeper correction toward 4546
Key Levels
Pivot Line: 4581
Resistance: 4597 – 4619 – 4644
Support: 4566 – 4546 – 4520

AUDUSD is Nearing an Important Support!Hey Traders, in today's trading session we are monitoring AUDUSD for a buying opportunity around 0.66600 zone, AUDUSD is trading in an uptrend and currently is in a correction phase in which it is approaching the trend at 0.66600 support and resistance area.
Trade safe, Joe.

USDCAD Breakout and Potential RetraceHey Traders, in today's trading session we are monitoring USDCAD for a selling opportunity around 1.38900 zone, USDCAD was trading in an uptrend and successfully managed to break it out. Currently is in a correction phase in which it is approaching the retrace area at 1.38900 support and resistance zone.
Trade safe, Joe.

GOLD H1 | Bullish ContinuationBased on the H1 chart analysis, we could see the price fall to our buy entry level at 4,547.47, which is a pullback support that aligns with the 23.6% Fibonacci retracement.
Our stop loss is set at 4,495.07, which corresponds to a pullback support that aligns with the 50% Fibonacci retracement.
Our take profit is set at 4,635.44, which lines up with the 100% Fibonacci projection.
High Risk Investment Warning
Stratos Markets Limited (

AUSSIE H1 | Bullish ReversalBased on the H1 chart analysis, we could see the price fall to our buy entry level at 0.6690, which is an overlap support.
Our stop loss is set at 0.6667, which is a multi-swing low support.
Our take profit is set at 0.6717, which is an overlap resistance that aligns with the 50% Fibonacci retracement.
High Risk Investment Warning
Stratos Markets Limited (

USDCAD H4 | Bearish Reversal Off overlap ResistanceBased on the H4 chart analysis, we can see the price reacting off our sell entry level at 1.3906, which is a pullback resistance.
Our stop loss is set at 1.3944, which is a pullback resistance that aligns with the 61.8% Fibonacci retracement.
Our take profit is set at .3824, which is a pullback support that aligns with the 38.2% Fibonacci retracement.
High Risk Investment Warning
Stratos Markets Limited (

USDCHF H4 | Bearish Reversal?The price has rejected off our sell entry level at 0.7992, which acts as an overlap resistance that aligns with the 61.8% Fibonacci retracement.
Our stop loss is set at 0.8025, which is a pullback resistance that is slightly below the 78.6% Fibonacci retracement.
Take profit is set at 0.7942, which is a pullback support that aligns with the 50% Fibonacci retracement.
High Risk Investment Warning
Stratos Markets Limited (

GBPUSD H4 | Could We See A Reversal From Here?The price is reacting off our sell entry level at 1.3428, which is an overlap resistance.
Our stop loss is set at 1.3472, which is a pullback resistance that aligns with the 50% Fibonacci retracement.
Our take profit is set at 1.3350, which is an overlap support that aligns with the 141.4% Fibonacci extension.
High Risk Investment Warning
Stratos Markets Limited (

EUR/USD H4 | Bearish Reversal SetupThe price is rising towards our sell entry level at 1.1678, which is an overlap resistance that is slightly below the 38.2% Fibonacci retracement.
Our stop loss is set at 1.1715, which is an overlap resistance that aligns with the 50% Fibonacci retracement.
Our take profit is set at 1.1609, which is an overlap support that aligns with the 61.8% Fibonacci retracement.
High Risk Investment Warning
Stratos Markets Limited (

USDOLLAR H4 | Bullish Bounce Off?The price is falling towards our buy entry level at 12.72, which is a pullback support that aligns with the 50% Fibonacci retracement.
Our stop loss is set at 12.70, which is a pullback support that is slightly above the 78.6% Fibonacci retracement.
Our take profit is set at 12.76, which is a multi swing high resistance.
High Risk Investment Warning
Stratos Markets Limited (

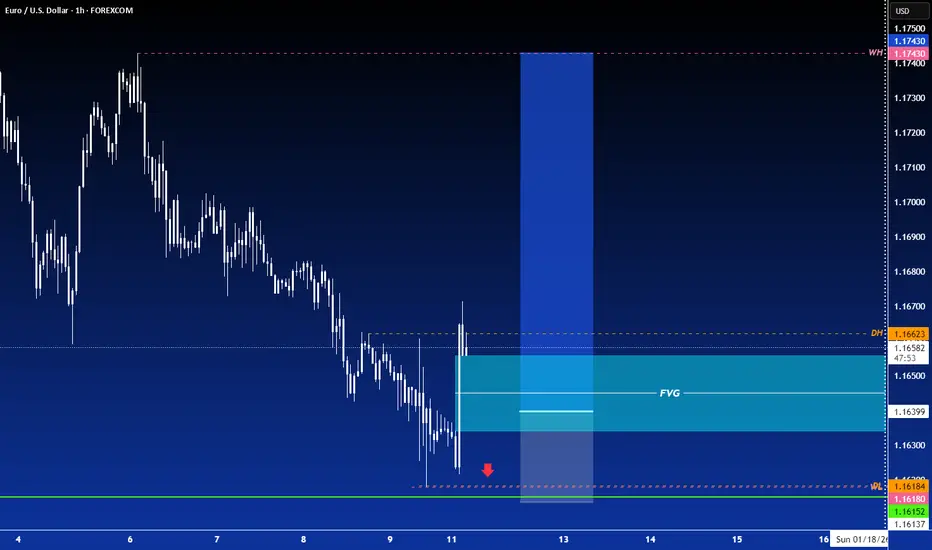
LONG ON EUR/USDEUR/USD has just given a CHOC (change of character) to the upside from is recent downtrend.
The dollar (DXY) is very bearish and I expect EUR/USD to simply retrace a little deeper into the FVG before it begins to rise.
looking to make 80-100 pips.