GOLD H1 | Bullish Bounce Off Key SupportThe price has bounced off our buy entry level at 4,793.14, which is an overlap support that is slightly below the 38.2% Fibonacci retracement.
Our stop loss is set at 4,618.83, which is a pullback support that is slightly below the 61.8% Fibonacci retracement.
Our take profit is set at 5,094.49, which is an overlap resistance.
High Risk Investment Warning
Stratos Markets Limited fxcm.com Stratos Europe Ltd fxcm.com
CFDs are complex instruments and come with a high risk of losing money rapidly due to leverage. 69% of retail investor accounts lose money when trading CFDs with this provider. You should consider whether you understand how CFDs work and whether you can afford to take the high risk of losing your money.
Stratos Global LLC fxcm.com Losses can exceed deposits.
Please be advised that the information presented on TradingView is provided to FXCM (‘Company’, ‘we’) by a third-party provider (‘TFA Global Pte Ltd’). Please be reminded that you are solely responsible for the trading decisions on your account. Any information and/or content is intended entirely for research, educational and informational purposes only and does not constitute investment or consultation advice or investment strategy. The information is not tailored to the investment needs of any specific person and therefore does not involve a consideration of any of the investment objectives, financial situation or needs of any viewer that may receive it. Past performance is not a reliable indicator of future results. Actual results may differ materially from those anticipated in forward-looking or past performance statements. We assume no liability as to the accuracy or completeness of any of the information and/or content provided herein and the Company cannot be held responsible for any omission, mistake nor for any loss or damage including without limitation to any loss of profit which may arise from reliance on any information supplied by TFA Global Pte Ltd.
Stratos Trading Pty. Limited fxcm.com
Trading FX/CFDs carries significant risks. FXCM AU (AFSL 309763), please read the Financial Services Guide, Product Disclosure Statement, Target Market Determination and Terms of Business at fxcm.com
USD

NZDUSD H1 | Bearish BreakoutThe price is rising towards our sell entry level at 0.5993, which is an overlap resistance that lines up with the 23.6% Fibonacci retracement.
Our stop loss is set at 0.6024, which is an overlap resistance that aligns with the 50% Fibonacci retracement.
Our take profit is set at 0.5928, whichis a pullback support.
High Risk Investment Warning
Stratos Markets Limited fxcm.com Stratos Europe Ltd fxcm.com
CFDs are complex instruments and come with a high risk of losing money rapidly due to leverage. 69% of retail investor accounts lose money when trading CFDs with this provider. You should consider whether you understand how CFDs work and whether you can afford to take the high risk of losing your money.
Stratos Global LLC fxcm.com Losses can exceed deposits.
Please be advised that the information presented on TradingView is provided to FXCM (‘Company’, ‘we’) by a third-party provider (‘TFA Global Pte Ltd’). Please be reminded that you are solely responsible for the trading decisions on your account. Any information and/or content is intended entirely for research, educational and informational purposes only and does not constitute investment or consultation advice or investment strategy. The information is not tailored to the investment needs of any specific person and therefore does not involve a consideration of any of the investment objectives, financial situation or needs of any viewer that may receive it. Past performance is not a reliable indicator of future results. Actual results may differ materially from those anticipated in forward-looking or past performance statements. We assume no liability as to the accuracy or completeness of any of the information and/or content provided herein and the Company cannot be held responsible for any omission, mistake nor for any loss or damage including without limitation to any loss of profit which may arise from reliance on any information supplied by TFA Global Pte Ltd.
Stratos Trading Pty. Limited fxcm.com
Trading FX/CFDs carries significant risks. FXCM AU (AFSL 309763), please read the Financial Services Guide, Product Disclosure Statement, Target Market Determination and Terms of Business at fxcm.com

Bullish continuation setup?WTI Oil (XTI/USD) is falling towards the pivot, which is an overlap support and could bounce to the 1st reistance, which acts as a swing high resistance.
Pivot: 62.02
1st Support: 60.27
1st Resistance: 66.23
Disclaimer:
The opinions given above constitute general market commentary and do not constitute the opinion or advice of IC Markets or any form of personal or investment advice.
Any opinions, news, research, analyses, prices, other information, or links to third-party sites contained on this website are provided on an "as-is" basis, are intended to be informative only, and are not advice, a recommendation, research, a record of our trading prices, an offer of, or solicitation for, a transaction in any financial instrument and thus should not be treated as such. The information provided does not involve any specific investment objectives, financial situation, or needs of any specific person who may receive it. Please be aware that past performance is not a reliable indicator of future performance and/or results. Past performance or forward-looking scenarios based upon the reasonable beliefs of the third-party provider are not a guarantee of future performance. Actual results may differ materially from those anticipated in forward-looking or past performance statements. IC Markets makes no representation or warranty and assumes no liability as to the accuracy or completeness of the information provided, nor any loss arising from any investment based on a recommendation, forecast, or any information supplied by any third party

Potential bearish reversal?USD/JPY is rising towards the pivot, which is a pullback resistance and could reverse to the 1st support, which is a pullback support.
Pivot: 157.71
1st Support: 155.94
1st Resistance: 159.37
Disclaimer:
The opinions given above constitute general market commentary and do not constitute the opinion or advice of IC Markets or any form of personal or investment advice.
Any opinions, news, research, analyses, prices, other information, or links to third-party sites contained on this website are provided on an "as-is" basis, are intended to be informative only, and are not advice, a recommendation, research, a record of our trading prices, an offer of, or solicitation for, a transaction in any financial instrument and thus should not be treated as such. The information provided does not involve any specific investment objectives, financial situation, or needs of any specific person who may receive it. Please be aware that past performance is not a reliable indicator of future performance and/or results. Past performance or forward-looking scenarios based upon the reasonable beliefs of the third-party provider are not a guarantee of future performance. Actual results may differ materially from those anticipated in forward-looking or past performance statements. IC Markets makes no representation or warranty and assumes no liability as to the accuracy or completeness of the information provided, nor any loss arising from any investment based on a recommendation, forecast, or any information supplied by any third party

Pullback resistance ahead?Swissie (USD/CHF) is rising towards the pivot, a pullback resistance that aligns with the 61.8% Fibonacci retracement, and could reverse to the 1st support.
Pivot: 0.7858
1st Support; 0.7697
1st Resistance: 0.7955
Disclaimer:
The opinions given above constitute general market commentary and do not constitute the opinion or advice of IC Markets or any form of personal or investment advice.
Any opinions, news, research, analyses, prices, other information, or links to third-party sites contained on this website are provided on an "as-is" basis, are intended to be informative only, and are not advice, a recommendation, research, a record of our trading prices, an offer of, or solicitation for, a transaction in any financial instrument and thus should not be treated as such. The information provided does not involve any specific investment objectives, financial situation, or needs of any specific person who may receive it. Please be aware that past performance is not a reliable indicator of future performance and/or results. Past performance or forward-looking scenarios based upon the reasonable beliefs of the third-party provider are not a guarantee of future performance. Actual results may differ materially from those anticipated in forward-looking or past performance statements. IC Markets makes no representation or warranty and assumes no liability as to the accuracy or completeness of the information provided, nor any loss arising from any investment based on a recommendation, forecast, or any information supplied by any third party

Bullish bounce off 61.8% Fib support?Cable (GBP/USD) is falling towards the pivot, a pullback support that aligns with the 61.8% Fibonacci retracement, and could bounce to the 1st resistance.
Pivot: 1.3550
1st Support: 1.3482
1st Resistance: 1.3713
Disclaimer:
The opinions given above constitute general market commentary and do not constitute the opinion or advice of IC Markets or any form of personal or investment advice.
Any opinions, news, research, analyses, prices, other information, or links to third-party sites contained on this website are provided on an "as-is" basis, are intended to be informative only, and are not advice, a recommendation, research, a record of our trading prices, an offer of, or solicitation for, a transaction in any financial instrument and thus should not be treated as such. The information provided does not involve any specific investment objectives, financial situation, or needs of any specific person who may receive it. Please be aware that past performance is not a reliable indicator of future performance and/or results. Past performance or forward-looking scenarios based upon the reasonable beliefs of the third-party provider are not a guarantee of future performance. Actual results may differ materially from those anticipated in forward-looking or past performance statements. IC Markets makes no representation or warranty and assumes no liability as to the accuracy or completeness of the information provided, nor any loss arising from any investment based on a recommendation, forecast, or any information supplied by any third party

Falling towards key support?Fiber (EUR/USD) is falling towards the pivot and could bounce to the 1st resistance.
Pivot: 1.1749
1st Support: 1.1691
1st Resistance: 1.1855
Disclaimer:
The opinions given above constitute general market commentary and do not constitute the opinion or advice of IC Markets or any form of personal or investment advice.
Any opinions, news, research, analyses, prices, other information, or links to third-party sites contained on this website are provided on an "as-is" basis, are intended to be informative only, and are not advice, a recommendation, research, a record of our trading prices, an offer of, or solicitation for, a transaction in any financial instrument and thus should not be treated as such. The information provided does not involve any specific investment objectives, financial situation, or needs of any specific person who may receive it. Please be aware that past performance is not a reliable indicator of future performance and/or results. Past performance or forward-looking scenarios based upon the reasonable beliefs of the third-party provider are not a guarantee of future performance. Actual results may differ materially from those anticipated in forward-looking or past performance statements. IC Markets makes no representation or warranty and assumes no liability as to the accuracy or completeness of the information provided, nor any loss arising from any investment based on a recommendation, forecast, or any information supplied by any third party

Bearish continuation?Ethereum (ETH/USD) has rejected off the pivot, which is a pullback resistance, and could drop to the 1st support.
Pivot: 2,185.81
1st Support: 1,952.49
1st Resistance: 2,347.75
Disclaimer:
The opinions given above constitute general market commentary and do not constitute the opinion or advice of IC Markets or any form of personal or investment advice.
Any opinions, news, research, analyses, prices, other information, or links to third-party sites contained on this website are provided on an "as-is" basis, are intended to be informative only, and are not advice, a recommendation, research, a record of our trading prices, an offer of, or solicitation for, a transaction in any financial instrument and thus should not be treated as such. The information provided does not involve any specific investment objectives, financial situation, or needs of any specific person who may receive it. Please be aware that past performance is not a reliable indicator of future performance and/or results. Past performance or forward-looking scenarios based upon the reasonable beliefs of the third-party provider are not a guarantee of future performance. Actual results may differ materially from those anticipated in forward-looking or past performance statements. IC Markets makes no representation or warranty and assumes no liability as to the accuracy or completeness of the information provided, nor any loss arising from any investment based on a recommendation, forecast, or any information supplied by any third party

GBPUSD Potential DownsidesHey Traders, in today's trading session we are monitoring GBPUSD for a selling opportunity around 1.37700 zone, GBPUSD is trading in a downtrend and currently is in a correction phase in which it is approaching the trend at 1.37700 support and resistance area.
Trade safe, Joe.

SILVER | Rebounds After Dramatic Two-Day SelloffSILVER | Rebounds After Sharp Two-Day Selloff
Silver prices rebounded above $89 per ounce, recovering part of the losses after a dramatic two-day selloff that erased nearly 40% from recent record highs. The rebound comes as markets reassess positioning after an extreme unwind.
The broader rally in precious metals earlier this year was supported by geopolitical and economic uncertainty, currency debasement concerns, and rising tension around Federal Reserve independence. In silver, a structural supply deficit and strong investment inflows, particularly from Chinese speculators, further amplified volatility.
Technical Outlook
Silver maintains a bullish structure while trading above the 85.40 pivot.
As long as price holds above 85.40, upside momentum is expected toward 91.00, followed by 95.44 and 99.11.
A 1H candle close below 85.40 would invalidate the bullish bias and shift momentum bearish, opening downside targets at 80.13, followed by 76.90 and 71.40.
Key Levels
• Pivot: 85.40
• Support: 80.13 – 76.90 – 71.40
• Resistance: 91.00 – 95.44 – 99.11

#053: LONG Investment Opportunity on GBP/USD
The sterlina is the protagonist of the market value, most of which has a resilience that does not pass through the protection of a professional operator. If you have a well-strutted rial sequence, it will change to a dollar that has a computer connection, which is similar to a physical break or a reverse signal. È owner in this moment when the transfer window riveted its nature more authentic.
The dynamics of the final session tell a story that tells the story: the benefit does not affect the structure of the background. The correct movement is subject to unexpected acceleration, with volume progressively absorbing and causing panic or aggressive distribution. This behavior is typical of the contested behavior of the operator who “refresses” it firstly to favor a new directional mode.
From the technical point of view, it changes if it changes internally in a consistent manner with a positive tendency during the medium period. The dynamic media continues to maintain the prezzo and the momentum indicators requiring a safe reset, especially before a start. No significant divergence has emerged due to structural changes in movement.
And the macroeconomic challenge contributes to strengthening this literature. The dollar benefits from a perception of greater relative strength, since the dollar appears more vulnerable to the risk of legal indecision following the evolution of the global economic cycle. With the imminent macro shock, the transfer window tends to increase the value of continuity and consistency with the fundamental quadruple.
In this scenario, the operation on the sterlin does not arise from the inseguiment of the prezzo, but it does not respond to a favored balance point. For a typical technical assessment, I prioritize the quality of the contest and the speed of the session. The transfer window, with another volta, seems to move more to absorb the EU, allowing space for a possible future movement to complete the consolidation phase.
In fact, the four-component system suggests that the stereo should simply be taken into account. Once the structure remained intact and the flow of light did not signal a change in speed, the background narrative remained oriented towards the continuation of positive motion. Ed is the owner in search of a quick and easy way to find the most interesting opportunity.

EURUSD Bias & Patience Tuesday looking like a rich day
HTF bais: bearish
Monday delivered downside extension as expected.
Price is now retracing into our sell zone at 1.1853 – 1.1836.
Watching for bearish reaction from that area to continue the weekly move lower.

Bullish reversal setup?USD/CHF is falling towards the support level, which is a pullback support that aligns with the 61.8% Fibonacci retracement and could bounce from this level to our take profit.
Entry: 0.7696
Why we like it:
There is a pullback support level that aligns with the 61.8% Fibonacci retracement.
Stop loss: 0.7599
Why we like it:
There is a swing low support level.
Take profit: 0.7828
Why we like it:
There is a pullback resistance that aligns with the 50% FIbonacci retracement.
Enjoying your TradingView experience? Review us!
Please be advised that the information presented on TradingView is provided to Vantage (‘Vantage Global Limited’, ‘we’) by a third-party provider (‘Everest Fortune Group’). Please be reminded that you are solely responsible for the trading decisions on your account. There is a very high degree of risk involved in trading. Any information and/or content is intended entirely for research, educational and informational purposes only and does not constitute investment or consultation advice or investment strategy. The information is not tailored to the investment needs of any specific person and therefore does not involve a consideration of any of the investment objectives, financial situation or needs of any viewer that may receive it. Kindly also note that past performance is not a reliable indicator of future results. Actual results may differ materially from those anticipated in forward-looking or past performance statements. We assume no liability as to the accuracy or completeness of any of the information and/or content provided herein and the Company cannot be held responsible for any omission, mistake nor for any loss or damage including without limitation to any loss of profit which may arise from reliance on any information supplied by Everest Fortune Group.

Bearish drop off?USD/CAD has rejected off the resistance level, which is a pullback resistance and could drop from this level to our take profit.
Entry: 1.3683
Why we like it:
There is a pullback resistance level.
Stop loss: 1.3760
Why we like it:
There is a pullback resistance that aligns with the 61.8% Fibonacci retracement.
Take profit: 1.3566
Why we like it:
There is a pullback support level that is a pullback support that aligns with the 61.8% Fibonacci retracement.
Enjoying your TradingView experience? Review us!
Please be advised that the information presented on TradingView is provided to Vantage (‘Vantage Global Limited’, ‘we’) by a third-party provider (‘Everest Fortune Group’). Please be reminded that you are solely responsible for the trading decisions on your account. There is a very high degree of risk involved in trading. Any information and/or content is intended entirely for research, educational and informational purposes only and does not constitute investment or consultation advice or investment strategy. The information is not tailored to the investment needs of any specific person and therefore does not involve a consideration of any of the investment objectives, financial situation or needs of any viewer that may receive it. Kindly also note that past performance is not a reliable indicator of future results. Actual results may differ materially from those anticipated in forward-looking or past performance statements. We assume no liability as to the accuracy or completeness of any of the information and/or content provided herein and the Company cannot be held responsible for any omission, mistake nor for any loss or damage including without limitation to any loss of profit which may arise from reliance on any information supplied by Everest Fortune Group.

Potential bearish reversal?US Dollar Index has rejected off the resistance level whic his a pullback resistance that aligns with the 50% Fibonacci retracement andcould drop from this level to our take profit.
Entry: 97.37
Why we like it:
There is a pullback resistance level that aligns with the 50% Finbonacc retracememt.
Stop loss: 97.93
Why we like it:
There is a pullback resistance that is slightly above the 61.8% Fibonacci retracement.
Take profit: 96.30
Why we like it:
There is a pullback support that is slightly below the 50% Fibonacci retracement.
Enjoying your TradingView experience? Review us!
Please be advised that the information presented on TradingView is provided to Vantage (‘Vantage Global Limited’, ‘we’) by a third-party provider (‘Everest Fortune Group’). Please be reminded that you are solely responsible for the trading decisions on your account. There is a very high degree of risk involved in trading. Any information and/or content is intended entirely for research, educational and informational purposes only and does not constitute investment or consultation advice or investment strategy. The information is not tailored to the investment needs of any specific person and therefore does not involve a consideration of any of the investment objectives, financial situation or needs of any viewer that may receive it. Kindly also note that past performance is not a reliable indicator of future results. Actual results may differ materially from those anticipated in forward-looking or past performance statements. We assume no liability as to the accuracy or completeness of any of the information and/or content provided herein and the Company cannot be held responsible for any omission, mistake nor for any loss or damage including without limitation to any loss of profit which may arise from reliance on any information supplied by Everest Fortune Group.

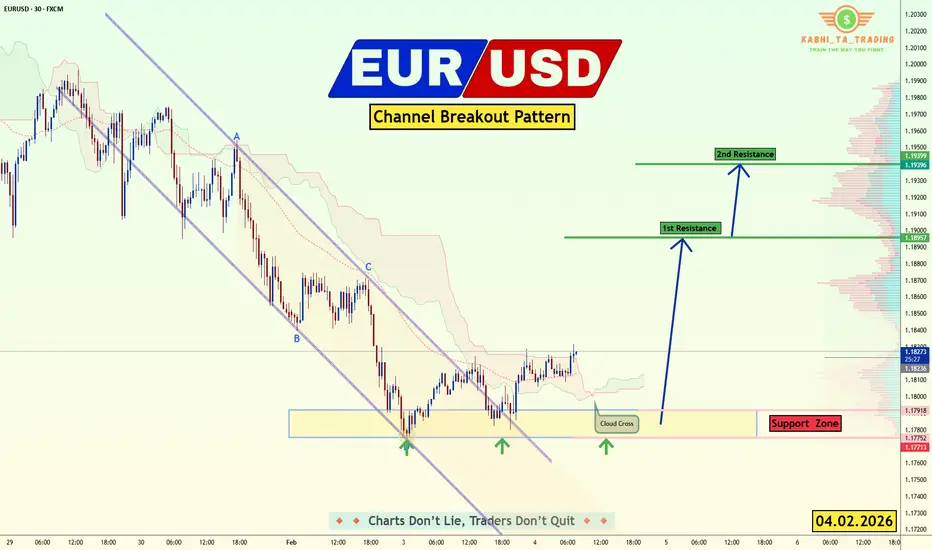
EUR/USD - Upside Expansion Next? (04.02.2026)📝 Description🔍 Setup FX:EURUSD
EUR/USD has been trading inside a descending channel and recently showed signs of structure shift after breaking and retesting the channel boundary.
Price reacted multiple times from the demand/support zone, forming higher lows.
Ichimoku shows a cloud cross and improving momentum, hinting at potential upside continuation.
This suggests sellers are weakening while buyers gradually gain control.
📍 Support & Resistance
🟥 Support Zone: 1.1790 – 1.1770
🟩 1st Resistance: 1.1895
🟩 2nd Resistance: 1.1940
⚠️ Disclaimer
This idea is for educational purposes only.
Forex trading involves risk. Always manage your risk and follow your own plan.
💬 Support the Idea 👍 Like if you see bullish continuation
💬 🔁 Share with fellow EUR/USD traders
#EURUSD #Forex #PriceAction #ChannelBreakout #BullishSetup #TradingView #SupportResistance #IntradayTrading #Kabhi_TATrading
GBP/USD – Fundamental Drive in Play (30.01.2026)📝 Description 🔍 Setup (Market + Fundamentals) FX:GBPUSD
GBP/USD has rallied strongly but is now facing heavy selling pressure at a well-defined resistance zone. Multiple rejections from the same supply area signal buyer exhaustion.
On the fundamental side, USD strength is supported by:
1.New Fed leadership announcement
2.Political agreement to avoid a US government shutdown, reducing uncertainty and favoring the dollar
Technically, price is breaking below the rising trendline, with EMA & Ichimoku losing bullish momentum.
📍 Support & Resistance
🟨 Resistance Zone: 1.3825 – 1.3865
🟥 1st Support: 1.3600
🟥 2nd Support: 1.3500
Volume profile supports downside liquidity below current price
⚠️ Disclaimer
This analysis is for educational purposes only.
Forex trading involves risk — always use proper risk management and trade responsibly.
💬 Support the Idea 👍 Like if you see GBP/USD turning bearish
💬 Comment: Sell from resistance or wait for deeper confirmation?
🔁 Share with traders watching USD fundamentals
#GBPUSD #ForexTrading #FundamentalAnalysis #PriceAction #ResistanceZone #USDStrength #TradingView #Kabhi_TA_Trading

EUR/USD – H1 - Fundamental Pressure Takes Control 📝 Description🔍 Setup (Fundamental + Technical) FX:EURUSD
EUR/USD has lost bullish structure after breaking below the rising trendline and confirming a bearish retest. Price is also trading below the Ichimoku cloud, with a bearish cloud crossover, signaling trend weakness.
📉 Fundamental catalyst:
1.Announcement of a new Fed Chair and political agreement to avoid a U.S. government shutdown
2. This reduces uncertainty and supports USD strength, pressuring EUR/USD lower
📍 Support & Resistance
🟨 Resistance Zone: 1.1980 – 1.2030
🟥 1st Support: 1.1715
🟥 2nd Support: 1.1620
Volume profile shows thin demand below, favoring continuation
#EURUSD #ForexTrading #FundamentalAnalysis #TrendlineBreak #BearishBias #USDStrength #PriceAction #TradingView #Kabhi_TA_Trading
⚠️ Disclaimer
This analysis is for educational purposes only.
Trading involves risk — always use proper risk management and trade with confirmation.
💬 Support the Idea👍 Like if you see EUR/USD heading lower
💬 Comment: Sell the retest or wait for breakdown continuation?
🔁 Share with traders watching USD fundamentals

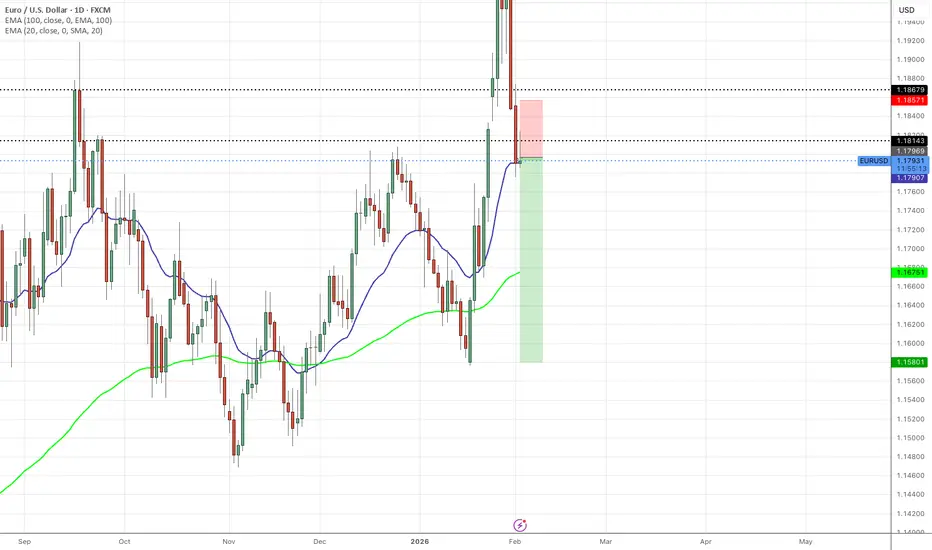
EURUSD SHORTS - IMMENSE SELL PRESSURE CONTINUATIONAfter closing in profit yesterdays move i am expecting a continuation of EURUSD sells.
EURUSD has failed to maintain price above 1.18679 support zone, we can see immense selling pressure on the daily and on the weekly a bearish pin bar candle this also in confluence with the dollars strength and the rising dollar.
I am expecting the pair to continue this downside momentum.
TP1: 1.17500
TP2; 1.16768
GBPUSD SHORTS UPDATED - MAJOR SUPPORT AND RESISTANCE BREAK On the daily we can see GBPUSD failed to maintain price above 1.37500 area with the last day of the month candle last week closing below.
Here we can see in the past a significant amount of sellers enter the market. Expecting the pair to go into a free fall.
After yesterdays retrace I have re entered expecting the bigger fall to start now
TP1: 1.35500
TP2: 1.34110

USDCAD H4 | Potential Bearish Drop OffBased on the H4 chart analysis, we can see that the price has rejected off our sell entry level at 1.3677, which is a pullback resistance.
Our stop loss is set at 1.3742, which is a pullback resistance that is slightly below the 61.8% Fibonacci retracement.
Our take profit is set at 1.3554, which is a pullback support.
High Risk Investment Warning
Stratos Markets Limited fxcm.com Stratos Europe Ltd fxcm.com
CFDs are complex instruments and come with a high risk of losing money rapidly due to leverage. 69% of retail investor accounts lose money when trading CFDs with this provider. You should consider whether you understand how CFDs work and whether you can afford to take the high risk of losing your money.
Stratos Global LLC fxcm.com/en: Losses can exceed deposits.
Please be advised that the information presented on TradingView is provided to FXCM (‘Company’, ‘we’) by a third-party provider (‘TFA Global Pte Ltd’). Please be reminded that you are solely responsible for the trading decisions on your account. Any information and/or content is intended entirely for research, educational and informational purposes only and does not constitute investment or consultation advice or investment strategy. The information is not tailored to the investment needs of any specific person and therefore does not involve a consideration of any of the investment objectives, financial situation or needs of any viewer that may receive it. Past performance is not a reliable indicator of future results. Actual results may differ materially from those anticipated in forward-looking or past performance statements. We assume no liability as to the accuracy or completeness of any of the information and/or content provided herein and the Company cannot be held responsible for any omission, mistake nor for any loss or damage including without limitation to any loss of profit which may arise from reliance on any information supplied by TFA Global Pte Ltd.
Stratos Trading Pty. Limited fxcm.com
Trading FX/CFDs carries significant risks. FXCM AU (AFSL 309763), please read the Financial Services Guide, Product Disclosure Statement, Target Market Determination and Terms of Business at fxcm.com

USDJPY H4 | Bullish Momentum To ExtendBased on the H4 chart analysis, we could see the price fall towards our buy entry level at 154.51, which is a pullback support that aligns with the 38.2% Fibonacci retracement.
Our stop loss is set at 153.58, which is a pullback support that aligns with the 61.8% Fibonacci retracement.
Our take profit is set at 157.19, which is a pullback resistance.
High Risk Investment Warning
Stratos Markets Limited fxcm.com Stratos Europe Ltd fxcm.com
CFDs are complex instruments and come with a high risk of losing money rapidly due to leverage. 69% of retail investor accounts lose money when trading CFDs with this provider. You should consider whether you understand how CFDs work and whether you can afford to take the high risk of losing your money.
Stratos Global LLC fxcm.com Losses can exceed deposits.
Please be advised that the information presented on TradingView is provided to FXCM (‘Company’, ‘we’) by a third-party provider (‘TFA Global Pte Ltd’). Please be reminded that you are solely responsible for the trading decisions on your account. Any information and/or content is intended entirely for research, educational and informational purposes only and does not constitute investment or consultation advice or investment strategy. The information is not tailored to the investment needs of any specific person and therefore does not involve a consideration of any of the investment objectives, financial situation or needs of any viewer that may receive it. Past performance is not a reliable indicator of future results. Actual results may differ materially from those anticipated in forward-looking or past performance statements. We assume no liability as to the accuracy or completeness of any of the information and/or content provided herein and the Company cannot be held responsible for any omission, mistake nor for any loss or damage including without limitation to any loss of profit which may arise from reliance on any information supplied by TFA Global Pte Ltd.
Stratos Trading Pty. Limited fxcm.com
Trading FX/CFDs carries significant risks. FXCM AU (AFSL 309763), please read the Financial Services Guide, Product Disclosure Statement, Target Market Determination and Terms of Business at fxcm.com

USDCHF H4 | Bullish Bounce SetupThe price is falling towards our buy entry level at 0.7693, which is a pullback support that is slightly below the 50% Fibonacci retracement.
Our stop loss is set at 0.7608, which is a swing low support.
Our take profit is set at 0.7861, which is a pullback resistance that aligns with the 61.8% Fibonacci retracement.
High Risk Investment Warning
Stratos Markets Limited fxcm.com Stratos Europe Ltd fxcm.com
CFDs are complex instruments and come with a high risk of losing money rapidly due to leverage. 69% of retail investor accounts lose money when trading CFDs with this provider. You should consider whether you understand how CFDs work and whether you can afford to take the high risk of losing your money.
Stratos Global LLC fxcm.com Losses can exceed deposits.
Please be advised that the information presented on TradingView is provided to FXCM (‘Company’, ‘we’) by a third-party provider (‘TFA Global Pte Ltd’). Please be reminded that you are solely responsible for the trading decisions on your account. Any information and/or content is intended entirely for research, educational and informational purposes only and does not constitute investment or consultation advice or investment strategy. The information is not tailored to the investment needs of any specific person and therefore does not involve a consideration of any of the investment objectives, financial situation or needs of any viewer that may receive it. Past performance is not a reliable indicator of future results. Actual results may differ materially from those anticipated in forward-looking or past performance statements. We assume no liability as to the accuracy or completeness of any of the information and/or content provided herein and the Company cannot be held responsible for any omission, mistake nor for any loss or damage including without limitation to any loss of profit which may arise from reliance on any information supplied by TFA Global Pte Ltd.
Stratos Trading Pty. Limited fxcm.com
Trading FX/CFDs carries significant risks. FXCM AU (AFSL 309763), please read the Financial Services Guide, Product Disclosure Statement, Target Market Determination and Terms of Business at fxcm.com
