AUDUSD Rally Into Sell Zone | Strong Dollar Theme Returns!Hey Traders,
In today’s trading session we are monitoring AUDUSD for a potential selling opportunity around the 0.70200 zone.
AUDUSD remains in a clear downtrend and is currently in a corrective pullback, approaching a confluence resistance area near 0.70200, where the descending trendline aligns with a key support-turned-resistance zone. This area could act as a sell-the-rally level if bearish momentum returns.
From a fundamental perspective, the recent Fed Chair nomination of Kevin Warsh is viewed as hawkish, which may support short-term USD strength. A stronger dollar typically pressures risk currencies like the Australian dollar, adding fundamental confluence to the bearish technical outlook.
As always, wait for confirmation and manage risk.
Trade safe,
Joe.
USD

Bullish bounce off?XAU/USD has bounced off the support level, which is an overlap support that is slightly above the 50% Fibonacci retracement and could rise from this level to our take profit.
Entry: 4,776.71
Why we like it:
There is an overlap support that is slightly above the 50% Fibonacci retracement.
Stop loss: 4,989.79
Why we like it:
There is a pullback support level that is slightly below the 78.6% Fibonacci retracement.
Take profit: 5,077.47
Why we like it:
There is a pullback resistance level.
Enjoying your TradingView experience? Review us!
Please be advised that the information presented on TradingView is provided to Vantage (‘Vantage Global Limited’, ‘we’) by a third-party provider (‘Everest Fortune Group’). Please be reminded that you are solely responsible for the trading decisions on your account. There is a very high degree of risk involved in trading. Any information and/or content is intended entirely for research, educational and informational purposes only and does not constitute investment or consultation advice or investment strategy. The information is not tailored to the investment needs of any specific person and therefore does not involve a consideration of any of the investment objectives, financial situation or needs of any viewer that may receive it. Kindly also note that past performance is not a reliable indicator of future results. Actual results may differ materially from those anticipated in forward-looking or past performance statements. We assume no liability as to the accuracy or completeness of any of the information and/or content provided herein and the Company cannot be held responsible for any omission, mistake nor for any loss or damage including without limitation to any loss of profit which may arise from reliance on any information supplied by Everest Fortune Group.

Bearish reversal off pullback resistance?USD/JPY is rising towards the resistance level, which is a pullback resistance that aligns with the 78.6% Fibonacci retracement and could reverse from this level to our take profit.
Entry: 157.71
Why we like it:
There is a pullback resistance level that aligns with the 78.6% Fibonacci retracement.
Stop loss: 159.39
Why we like it:
There is a swing high resistance level.
Take profit: 155.61
Why we like it:
There is a pullback support level.
Enjoying your TradingView experience? Review us!
Please be advised that the information presented on TradingView is provided to Vantage (‘Vantage Global Limited’, ‘we’) by a third-party provider (‘Everest Fortune Group’). Please be reminded that you are solely responsible for the trading decisions on your account. There is a very high degree of risk involved in trading. Any information and/or content is intended entirely for research, educational and informational purposes only and does not constitute investment or consultation advice or investment strategy. The information is not tailored to the investment needs of any specific person and therefore does not involve a consideration of any of the investment objectives, financial situation or needs of any viewer that may receive it. Kindly also note that past performance is not a reliable indicator of future results. Actual results may differ materially from those anticipated in forward-looking or past performance statements. We assume no liability as to the accuracy or completeness of any of the information and/or content provided herein and the Company cannot be held responsible for any omission, mistake nor for any loss or damage including without limitation to any loss of profit which may arise from reliance on any information supplied by Everest Fortune Group.

Bullish reversal off Fib levels?GBP/USD is reacting off the support level, which is a pullback support that aligns with the 61.8% Fibonacci retracement and the 78.6% Fibonacci projection, and could bounce from this level to our take profit.
Entry: 1.3548
Why we like it:
There is a pullback support level that aligns with the 61.8% Fibonaci retracement and the 78.6% Fibonacci projection.
Stop loss: 1.3479
Why we like it:
There is a pullback support level that aligns with the 100% Fibonacci projection.
Take profit: 1.3658
Why we like it:
There is a pullback resistance level.
Enjoying your TradingView experience? Review us!
Please be advised that the information presented on TradingView is provided to Vantage (‘Vantage Global Limited’, ‘we’) by a third-party provider (‘Everest Fortune Group’). Please be reminded that you are solely responsible for the trading decisions on your account. There is a very high degree of risk involved in trading. Any information and/or content is intended entirely for research, educational and informational purposes only and does not constitute investment or consultation advice or investment strategy. The information is not tailored to the investment needs of any specific person and therefore does not involve a consideration of any of the investment objectives, financial situation or needs of any viewer that may receive it. Kindly also note that past performance is not a reliable indicator of future results. Actual results may differ materially from those anticipated in forward-looking or past performance statements. We assume no liability as to the accuracy or completeness of any of the information and/or content provided herein and the Company cannot be held responsible for any omission, mistake nor for any loss or damage including without limitation to any loss of profit which may arise from reliance on any information supplied by Everest Fortune Group.

DOLLAR INDEX- BULLISH TO $102Right now there's a lot of gloom & doom around the DXY, with articles being published about it crashing. I'd be very careful as now is the time that institutions are more likely to buy the Dollar, while everyone else is scared off.
Confluences👇
⭕️A-B-C Correction Complete (3 Sub-Wave Correction).
⭕️Gold Bearish (Negative Correlation to DXY).
⭕️Downside LQ Grabbed From Multi-Month Low.

USDCHF - LONGS DOLLAR BULLS BACK Off the back of last week Friday we have seen dollar strength kickback into the markets.
The weekly candle closed with a wick sweeping liquidity at a major monthly support zone (0.77139) which held and buyers have come back into the market.
TP1: 0.78590
TP2: 0.79097
TP3:079550

USDCAD Q1 | D5 | W5 | Y26 ASIA RANGE BREAKDOWN !!! +5 % INCOMING📅 Q1 | D5 | W5 | Y26
📊 USDCAD — FRGNT DAILY FORECAST ASIA RANGE SHORT !!!!
🔍 Analysis Approach
I’m applying a developed version of Smart Money Concepts, with a structured focus on:
• Identifying Key Points of Interest (POIs) on Higher Time Frames (HTFs) 🕰️
• Using those POIs to define a clear and controlled trading range 📐
• Refining those zones on Lower Time Frames (LTFs) 🔎
• Waiting for a Break of Structure (BoS) as confirmation ✅
This process keeps me precise, disciplined, and aligned with market narrative, rather than reacting emotionally or chasing price.
💡 My Motto
“Capital management, discipline, and consistency in your trading edge.”
A positive risk-to-reward ratio, combined with a high-probability execution model, is the backbone of any sustainable trading plan 📈🔐
⚠️ On Losses
Losses are part of the mathematical reality of trading 🎲
They don’t define you — they are necessary, expected, and managed.
We acknowledge them, learn, and move forward 📊➡️
🙏 I appreciate you taking the time to review my Daily Forecast.
Further context and supporting material can be found in the Links section.
Stay sharp 🧠
Stay consistent 🎯
Protect your capital 🔐
— FRGNT 🚀📈
FX:USDCAD

EURUSD Market StructureEURUSD is trading mid-range.
London is set to push price into a key area: 1.1798–1.1803.
This suggests potential delivery into premium as we head into NY.
HTF bias remains bearish.
I’m only interested in shorts after premium is tapped and structure confirms.
No confirmation, no trade.
If it shows up, I execute.
If not, I stay flat.

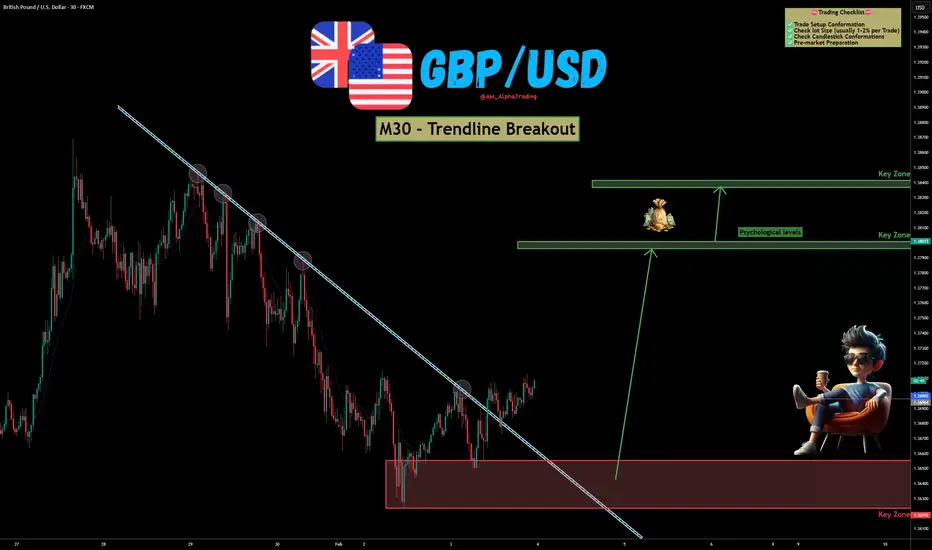
GBP/USD – Trendline Breakout | Bullish Reversal SetupGBP/USD has shown a clear breakout above a well-respected descending trendline on the M30 timeframe, hinting at a potential shift from bearish to bullish momentum. Price action is reacting strongly from a key demand zone, increasing the probability of continuation to the upside. OANDA:GBPUSD
📊 Technical Overview :
Price respected the descending trendline multiple times, confirming its validity.
The recent clean breakout and hold above the trendline suggests buyers are stepping in.
A strong base has formed at the lower demand zone, acting as a launchpad for the move.
Upside targets are aligned with psychological levels and higher-timeframe key zones, offering a favorable risk-to-reward setup.
As long as price holds above the breakout area, bullish continuation remains the preferred bias.
✅ Support this analysis with a
LIKE 👍 | COMMENT 💬 | FOLLOW 🔔
It helps a lot & keeps the ideas coming!
⚠️ Disclaimer: This analysis is for educational purposes only and does not constitute financial advice. Forex trading involves high risk. Trade only with capital you can afford to lose and always do your own research.
EURUSD - Analysis and EducationHere is an analysis on EURUSD and some learnings regarding liquidity, efficiency, and the manipulations that take place.
- R2F Trading

EURUSD — FRGNT DAILY FORECAST Q1 | D5 | W5 | Y26📅 Q1 | D5 | W5 | Y26
📊 EURUSD — FRGNT DAILY FORECAST
🔍 Analysis Approach
I’m applying a developed version of Smart Money Concepts, with a structured focus on:
• Identifying Key Points of Interest (POIs) on Higher Time Frames (HTFs) 🕰️
• Using those POIs to define a clear and controlled trading range 📐
• Refining those zones on Lower Time Frames (LTFs) 🔎
• Waiting for a Break of Structure (BoS) as confirmation ✅
This process keeps me precise, disciplined, and aligned with market narrative, rather than reacting emotionally or chasing price.
💡 My Motto
“Capital management, discipline, and consistency in your trading edge.”
A positive risk-to-reward ratio, combined with a high-probability execution model, is the backbone of any sustainable trading plan 📈🔐
⚠️ On Losses
Losses are part of the mathematical reality of trading 🎲
They don’t define you — they are necessary, expected, and managed.
We acknowledge them, learn, and move forward 📊➡️
🙏 I appreciate you taking the time to review my Daily Forecast.
Further context and supporting material can be found in the Links section.
Stay sharp 🧠
Stay consistent 🎯
Protect your capital 🔐
— FRGNT 🚀📈
FX:EURUSD

GOLD H1 | Bullish Bounce Off Key SupportThe price has bounced off our buy entry level at 4,793.14, which is an overlap support that is slightly below the 38.2% Fibonacci retracement.
Our stop loss is set at 4,618.83, which is a pullback support that is slightly below the 61.8% Fibonacci retracement.
Our take profit is set at 5,094.49, which is an overlap resistance.
High Risk Investment Warning
Stratos Markets Limited fxcm.com Stratos Europe Ltd fxcm.com
CFDs are complex instruments and come with a high risk of losing money rapidly due to leverage. 69% of retail investor accounts lose money when trading CFDs with this provider. You should consider whether you understand how CFDs work and whether you can afford to take the high risk of losing your money.
Stratos Global LLC fxcm.com Losses can exceed deposits.
Please be advised that the information presented on TradingView is provided to FXCM (‘Company’, ‘we’) by a third-party provider (‘TFA Global Pte Ltd’). Please be reminded that you are solely responsible for the trading decisions on your account. Any information and/or content is intended entirely for research, educational and informational purposes only and does not constitute investment or consultation advice or investment strategy. The information is not tailored to the investment needs of any specific person and therefore does not involve a consideration of any of the investment objectives, financial situation or needs of any viewer that may receive it. Past performance is not a reliable indicator of future results. Actual results may differ materially from those anticipated in forward-looking or past performance statements. We assume no liability as to the accuracy or completeness of any of the information and/or content provided herein and the Company cannot be held responsible for any omission, mistake nor for any loss or damage including without limitation to any loss of profit which may arise from reliance on any information supplied by TFA Global Pte Ltd.
Stratos Trading Pty. Limited fxcm.com
Trading FX/CFDs carries significant risks. FXCM AU (AFSL 309763), please read the Financial Services Guide, Product Disclosure Statement, Target Market Determination and Terms of Business at fxcm.com

NZDUSD H1 | Bearish BreakoutThe price is rising towards our sell entry level at 0.5993, which is an overlap resistance that lines up with the 23.6% Fibonacci retracement.
Our stop loss is set at 0.6024, which is an overlap resistance that aligns with the 50% Fibonacci retracement.
Our take profit is set at 0.5928, whichis a pullback support.
High Risk Investment Warning
Stratos Markets Limited fxcm.com Stratos Europe Ltd fxcm.com
CFDs are complex instruments and come with a high risk of losing money rapidly due to leverage. 69% of retail investor accounts lose money when trading CFDs with this provider. You should consider whether you understand how CFDs work and whether you can afford to take the high risk of losing your money.
Stratos Global LLC fxcm.com Losses can exceed deposits.
Please be advised that the information presented on TradingView is provided to FXCM (‘Company’, ‘we’) by a third-party provider (‘TFA Global Pte Ltd’). Please be reminded that you are solely responsible for the trading decisions on your account. Any information and/or content is intended entirely for research, educational and informational purposes only and does not constitute investment or consultation advice or investment strategy. The information is not tailored to the investment needs of any specific person and therefore does not involve a consideration of any of the investment objectives, financial situation or needs of any viewer that may receive it. Past performance is not a reliable indicator of future results. Actual results may differ materially from those anticipated in forward-looking or past performance statements. We assume no liability as to the accuracy or completeness of any of the information and/or content provided herein and the Company cannot be held responsible for any omission, mistake nor for any loss or damage including without limitation to any loss of profit which may arise from reliance on any information supplied by TFA Global Pte Ltd.
Stratos Trading Pty. Limited fxcm.com
Trading FX/CFDs carries significant risks. FXCM AU (AFSL 309763), please read the Financial Services Guide, Product Disclosure Statement, Target Market Determination and Terms of Business at fxcm.com

Bullish continuation setup?WTI Oil (XTI/USD) is falling towards the pivot, which is an overlap support and could bounce to the 1st reistance, which acts as a swing high resistance.
Pivot: 62.02
1st Support: 60.27
1st Resistance: 66.23
Disclaimer:
The opinions given above constitute general market commentary and do not constitute the opinion or advice of IC Markets or any form of personal or investment advice.
Any opinions, news, research, analyses, prices, other information, or links to third-party sites contained on this website are provided on an "as-is" basis, are intended to be informative only, and are not advice, a recommendation, research, a record of our trading prices, an offer of, or solicitation for, a transaction in any financial instrument and thus should not be treated as such. The information provided does not involve any specific investment objectives, financial situation, or needs of any specific person who may receive it. Please be aware that past performance is not a reliable indicator of future performance and/or results. Past performance or forward-looking scenarios based upon the reasonable beliefs of the third-party provider are not a guarantee of future performance. Actual results may differ materially from those anticipated in forward-looking or past performance statements. IC Markets makes no representation or warranty and assumes no liability as to the accuracy or completeness of the information provided, nor any loss arising from any investment based on a recommendation, forecast, or any information supplied by any third party

Potential bearish reversal?USD/JPY is rising towards the pivot, which is a pullback resistance and could reverse to the 1st support, which is a pullback support.
Pivot: 157.71
1st Support: 155.94
1st Resistance: 159.37
Disclaimer:
The opinions given above constitute general market commentary and do not constitute the opinion or advice of IC Markets or any form of personal or investment advice.
Any opinions, news, research, analyses, prices, other information, or links to third-party sites contained on this website are provided on an "as-is" basis, are intended to be informative only, and are not advice, a recommendation, research, a record of our trading prices, an offer of, or solicitation for, a transaction in any financial instrument and thus should not be treated as such. The information provided does not involve any specific investment objectives, financial situation, or needs of any specific person who may receive it. Please be aware that past performance is not a reliable indicator of future performance and/or results. Past performance or forward-looking scenarios based upon the reasonable beliefs of the third-party provider are not a guarantee of future performance. Actual results may differ materially from those anticipated in forward-looking or past performance statements. IC Markets makes no representation or warranty and assumes no liability as to the accuracy or completeness of the information provided, nor any loss arising from any investment based on a recommendation, forecast, or any information supplied by any third party

Pullback resistance ahead?Swissie (USD/CHF) is rising towards the pivot, a pullback resistance that aligns with the 61.8% Fibonacci retracement, and could reverse to the 1st support.
Pivot: 0.7858
1st Support; 0.7697
1st Resistance: 0.7955
Disclaimer:
The opinions given above constitute general market commentary and do not constitute the opinion or advice of IC Markets or any form of personal or investment advice.
Any opinions, news, research, analyses, prices, other information, or links to third-party sites contained on this website are provided on an "as-is" basis, are intended to be informative only, and are not advice, a recommendation, research, a record of our trading prices, an offer of, or solicitation for, a transaction in any financial instrument and thus should not be treated as such. The information provided does not involve any specific investment objectives, financial situation, or needs of any specific person who may receive it. Please be aware that past performance is not a reliable indicator of future performance and/or results. Past performance or forward-looking scenarios based upon the reasonable beliefs of the third-party provider are not a guarantee of future performance. Actual results may differ materially from those anticipated in forward-looking or past performance statements. IC Markets makes no representation or warranty and assumes no liability as to the accuracy or completeness of the information provided, nor any loss arising from any investment based on a recommendation, forecast, or any information supplied by any third party

Bullish bounce off 61.8% Fib support?Cable (GBP/USD) is falling towards the pivot, a pullback support that aligns with the 61.8% Fibonacci retracement, and could bounce to the 1st resistance.
Pivot: 1.3550
1st Support: 1.3482
1st Resistance: 1.3713
Disclaimer:
The opinions given above constitute general market commentary and do not constitute the opinion or advice of IC Markets or any form of personal or investment advice.
Any opinions, news, research, analyses, prices, other information, or links to third-party sites contained on this website are provided on an "as-is" basis, are intended to be informative only, and are not advice, a recommendation, research, a record of our trading prices, an offer of, or solicitation for, a transaction in any financial instrument and thus should not be treated as such. The information provided does not involve any specific investment objectives, financial situation, or needs of any specific person who may receive it. Please be aware that past performance is not a reliable indicator of future performance and/or results. Past performance or forward-looking scenarios based upon the reasonable beliefs of the third-party provider are not a guarantee of future performance. Actual results may differ materially from those anticipated in forward-looking or past performance statements. IC Markets makes no representation or warranty and assumes no liability as to the accuracy or completeness of the information provided, nor any loss arising from any investment based on a recommendation, forecast, or any information supplied by any third party

Falling towards key support?Fiber (EUR/USD) is falling towards the pivot and could bounce to the 1st resistance.
Pivot: 1.1749
1st Support: 1.1691
1st Resistance: 1.1855
Disclaimer:
The opinions given above constitute general market commentary and do not constitute the opinion or advice of IC Markets or any form of personal or investment advice.
Any opinions, news, research, analyses, prices, other information, or links to third-party sites contained on this website are provided on an "as-is" basis, are intended to be informative only, and are not advice, a recommendation, research, a record of our trading prices, an offer of, or solicitation for, a transaction in any financial instrument and thus should not be treated as such. The information provided does not involve any specific investment objectives, financial situation, or needs of any specific person who may receive it. Please be aware that past performance is not a reliable indicator of future performance and/or results. Past performance or forward-looking scenarios based upon the reasonable beliefs of the third-party provider are not a guarantee of future performance. Actual results may differ materially from those anticipated in forward-looking or past performance statements. IC Markets makes no representation or warranty and assumes no liability as to the accuracy or completeness of the information provided, nor any loss arising from any investment based on a recommendation, forecast, or any information supplied by any third party

Bearish continuation?Ethereum (ETH/USD) has rejected off the pivot, which is a pullback resistance, and could drop to the 1st support.
Pivot: 2,185.81
1st Support: 1,952.49
1st Resistance: 2,347.75
Disclaimer:
The opinions given above constitute general market commentary and do not constitute the opinion or advice of IC Markets or any form of personal or investment advice.
Any opinions, news, research, analyses, prices, other information, or links to third-party sites contained on this website are provided on an "as-is" basis, are intended to be informative only, and are not advice, a recommendation, research, a record of our trading prices, an offer of, or solicitation for, a transaction in any financial instrument and thus should not be treated as such. The information provided does not involve any specific investment objectives, financial situation, or needs of any specific person who may receive it. Please be aware that past performance is not a reliable indicator of future performance and/or results. Past performance or forward-looking scenarios based upon the reasonable beliefs of the third-party provider are not a guarantee of future performance. Actual results may differ materially from those anticipated in forward-looking or past performance statements. IC Markets makes no representation or warranty and assumes no liability as to the accuracy or completeness of the information provided, nor any loss arising from any investment based on a recommendation, forecast, or any information supplied by any third party

GBPUSD Potential DownsidesHey Traders, in today's trading session we are monitoring GBPUSD for a selling opportunity around 1.37700 zone, GBPUSD is trading in a downtrend and currently is in a correction phase in which it is approaching the trend at 1.37700 support and resistance area.
Trade safe, Joe.

SILVER | Rebounds After Dramatic Two-Day SelloffSILVER | Rebounds After Sharp Two-Day Selloff
Silver prices rebounded above $89 per ounce, recovering part of the losses after a dramatic two-day selloff that erased nearly 40% from recent record highs. The rebound comes as markets reassess positioning after an extreme unwind.
The broader rally in precious metals earlier this year was supported by geopolitical and economic uncertainty, currency debasement concerns, and rising tension around Federal Reserve independence. In silver, a structural supply deficit and strong investment inflows, particularly from Chinese speculators, further amplified volatility.
Technical Outlook
Silver maintains a bullish structure while trading above the 85.40 pivot.
As long as price holds above 85.40, upside momentum is expected toward 91.00, followed by 95.44 and 99.11.
A 1H candle close below 85.40 would invalidate the bullish bias and shift momentum bearish, opening downside targets at 80.13, followed by 76.90 and 71.40.
Key Levels
• Pivot: 85.40
• Support: 80.13 – 76.90 – 71.40
• Resistance: 91.00 – 95.44 – 99.11

#053: LONG Investment Opportunity on GBP/USD
The sterlina is the protagonist of the market value, most of which has a resilience that does not pass through the protection of a professional operator. If you have a well-strutted rial sequence, it will change to a dollar that has a computer connection, which is similar to a physical break or a reverse signal. È owner in this moment when the transfer window riveted its nature more authentic.
The dynamics of the final session tell a story that tells the story: the benefit does not affect the structure of the background. The correct movement is subject to unexpected acceleration, with volume progressively absorbing and causing panic or aggressive distribution. This behavior is typical of the contested behavior of the operator who “refresses” it firstly to favor a new directional mode.
From the technical point of view, it changes if it changes internally in a consistent manner with a positive tendency during the medium period. The dynamic media continues to maintain the prezzo and the momentum indicators requiring a safe reset, especially before a start. No significant divergence has emerged due to structural changes in movement.
And the macroeconomic challenge contributes to strengthening this literature. The dollar benefits from a perception of greater relative strength, since the dollar appears more vulnerable to the risk of legal indecision following the evolution of the global economic cycle. With the imminent macro shock, the transfer window tends to increase the value of continuity and consistency with the fundamental quadruple.
In this scenario, the operation on the sterlin does not arise from the inseguiment of the prezzo, but it does not respond to a favored balance point. For a typical technical assessment, I prioritize the quality of the contest and the speed of the session. The transfer window, with another volta, seems to move more to absorb the EU, allowing space for a possible future movement to complete the consolidation phase.
In fact, the four-component system suggests that the stereo should simply be taken into account. Once the structure remained intact and the flow of light did not signal a change in speed, the background narrative remained oriented towards the continuation of positive motion. Ed is the owner in search of a quick and easy way to find the most interesting opportunity.

EURUSD Bias & Patience Tuesday looking like a rich day
HTF bais: bearish
Monday delivered downside extension as expected.
Price is now retracing into our sell zone at 1.1853 – 1.1836.
Watching for bearish reaction from that area to continue the weekly move lower.
