USDJPY - Correction or Reload Before the Next Push?📈USDJPY remains structurally bullish on the higher time frame . The market respected the rising blue trendline, broke above the previous support zone, and shifted that zone into new demand.
🏹After the impulsive move higher , price is now going through a controlled correction, drifting back toward a key area of confluence:
the rising trendline + former support zone.
❗️This is exactly where trend traders pay attention . As long as price holds above this intersection, the plan is simple: look for trend-following long setups, aiming for continuation in the direction of the dominant trend.
A clean bullish reaction here keeps the structure intact. Only a decisive break below would put this bullish scenario into question.
Is this just a pause… or the fuel for the next leg higher? 🤔
⚠️ Disclaimer: This is not financial advice. Always do your own research and manage risk properly.
📚 Stick to your trading plan regarding entries, risk, and management.
Good luck! 🍀
All Strategies Are Good; If Managed Properly!
~Richard Nasr
USD

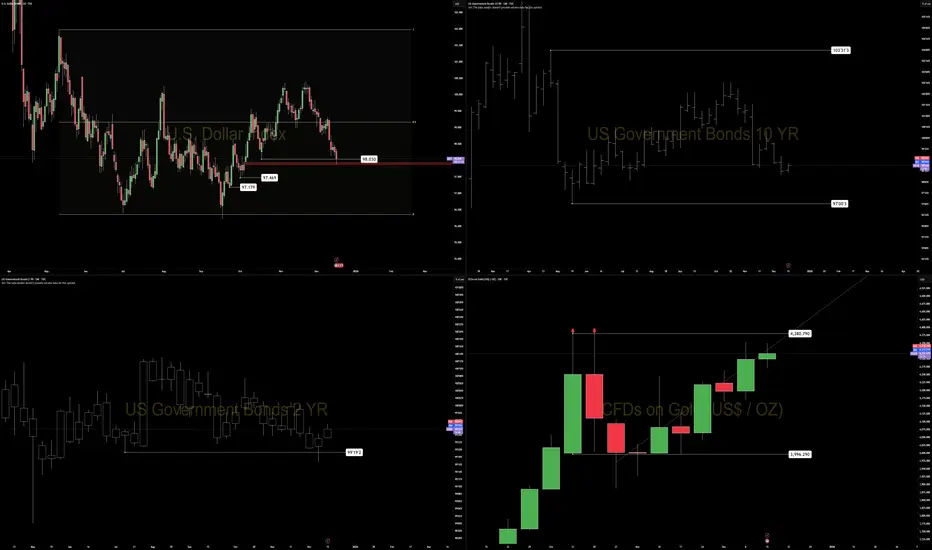
DXY — Daily Structure at a Decision PointThe dollar has completed a prior volume imbalance fill at 97.853 and is now trading against the lower boundary of the daily range.
Participation is low, consistent with late-December conditions. In this environment, daily closes matter more than intraday movement.
Key level: 98.030
This is the prior daily range low.
A daily close below 98.030 shifts the daily bias bearish
Without that close, downside pressure remains internal to the range
The move into imbalance without expansion suggests position resolution, not trend initiation. This is typical of year-end exposure reduction, rather than new macro positioning.
Cross-market context:
Gold is pressing into a double-high area without expansion.
Bonds are showing loss of momentum at the front end.
Risk assets remain supported but lack acceleration.
If structure breaks, the next natural downside references sit at 97.469 and 97.179.
Until a close confirms, this remains a confirmation environment, not a forecasting one.
AUDUSD Breakout Retest as Dollar Weakens!Hey Traders,
In today’s trading session, we are monitoring AUDUSD for a potential buying opportunity around the 0.66000 zone. The pair previously traded within a downtrend but has successfully broken out, signaling a shift in market structure.
Price is now in a healthy corrective phase, retracing toward the 0.66000 support zone, which aligns with prior resistance turned support — a classic breakout–retest setup.
Fundamental backdrop:
The US Dollar remains under pressure following softer macro conditions and fading expectations of sustained Fed hawkishness. Recent data continues to point toward a cooling US labor market, reinforcing a weaker USD environment and improving the risk-reward profile for AUDUSD on pullbacks.
Focus: Watching price behavior around 0.66000 for confirmation of bullish continuation.
Trade safe,
Joe

USDCAD at Critical Trend ResistanceHey Traders,
In tomorrow’s trading session, we are monitoring USDCAD for a potential selling opportunity around the 1.38000 zone.
Technical structure:
USDCAD remains in a clear downtrend and is currently in a corrective phase, with price retracing toward the 1.38000 area — a key zone of trend resistance and prior supply. This level represents a technically significant area where sellers may look to reassert control in line with the broader bearish structure.
What to watch:
Price behavior around 1.38000 will be critical. A clear rejection or loss of bullish momentum here could signal trend continuation to the downside.
Trade safe,
Joe

AUDUSD at Decision Point — Trend or Trap?Hey Traders,
In today’s trading session, we are monitoring AUDUSD for a potential buying opportunity around the 0.66200 zone.
Structure:
AUDUSD remains in a well-defined uptrend, and price is currently undergoing a healthy pullback toward the rising trend structure. The 0.66200 area stands out as a key zone of confluence, acting as both dynamic trend support and a prior reaction level.
Context:
As long as price holds above this level, the broader bullish structure remains intact, keeping the path open for a continuation toward recent highs.
Plan:
Watching for bullish reaction and confirmation around 0.66200 before considering continuation setups.
Trade safe,
Joe

USDJPY → Trade Analysis | SELL SetupYou can expect a reaction in the direction of selling from the specified resistance zone
USDJPY moving higher as it tests the strong resistance level..
We expect a bearish move from the confluence zone.
Hello Traders, here is the full analysis.
I think we can soon see more fall from this range! GOOD LUCK! Great SELL opportunity USDJPY
I still did my best and this is the most likely count for me at the moment.
-------------------
Traders, if you liked this idea or if you have your own opinion about it, write in the comments. I will be glad 🤝

EURUSD: A long Trade is possible here!Hello Traders,
The Trend is bullish however not so strong!
We had previously broken a level up!
The POC of Volume Profile is around strong levels!
There is a FVG and OB+ around the POC.
We see some weaknesses in candles recently. Though, they are not yet critical weakness of buyers!
So, we are ready to long it!
The TP I've gained through equal levels and historical strong bears around!
You can use this analysis for your intraday orders too!

EURGBP: Wait for Break!Hello Traders!
EURGBP could be highly affected by the GDP m/m news of the United Kingdom!
You use this analysis in two ways!
1st! taking Swing Trades.
2nd! Making intraday trads by using strategies like ORB and others.
Best Regards, Ali

EURUSD – 1-Hour Timeframe Tradertilki AnalysisMy friends, good morning,
I have prepared an EURUSD analysis for you on the 1-hour timeframe.
My friends, if EURUSD reaches the positive levels between 1.16418 and 1.16216, I will open a buy position and target the 1.17075 level.
Additionally, buy opportunities may also come from the 1.16604-1.16542 levels, but for me, the most suitable positive buy zone is between 1.16418 and 1.16216.
My friends, I share these analyses thanks to each like I receive from you. Your likes increase my motivation and encourage me to support you in this way.🙏✨
Thank you to all my friends who support me with their likes.❤️

USDJPY – Daily Compression at Key Demand: COT Divergence PointsFrom a COT perspective, the overall picture remains consistent with a phase of potential short-term structural weakening in the JPY, while at the same time showing signs of maturity in the USDJPY move. On JPY futures, Non-Commercial traders are still net long the yen (longs exceeding shorts), but the latest data highlights an increase in short positions alongside a reduction in longs, a typical distribution pattern following months of accumulation. At the same time, Non-Commercials on the Dollar Index remain heavily net short, suggesting that USD strength is increasingly fragile and driven more by tactical flows than by strong long-term conviction. This COT divergence historically tends to favor corrective moves on USDJPY rather than impulsive upside extensions.
On the daily chart, the technical structure is well defined: after the strong bullish impulse in November, price is developing a consolidation flag / descending channel, characterized by lower highs and compression toward a clearly defined daily demand zone between 154.00 and 154.50. This area has already been defended multiple times and aligns with a volume equilibrium zone. A clean break below this demand would open room toward the lower demand area around 152.00–152.50, while as long as price holds above the base of the channel, the bias remains corrective rather than structurally bearish. From a technical standpoint, the higher-probability scenario is a reaction from the demand zone with an attempt to break the upper trendline, rather than an immediate downside acceleration.
USDJPY seasonality in December has been historically positive to neutral-bullish over the past 10–20 years, with a tendency for recoveries in the second half of the month following early weakness. This supports the case for a technical rebound rather than a direct bearish continuation. Retail sentiment is almost perfectly balanced (51% long / 49% short), providing no extreme contrarian signal and reinforcing the idea of a market in a waiting and building phase, consistent with the current daily range and compression.
Overall, the operational bias remains neutral-to-bullish on weakness. The 154.00–154.50 area is a key reaction zone where a change in structure could justify tactical long exposure, with invalidation below daily demand. Only a decisive break and acceptance below 154 would shift the outlook toward a bearish continuation targeting 152, while a break of the descending trendline would confirm the resumption of the medium-term bullish trend toward 157.50–158.00.

ETHUSD H4 | Potential Bearish DropMomentum: Bearish
Price may retrace toward the sell entry, which has been identified as an overlap resistance level. This confluence adds significant strength to the zone.
Sell Entry: 3,079.09
Overlap resistance
Stop Loss: 3,293.66
Pullback resistance
Take Profit: 2,668.23
Swing-low support
High Risk Investment Warning
Stratos Markets Limited (tradu.com ), Stratos Europe Ltd (tradu.com ):
CFDs are complex instruments and come with a high risk of losing money rapidly due to leverage. 70% of retail investor accounts lose money when trading CFDs with this provider. You should consider whether you understand how CFDs work and whether you can afford to take the high risk of losing your money.
Stratos Global LLC (tradu.com ): Losses can exceed deposits.
Please be advised that the information presented on TradingView is provided to Tradu (‘Company’, ‘we’) by a third-party provider (‘TFA Global Pte Ltd’). Please be reminded that you are solely responsible for the trading decisions on your account. Any information and/or content is intended entirely for research, educational and informational purposes only and does not constitute investment or consultation advice or investment strategy. The information is not tailored to the investment needs of any specific person and therefore does not involve a consideration of any of the investment objectives, financial situation or needs of any viewer that may receive it. Past performance is not a reliable indicator of future results. Actual results may differ materially from those anticipated in forward-looking or past performance statements. We assume no liability as to the accuracy or completeness of any of the information and/or content provided herein and the Company cannot be held responsible for any omission, mistake nor for any loss or damage including without limitation to any loss of profit which may arise from reliance on any information supplied by TFA Global Pte Ltd.

LTCUSD H4 | Bearish ContinuationMomentum: Bearish
Price may retrace to the sell entry, which aligns with the 38.2% Fibonacci retracement, adding significant strength to this level.
Sell Entry: 79.61
Pullback resistance
38.2% Fibonacci retracement
Stop Loss: 86.49
Pullback resistance
Take Profit: 71.03
Pullback support
High Risk Investment Warning
Stratos Markets Limited (tradu.com ), Stratos Europe Ltd (tradu.com ):
CFDs are complex instruments and come with a high risk of losing money rapidly due to leverage. 70% of retail investor accounts lose money when trading CFDs with this provider. You should consider whether you understand how CFDs work and whether you can afford to take the high risk of losing your money.
Stratos Global LLC (tradu.com ): Losses can exceed deposits.
Please be advised that the information presented on TradingView is provided to Tradu (‘Company’, ‘we’) by a third-party provider (‘TFA Global Pte Ltd’). Please be reminded that you are solely responsible for the trading decisions on your account. Any information and/or content is intended entirely for research, educational and informational purposes only and does not constitute investment or consultation advice or investment strategy. The information is not tailored to the investment needs of any specific person and therefore does not involve a consideration of any of the investment objectives, financial situation or needs of any viewer that may receive it. Past performance is not a reliable indicator of future results. Actual results may differ materially from those anticipated in forward-looking or past performance statements. We assume no liability as to the accuracy or completeness of any of the information and/or content provided herein and the Company cannot be held responsible for any omission, mistake nor for any loss or damage including without limitation to any loss of profit which may arise from reliance on any information supplied by TFA Global Pte Ltd.

AUDUSD - Future OutlookHistorical Retrospective:
Feb 2012 - mid-Mar 2020: clear technical five-wave impulsive move down.
Mid-Mar 2020 - Feb 2021: wave A , a corrective impulsive move.
Feb 2021 - present: wave B , a three-wave correction.
Expectation:
Wave C - a five-wave corrective impulse upward.
Targets:
From the current level (wave C underway): 0.84
From the end of the impulsive move: 0.80
Summary:
We are close to a reversal or have already completed it, with a strong upward move expected next.
---
Please subscribe and leave a comment.
You’ll get new information faster than anyone else.
---

Falling towards key support?USD/JPY is falling towards the pivot, which is an overlap support, and could bounce to the 1st resistance.
Pivot: 154.43
1st Support: 153.51
1st Resistance: 156.06
Disclaimer:
The opinions given above constitute general market commentary and do not constitute the opinion or advice of IC Markets or any form of personal or investment advice.
Any opinions, news, research, analyses, prices, other information, or links to third-party sites contained on this website are provided on an "as-is" basis, are intended to be informative only, and are not advice, a recommendation, research, a record of our trading prices, an offer of, or solicitation for, a transaction in any financial instrument and thus should not be treated as such. The information provided does not involve any specific investment objectives, financial situation, or needs of any specific person who may receive it. Please be aware that past performance is not a reliable indicator of future performance and/or results. Past performance or forward-looking scenarios based upon the reasonable beliefs of the third-party provider are not a guarantee of future performance. Actual results may differ materially from those anticipated in forward-looking or past performance statements. IC Markets makes no representation or warranty and assumes no liability as to the accuracy or completeness of the information provided, nor any loss arising from any investment based on a recommendation, forecast, or any information supplied by any third party

Overlap resistance ahead?Swissie (USD/CHF) is rising towards the pivot, which has been identified as an overlap resistance and could reverse to the 1st support which is a multi swing low support.
Pivot: 0.7992
1st Support: 0.7891
1st Resistance: 0.8024
Disclaimer:
The opinions given above constitute general market commentary and do not constitute the opinion or advice of IC Markets or any form of personal or investment advice.
Any opinions, news, research, analyses, prices, other information, or links to third-party sites contained on this website are provided on an "as-is" basis, are intended to be informative only, and are not advice, a recommendation, research, a record of our trading prices, an offer of, or solicitation for, a transaction in any financial instrument and thus should not be treated as such. The information provided does not involve any specific investment objectives, financial situation, or needs of any specific person who may receive it. Please be aware that past performance is not a reliable indicator of future performance and/or results. Past performance or forward-looking scenarios based upon the reasonable beliefs of the third-party provider are not a guarantee of future performance. Actual results may differ materially from those anticipated in forward-looking or past performance statements. IC Markets makes no representation or warranty and assumes no liability as to the accuracy or completeness of the information provided, nor any loss arising from any investment based on a recommendation, forecast, or any information supplied by any third party

Bullilsh bounce off 38.2% Fibonacci support?NZD/USD is falling towards the pivot which aligns with the 38.2% Fibonacci retracement and could bounce to the 1st resistance.
Pivot: 0.5729
1st Support: 0.5687
1st Resistance: 0.5796
Disclaimer:
The opinions given above constitute general market commentary and do not constitute the opinion or advice of IC Markets or any form of personal or investment advice.
Any opinions, news, research, analyses, prices, other information, or links to third-party sites contained on this website are provided on an "as-is" basis, are intended to be informative only, and are not advice, a recommendation, research, a record of our trading prices, an offer of, or solicitation for, a transaction in any financial instrument and thus should not be treated as such. The information provided does not involve any specific investment objectives, financial situation, or needs of any specific person who may receive it. Please be aware that past performance is not a reliable indicator of future performance and/or results. Past performance or forward-looking scenarios based upon the reasonable beliefs of the third-party provider are not a guarantee of future performance. Actual results may differ materially from those anticipated in forward-looking or past performance statements. IC Markets makes no representation or warranty and assumes no liability as to the accuracy or completeness of the information provided, nor any loss arising from any investment based on a recommendation, forecast, or any information supplied by any third party

Falling towards pullback support?Aussie (AUD/USD) is falling towards the pivot, which has been identified as a pullback support and could bounce to the 1st resistance.
Pivot: 0.6573
1st Support: 0.6516
1st Resistance: 0.6647
Disclaimer:
The opinions given above constitute general market commentary and do not constitute the opinion or advice of IC Markets or any form of personal or investment advice.
Any opinions, news, research, analyses, prices, other information, or links to third-party sites contained on this website are provided on an "as-is" basis, are intended to be informative only, and are not advice, a recommendation, research, a record of our trading prices, an offer of, or solicitation for, a transaction in any financial instrument and thus should not be treated as such. The information provided does not involve any specific investment objectives, financial situation, or needs of any specific person who may receive it. Please be aware that past performance is not a reliable indicator of future performance and/or results. Past performance or forward-looking scenarios based upon the reasonable beliefs of the third-party provider are not a guarantee of future performance. Actual results may differ materially from those anticipated in forward-looking or past performance statements. IC Markets makes no representation or warranty and assumes no liability as to the accuracy or completeness of the information provided, nor any loss arising from any investment based on a recommendation, forecast, or any information supplied by any third party

Bearish reversal for the Cable?The price has rejected off the pivot, which is a pullback resistance, and could drop to the 1st support, which acts as a pullback support.
Pivot: 1.3408
1st Support: 1.3271
1st Resistance: 1.3497
Disclaimer:
The opinions given above constitute general market commentary and do not constitute the opinion or advice of IC Markets or any form of personal or investment advice.
Any opinions, news, research, analyses, prices, other information, or links to third-party sites contained on this website are provided on an "as-is" basis, are intended to be informative only, and are not advice, a recommendation, research, a record of our trading prices, an offer of, or solicitation for, a transaction in any financial instrument and thus should not be treated as such. The information provided does not involve any specific investment objectives, financial situation, or needs of any specific person who may receive it. Please be aware that past performance is not a reliable indicator of future performance and/or results. Past performance or forward-looking scenarios based upon the reasonable beliefs of the third-party provider are not a guarantee of future performance. Actual results may differ materially from those anticipated in forward-looking or past performance statements. IC Markets makes no representation or warranty and assumes no liability as to the accuracy or completeness of the information provided, nor any loss arising from any investment based on a recommendation, forecast, or any information supplied by any third party

Could we see a reversal from here?Fiber (EUR/USD) is reacting off the pivot and could reverse to the 1st support, which is a pullback support.
Pivot: 1.1767
1st Support: 1.1670
1st Resistance: 1.1815
Disclaimer:
The opinions given above constitute general market commentary and do not constitute the opinion or advice of IC Markets or any form of personal or investment advice.
Any opinions, news, research, analyses, prices, other information, or links to third-party sites contained on this website are provided on an "as-is" basis, are intended to be informative only, and are not advice, a recommendation, research, a record of our trading prices, an offer of, or solicitation for, a transaction in any financial instrument and thus should not be treated as such. The information provided does not involve any specific investment objectives, financial situation, or needs of any specific person who may receive it. Please be aware that past performance is not a reliable indicator of future performance and/or results. Past performance or forward-looking scenarios based upon the reasonable beliefs of the third-party provider are not a guarantee of future performance. Actual results may differ materially from those anticipated in forward-looking or past performance statements. IC Markets makes no representation or warranty and assumes no liability as to the accuracy or completeness of the information provided, nor any loss arising from any investment based on a recommendation, forecast, or any information supplied by any third party

NZDUSD to find buyers at previous support?NZDUSD - 24h expiry
There is no clear indication that the upward move is coming to an end.
Although we remain bullish overall, a correction is possible with plenty of room to move lower without impacting the trend higher.
Risk/Reward would be poor to call a buy from current levels.
A move through 0.5800 will confirm the bullish momentum.
The measured move target is 0.5850.
We look to Buy at 0.5760 (stop at 0.5725)
Our profit targets will be 0.5835 and 0.5850
Resistance: 0.5800 / 0.5825 / 0.5850
Support: 0.5775 / 0.5760 / 0.5725
Risk Disclaimer
The trade ideas beyond this page are for informational purposes only and do not constitute investment advice or a solicitation to trade. This information is provided by Signal Centre, a third-party unaffiliated with OANDA, and is intended for general circulation only. OANDA does not guarantee the accuracy of this information and assumes no responsibilities for the information provided by the third party. The information does not take into account the specific investment objectives, financial situation, or particular needs of any particular person. You should take into account your specific investment objectives, financial situation, and particular needs before making a commitment to trade, including seeking, under a separate engagement, as you deem fit.
You accept that you assume all risks in independently viewing the contents and selecting a chosen strategy.
Where the research is distributed in Singapore to a person who is not an Accredited Investor, Expert Investor or an Institutional Investor, Oanda Asia Pacific Pte Ltd (“OAP“) accepts legal responsibility for the contents of the report to such persons only to the extent required by law. Singapore customers should contact OAP at 6579 8289 for matters arising from, or in connection with, the information/research distributed.

EUR/USD Re-Tests Fibonacci Resistance into Heavy USD RiskEUR/USD bulls have an open door to run but perhaps the more entertaining scenario is what happens if they don't.
Last week saw the pair break out to fresh monthly highs after the FOMC rate decision and much of the drive seemed to show after Powell had a phrase in the press conference pertaining to labor market conditions, when he said he thought the US was losing 20k jobs per month. While the Fed's dot plot matrix wasn't as dovish as what rates markets were looking for, that phrase shows a Federal Reserve that's concerned about employment, and that can push on the other side of the dual mandate provided that inflation doesn't shoot higher. We'll get data on both fronts later this week, and this highlights the setup in EUR/USD as the pair tests a major area of resistance.
I highlighted this resistance as we came into the second-half of the year, and it spans from a Fibonacci retracement that's had a number of important inflections over the past two years and change. Produced by the 2021-2022 major move, the 61.8% caught the high in 2023 and the 38.2 and 50% marks defined a range for the bulk of last year. Earlier in 2025, the 23.6% retracement is what ultimately caught the yearly low and as we came into Q3, it was the 76.4 and 78.6% retracements that were holding resistance.
Almost six months later, bulls haven't been able to do much above that very key spot on the chart, although shorter-term we can see buyers trying to make their mark. This puts a lot of emphasis on the upcoming data out of the US as that will push into year-end themes.
In Q4, it was the 1.1500 handle that ultimately stymied sellers and if we do see failure from bulls to break through, that remains a major spot for EUR/USD bears in early 2026 trade. As I wrote in these posts previously, that's a tough nut to crack for EUR/USD and can often take weeks or months for trends to ultimately chew through. So, bulls have an open door here and if they fail to walk through it, that's the next scenario to entertain. - js

USDCHF - Same Structure, Different Plays!!🏹USDCHF has been respecting its rising wedge structure beautifully.
📈We initially bought near the lower bound of the wedge, where buyers stepped in with clear support. 📉Later on, we sold near the upper bound, capitalizing on exhaustion at resistance. Classic structure-based trading.
⚔️Now price is rotating back toward the lower bound of the rising wedge, which aligns perfectly with a well-defined support zone. This intersection is where we’ll be looking for fresh trend-following long setups, as long as price shows acceptance and bullish reaction from this area.
🏹As long as the lower wedge support holds, the bias remains for another rotation higher within the structure. A clean break below would invalidate this bullish scenario and shift the narrative.
Same chart. Same structure. Different opportunities. 🤔
Are buyers ready to defend it again?
⚠️ Disclaimer: This is not financial advice. Always do your own research and manage risk properly.
📚 Stick to your trading plan regarding entries, risk, and management.
Good luck! 🍀
All Strategies Are Good; If Managed Properly!
~Richard Nasr

USDCAD reached a key daily demand zone (61.8% Fib)Expanded analysis (for the idea details)
Context & setup
Price has dropped sharply into a well-defined daily demand/congestion zone (≈ 1.3765–1.3714) and is currently testing the lower boundary. This area lines up with a key 61.8% retracement cluster and a multi-timeframe support region — a clear confluence of supply/demand and Fibonacci support.
Why this matters
The move into the zone is a strong liquidation leg; the first reaction here will tell us whether buyers are stepping in.
If price shows a clean bullish rejection (wicks, close back above the zone, or a bullish engulf), the probability of a corrective swing higher increases.
The 200/100-type moving averages and higher-timeframe structure act as resistance above, making this a high-reward countertrend/swing setup if buyers defend the zone.
Trade idea (example, for discussion — not trading advice)
Entry: buy area 1.376 – 1.379 after a confirmed bullish price action signal.
Stop loss: below 1.366 (monthly lower invalidation level).
Take profits: partial at 1.4026 (short-term swing target / area of interest), final at 1.4128 (monthly 61.8 / higher resistance).
Invalidation: clear daily close below 1.366 would invalidate the long idea and favors continuation lower.
Risk management & notes
Use position sizing so that the stop equals an acceptable percentage of your account. Aim for positive R:R (this plan targets ~2–4R depending on exact entry).
Watch for news and liquidity events — large catalysts can blow through technical zones.
Wait for a clean price-action confirmation before committing full size.
Summary
This is a classic demand-zone vs. fib confluence trade: if buyers defend 1.3765–1.3714, expect a corrective rally toward 1.402–1.413. If the zone breaks decisively, look for continuation toward 1.366 and below.
Not financial advice. Trade your plan and respect risk.
OANDA:USDCAD FX:USDCAD FOREXCOM:USDCAD BMFBOVESPA:CAD1! TFEX:USD1!
