Swing high resistance ahead?EUR/USD is rising towards the resistance level which is a swing high resistance and could reverse from this level and drop to our take profit.
Entry: 1.1649
Why we like it:
There is a swing high resistance that aligns with the 100$ Fibonacci projection.
Stop loss: 1.1699
Why we like it:
There is a resistance level at the 127.2% Fibonacci extension.
Take profit: 1.1554
Why we like it:
There is a pullback support level.
Enjoying your TradingView experience? Review us!
Please be advised that the information presented on TradingView is provided to Vantage (‘Vantage Global Limited’, ‘we’) by a third-party provider (‘Everest Fortune Group’). Please be reminded that you are solely responsible for the trading decisions on your account. There is a very high degree of risk involved in trading. Any information and/or content is intended entirely for research, educational and informational purposes only and does not constitute investment or consultation advice or investment strategy. The information is not tailored to the investment needs of any specific person and therefore does not involve a consideration of any of the investment objectives, financial situation or needs of any viewer that may receive it. Kindly also note that past performance is not a reliable indicator of future results. Actual results may differ materially from those anticipated in forward-looking or past performance statements. We assume no liability as to the accuracy or completeness of any of the information and/or content provided herein and the Company cannot be held responsible for any omission, mistake nor for any loss or damage including without limitation to any loss of profit which may arise from reliance on any information supplied by Everest Fortune Group.
USD

GBP/USD — Bearish Outlook Toward 1.26867GBP/USD remains under sustained bearish pressure after failing to hold above the key structural levels at 1.34825 and 1.33906. These two resistance zones now define the upper boundary of the broader downtrend, confirming that sellers remain in control.
Price is currently moving within a corrective phase, and any recovery attempt below these key levels is expected to face renewed selling interest. The bearish continuation scenario remains valid as long as the pair stays capped below 1.33906.
The next major objective for bears is the downside target at 1.26867, corresponding to the 1.0 Fibonacci extension and the final completion zone of the current corrective wave.
A break below intermediate supports—1.31642, 1.30846, and 1.29907—will accelerate momentum toward the target.
Key Levels
Major Resistance: 1.34825
Secondary Resistance: 1.33906
Intermediate Supports: 1.31642 • 1.30846 (50%) • 1.29907 (0.618)
Final Downside Target: 1.26867

USDCAD starting a massive 2-year rally.The USDCAD pair has been trading within a Channel Up since the May 31 2021 market bottom. In recent weeks it broke above its 1W MA50 (blue trend-line) following a June 16 2025 Higher Low, just above the 1W MA200 (orange trend-line), which has been holding as the natural Support since September 2022.
Given the potential peak on the 1W CCI and the similarities with the previous Higher Low bottom formations, we expect the pair to start the new long-term Bullish Leg. With the previous two Bullish Legs rising by at least +13.00%, we anticipate the price to reach 1.53000 within 2 years time.
---
** Please LIKE 👍, FOLLOW ✅, SHARE 🙌 and COMMENT ✍ if you enjoy this idea! Also share your ideas and charts in the comments section below! This is best way to keep it relevant, support us, keep the content here free and allow the idea to reach as many people as possible. **
---
💸💸💸💸💸💸
👇 👇 👇 👇 👇 👇

EURUSD: Bearish Channel Continuation SetupHi guys!
The EURUSD pair continues to trade within a well-defined descending channel. This confirms that the broader market structure remains bearish.
Important Levels
Resistance Zone: 1.1535 – 1.1550
Resistance Line: Aligns with the top of the highlighted resistance zone and channel structure.
Support Zone: Around 1.1517
Market Context
Recently, the pair formed a bearish flag or pennant pattern following a sharp downward move, suggesting that sellers remain in control. The price has since retested the resistance zone, where bearish pressure is expected to re-emerge.
Trading Outlook
Bearish Scenario (Primary Bias):
If the price fails to break above 1.1578, the bias remains bearish. A rejection from this zone could trigger a continuation move toward 1.1517 and potentially extend lower along the channel’s bottom boundary.
Bullish Scenario (Alternative):
A clear breakout and close above the resistance zone and channel midpoint would invalidate the short-term bearish setup. I
Disclaimer: As part of ThinkMarkets’ Influencer Program, I am sponsored to share and publish their charts in my analysis.

EURUSD: double Scenario
Hello Traders,
this is the long-term channel!
We are truly in the way of more bearish days!
However, in the more natural timeframe we see a possible Head and shoulders!
I'm not a pattern trader! but sellers were not able to goes further than the HEAD!
So???
They are not strong enough! new buyers are in! may be a peace in Ukraine could alter it!
but I'm still more bearish for the term of my trade length! Although I aim to long after confirming the H&S and also breaking the latest strong level and breaking the bearish channel up!!

Market Hunter’s AUDUSD Roadmap: Patiently Awaited Buy LevelsMy friends, greetings
I have prepared an AUDUSD analysis for you.📊
If AUDUSD falls to the 0.64528 – 0.64363 levels, I will open a BUY position there.
Once AUDUSD reaches my BUY entry point, I will share the targets with you here.⚡
You will be informed when I update this analysis.🔔
My friends, I share these analyses thanks to every single like I receive from you.
Your likes increase my motivation and make me want to support you in this way.🙏
I sincerely thank all my friends who support me with their likes.❤️

Bearish momentum to conninue?Bitcoin (BTC/USD) has rejected off the pivot which acts as a pullback resistance and could drop to the pullback support.
Pivot: 89,628.69
1st Support: 81,683.82
1st Resistance: 93,927.62
Disclaimer:
The opinions given above constitute general market commentary and do not constitute the opinion or advice of IC Markets or any form of personal or investment advice.
Any opinions, news, research, analyses, prices, other information, or links to third-party sites contained on this website are provided on an "as-is" basis, are intended to be informative only, and are not advice, a recommendation, research, a record of our trading prices, an offer of, or solicitation for, a transaction in any financial instrument and thus should not be treated as such. The information provided does not involve any specific investment objectives, financial situation, or needs of any specific person who may receive it. Please be aware that past performance is not a reliable indicator of future performance and/or results. Past performance or forward-looking scenarios based upon the reasonable beliefs of the third-party provider are not a guarantee of future performance. Actual results may differ materially from those anticipated in forward-looking or past performance statements. IC Markets makes no representation or warranty and assumes no liability as to the accuracy or completeness of the information provided, nor any loss arising from any investment based on a recommendation, forecast, or any information supplied by any third party.

Bullish bounce off?Ethereum (ETH/USD) has bounced off the pivot, which has been identified as an overlap support, and could rise to the pullback resistance.
Pivot: 2,868.29
1st Support: 2,781.04
1st Resistance: 3,049.57
Disclaimer:
The opinions given above constitute general market commentary and do not constitute the opinion or advice of IC Markets or any form of personal or investment advice.
Any opinions, news, research, analyses, prices, other information, or links to third-party sites contained on this website are provided on an "as-is" basis, are intended to be informative only, and are not advice, a recommendation, research, a record of our trading prices, an offer of, or solicitation for, a transaction in any financial instrument and thus should not be treated as such. The information provided does not involve any specific investment objectives, financial situation, or needs of any specific person who may receive it. Please be aware that past performance is not a reliable indicator of future performance and/or results. Past performance or forward-looking scenarios based upon the reasonable beliefs of the third-party provider are not a guarantee of future performance. Actual results may differ materially from those anticipated in forward-looking or past performance statements. IC Markets makes no representation or warranty and assumes no liability as to the accuracy or completeness of the information provided, nor any loss arising from any investment based on a recommendation, forecast, or any information supplied by any third party.

GBPUSD H1 | Bearish Reversal Off Key Resistance?Momentum: Bearish
The price is rising towards the sell entry that aligns with the 50% Fibonacci retracement.
Sell entry: 1.3115
Strong overlap resistance
50% Fibonacci retracement
Stop loss: 1.3138
Pullback resistance
61.8% Fibonacci retracement
Take profit: 1.3063
Pullback support
High Risk Investment Warning
Stratos Markets Limited (tradu.com ), Stratos Europe Ltd (tradu.com ):
CFDs are complex instruments and come with a high risk of losing money rapidly due to leverage. 70% of retail investor accounts lose money when trading CFDs with this provider. You should consider whether you understand how CFDs work and whether you can afford to take the high risk of losing your money.
Stratos Global LLC (tradu.com ): Losses can exceed deposits.
Please be advised that the information presented on TradingView is provided to Tradu (‘Company’, ‘we’) by a third-party provider (‘TFA Global Pte Ltd’). Please be reminded that you are solely responsible for the trading decisions on your account. Any information and/or content is intended entirely for research, educational and informational purposes only and does not constitute investment or consultation advice or investment strategy. The information is not tailored to the investment needs of any specific person and therefore does not involve a consideration of any of the investment objectives, financial situation or needs of any viewer that may receive it. Past performance is not a reliable indicator of future results. Actual results may differ materially from those anticipated in forward-looking or past performance statements. We assume no liability as to the accuracy or completeness of any of the information and/or content provided herein and the Company cannot be held responsible for any omission, mistake nor for any loss or damage including without limitation to any loss of profit which may arise from reliance on any information supplied by TFA Global Pte Ltd.

EURUSD H4 | Bearish Drop OffMomentum: Bearish
The price has rejected off the sell entry, which is also positioned below the Ichimoku Cloud.
Sell Entry: 1.1542
Pullback resistance
Slightly below the 38.2% Fibonacci retracement
Stop Loss: 1.1569
Pullback resistance
Near the 50% Fibonacci retracement
Take Profit: 1.1472
Swing-low support
Slightly above the 161.8% Fibonacci extension
High Risk Investment Warning
Stratos Markets Limited (tradu.com ), Stratos Europe Ltd (tradu.com ):
CFDs are complex instruments and come with a high risk of losing money rapidly due to leverage. 70% of retail investor accounts lose money when trading CFDs with this provider. You should consider whether you understand how CFDs work and whether you can afford to take the high risk of losing your money.
Stratos Global LLC (tradu.com ): Losses can exceed deposits.
Please be advised that the information presented on TradingView is provided to Tradu (‘Company’, ‘we’) by a third-party provider (‘TFA Global Pte Ltd’). Please be reminded that you are solely responsible for the trading decisions on your account. Any information and/or content is intended entirely for research, educational and informational purposes only and does not constitute investment or consultation advice or investment strategy. The information is not tailored to the investment needs of any specific person and therefore does not involve a consideration of any of the investment objectives, financial situation or needs of any viewer that may receive it. Past performance is not a reliable indicator of future results. Actual results may differ materially from those anticipated in forward-looking or past performance statements. We assume no liability as to the accuracy or completeness of any of the information and/or content provided herein and the Company cannot be held responsible for any omission, mistake nor for any loss or damage including without limitation to any loss of profit which may arise from reliance on any information supplied by TFA Global Pte Ltd.

AUDUSD H4 | Bearish Reversal Off 38.2% Fibonacci ResistanceMomentum: Bearish
Price is retracing upward toward the sell entry, which sits at a pullback resistance level that aligns well with the 38.2% Fibonacci retracement.
Sell Entry: 0.6475
Pullback resistance
38.2% Fibonacci retracement
Stop Loss: 0.6516
Overlap resistance
61.8% Fibonacci retracement
Take Profit: 0.6389
Swing low support
61.8% Fibonacci extension
High Risk Investment Warning
Stratos Markets Limited (tradu.com ), Stratos Europe Ltd (tradu.com ):
CFDs are complex instruments and come with a high risk of losing money rapidly due to leverage. 70% of retail investor accounts lose money when trading CFDs with this provider. You should consider whether you understand how CFDs work and whether you can afford to take the high risk of losing your money.
Stratos Global LLC (tradu.com ): Losses can exceed deposits.
Please be advised that the information presented on TradingView is provided to Tradu (‘Company’, ‘we’) by a third-party provider (‘TFA Global Pte Ltd’). Please be reminded that you are solely responsible for the trading decisions on your account. Any information and/or content is intended entirely for research, educational and informational purposes only and does not constitute investment or consultation advice or investment strategy. The information is not tailored to the investment needs of any specific person and therefore does not involve a consideration of any of the investment objectives, financial situation or needs of any viewer that may receive it. Past performance is not a reliable indicator of future results. Actual results may differ materially from those anticipated in forward-looking or past performance statements. We assume no liability as to the accuracy or completeness of any of the information and/or content provided herein and the Company cannot be held responsible for any omission, mistake nor for any loss or damage including without limitation to any loss of profit which may arise from reliance on any information supplied by TFA Global Pte Ltd.

ETHUSD H4 | Bullish ReversalMomentum: Bearish
The price is falling towards the buy entry, which aligns with the 38.2% Fibonacci retracement.
Buy entry: 2,872.04
Pullback support
38.2% Fibonacci retracement
Stop loss: 2,635.89
Pullback support
Take profit: 3,201.19
Overlap resistance
Slightly above the 50% Fibonacci retracement
High Risk Investment Warning
Stratos Markets Limited (tradu.com ), Stratos Europe Ltd (tradu.com ):
CFDs are complex instruments and come with a high risk of losing money rapidly due to leverage. 70% of retail investor accounts lose money when trading CFDs with this provider. You should consider whether you understand how CFDs work and whether you can afford to take the high risk of losing your money.
Stratos Global LLC (tradu.com ): Losses can exceed deposits.
Please be advised that the information presented on TradingView is provided to Tradu (‘Company’, ‘we’) by a third-party provider (‘TFA Global Pte Ltd’). Please be reminded that you are solely responsible for the trading decisions on your account. Any information and/or content is intended entirely for research, educational and informational purposes only and does not constitute investment or consultation advice or investment strategy. The information is not tailored to the investment needs of any specific person and therefore does not involve a consideration of any of the investment objectives, financial situation or needs of any viewer that may receive it. Past performance is not a reliable indicator of future results. Actual results may differ materially from those anticipated in forward-looking or past performance statements. We assume no liability as to the accuracy or completeness of any of the information and/or content provided herein and the Company cannot be held responsible for any omission, mistake nor for any loss or damage including without limitation to any loss of profit which may arise from reliance on any information supplied by TFA Global Pte Ltd.

XAGUSD H4 | Bullish RiseMomentum: Bullish
The price has reacted off the buy entry, which is a pullback support.
Buy entry: 50.84
Pullback support
Stop loss: 49.39
Pullback support
Take profit: 54.09
SWing high resistance
145% Fibonacci extension
High Risk Investment Warning
Stratos Markets Limited (tradu.com ), Stratos Europe Ltd (tradu.com ):
CFDs are complex instruments and come with a high risk of losing money rapidly due to leverage. 70% of retail investor accounts lose money when trading CFDs with this provider. You should consider whether you understand how CFDs work and whether you can afford to take the high risk of losing your money.
Stratos Global LLC (tradu.com ): Losses can exceed deposits.
Please be advised that the information presented on TradingView is provided to Tradu (‘Company’, ‘we’) by a third-party provider (‘TFA Global Pte Ltd’). Please be reminded that you are solely responsible for the trading decisions on your account. Any information and/or content is intended entirely for research, educational and informational purposes only and does not constitute investment or consultation advice or investment strategy. The information is not tailored to the investment needs of any specific person and therefore does not involve a consideration of any of the investment objectives, financial situation or needs of any viewer that may receive it. Past performance is not a reliable indicator of future results. Actual results may differ materially from those anticipated in forward-looking or past performance statements. We assume no liability as to the accuracy or completeness of any of the information and/or content provided herein and the Company cannot be held responsible for any omission, mistake nor for any loss or damage including without limitation to any loss of profit which may arise from reliance on any information supplied by TFA Global Pte Ltd.

Bullish bounce off 61.8% Fibonacci support?USD/ZAR is falling towards the pivot which acts as a pullback support that aligns with the 61.8% Fibonacci retracement and could bounce to the 1st resistance.
Pivot: 17.14336
1st Support: 17.06139
1st Resistance: 17.28160
Disclaimer:
The opinions given above constitute general market commentary and do not constitute the opinion or advice of IC Markets or any form of personal or investment advice.
Any opinions, news, research, analyses, prices, other information, or links to third-party sites contained on this website are provided on an "as-is" basis, are intended to be informative only, and are not advice, a recommendation, research, a record of our trading prices, an offer of, or solicitation for, a transaction in any financial instrument and thus should not be treated as such. The information provided does not involve any specific investment objectives, financial situation, or needs of any specific person who may receive it. Please be aware that past performance is not a reliable indicator of future performance and/or results. Past performance or forward-looking scenarios based upon the reasonable beliefs of the third-party provider are not a guarantee of future performance. Actual results may differ materially from those anticipated in forward-looking or past performance statements. IC Markets makes no representation or warranty and assumes no liability as to the accuracy or completeness of the information provided, nor any loss arising from any investment based on a recommendation, forecast, or any information supplied by any third party.

Bitcoin 2026History doesn’t repeat like a record player — but it rhymes.
By tracking patterns critically (not fatalistically), we can:
1. Spot early warnings of past mistakes.
2. Identify where old models fail or not.
3. Make more informed choices about the future.
I'll make 12 updates ahead and we will find out how this patterns works in case of btc/usd.
Key Questions to Test Over 12 Months
Do halving cycles still drive price action, or has the market “priced it in”?
Does BTC is still just a “risk tech” (correlated with Nasdaq)?
Core Metrics to Track Monthly
a) Price & Volatility
BTC/USD closing price (monthly average).
30‑day volatility (standard deviation of daily returns).
Compare to past cycles (2013, 2017, 2021 peaks/bottoms).
b) On‑Chain Activity
Active addresses (network usage).
Exchange inflows/outflows (signaling accumulation vs. selling).
Hash rate (miner confidence).
c) Macroeconomic Context
U.S. inflation rate and Fed policy (interest rates, QT/QE).
Global liquidity conditions (M2 money supply, T‑bill yields).
Risk‑on/risk‑off sentiment (S&P 500, gold, USD index).
d) Regulatory & Adoption Shifts
New crypto regulations (U.S., EU, Asia).
Institutional adoption (spot ETF flows, corporate treasury allocations).
Tech updates (Bitcoin protocol changes, Lightning Network growth).
Meanwhile we will focus on charts.
The information and publications are not meant to be, and do not constitute, financial, investment, trading, or other types of advice or recommendations.

GBPUSD Breakout and Potential RetraceHey Traders, in today's trading session we are monitoring GBPUSD for a buying opportunity around 1.30900 zone, GBPUSD was trading in a downtrend and successfully managed to break it out. Currently is in a correction phase in which it is approaching the retrace area at 1.30900 support and resistance area.
Trade safe, Joe.

USD/JPY – Bearish Flag Breakdown (25.11.2025)📝 Description 📌 Setup Overview FX:USDJPY
USD/JPY has completed a Bearish Flag on the M30 timeframe and price has now broken below the flag support with momentum.
The Ichimoku Cloud is acting as resistance, showing sellers stepping in again after a short pullback.
📉 Bias: Bearish continuation📍 Pattern: Bear Flag (Breakout confirmed)
🎯 Trading Plan
• Entry idea: After a clean breakout & retest confirmation below the flag base zone
• TP1: 156.055 (1st Support)
• TP2: 155.622 (2nd Support)
• SL suggestion: Above 157.000 (invalidates breakdown)
• RR potential: 1:2 — 1:3 depending on entry
🧠 Why this move makes sense
1️⃣ Price rejected Ichimoku cloud + structure resistance
2️⃣ USD weakness continues after recent pullback
3️⃣ JPY demand increases as risk sentiment cools ahead of key macro events
📌 What to expect
If price retests the flag support from below and rejects again, bearish momentum could accelerate toward 156.05 → 155.62.
💬 Your turn
Which target will hit first in your view — TP1 or TP2?
👇 Comment below — I reply to all comments.
🔖 SAVE this post so you don’t miss the trade update.
👍 LIKE if you want more Bear Flag & Triangle setups.
⚠ Disclaimer: For educational purposes only. Not financial advice. Trade based on your plan & risk management.
#USDJPY #forex #bearflag #priceaction #tradingview #technicalanalysis #chartanalysis #forexanalysis #ickycloud #supportandresistance #forextrading #marketstructure #smartmoney

EURUSD Last bounce before a Lower Low.The EURUSD pair continues to trade within its 2-month Channel Down and following the start of the latest Bearish Leg since the November 13 Lower High rejection on the 1D MA50 (blue trend-line), we are now experiencing the first consolidation phase.
Based on the previous Bearish Legs of this pattern, this consolidation could end up in a short-term rebound limited by the 0.786 Fibonacci retracement level, only for it to be rejected and resume the bearish trend.
Both previous rejections eventually made a Lower Low for the Channel Down, hitting the -0.618 Fibonacci extension (minimum), declining in total Bearish Leg terms by at least -2.03%.
As a result, our 1.14200 medium-term Target (still above both conditions) remains valid, but we will close it earlier if we see the price hit the 1D MA200 (orange trend-line) and fail to close the 1D candle below it.
---
** Please LIKE 👍, FOLLOW ✅, SHARE 🙌 and COMMENT ✍ if you enjoy this idea! Also share your ideas and charts in the comments section below! This is best way to keep it relevant, support us, keep the content here free and allow the idea to reach as many people as possible. **
---
💸💸💸💸💸💸
👇 👇 👇 👇 👇 👇

USDJPY - Bulls Watching the Intersection Zone!📈USDJPY remains overall bullish, moving steadily inside its rising channel. After a strong impulsive move upward, the pair is now forming a healthy correction, heading toward a key confluence area.
⚔️As price approaches the intersection of the lower trendlines and the demand zone, we will be looking for trend-following longs. This orange area has acted as a strong support multiple times, and with both trendlines meeting there, it becomes a high-probability spot for buyers to step in.
🏹If the bulls defend this zone , USDJPY could resume its upward movement and push toward new highs. Only a clear break below the demand zone would weaken the bullish outlook.
For now, the plan is simple: wait for the retest… then look for longs from structure. 🤔
⚠️ Disclaimer: This is not financial advice. Always do your own research and manage risk properly.
📚 Stick to your trading plan regarding entries, risk, and management.
Good luck! 🍀
All Strategies Are Good; If Managed Properly!
~Richard Nasr

EURUSD Sell from High Volume ZonesCurrent Situation
On EUR/USD, we observe activity from a large limit player at the 1.15116 level, which has stopped the price movement. Two high volume zones and two potential reversal levels have been identified where price reaction is possible.
Main Scenario
Considering selling from the high volume zones with the target of moving toward the 1.15116 level, where large player interest is located.
Alternative Scenario
If price does not reach the high volume zones and reverses earlier toward the 1.15116 level, the trade will be skipped due to an unfavorable risk-to-reward ratio.
Trading Plan
Entry Points: From high volume zones (marked on the chart)
Reversal Levels: Two levels marked on the chart
Target: 1.15116
Position Management
Profit-taking is planned on approach to the 1.15116 level or directly at this level.
Risk Management
Always consider the risk-to-reward ratio before entering. Place stop-loss above entry zones, accounting for instrument volatility.

Bearish reversal off 61.8% FIbonacci resistance?Gold (XAU/USD) is reacting off the pivot, which is a pullback support that aligns with the 61.8% Fibonacci retracement and could reverse to the 1st support.
Pivot: 4,147.61
1st Support: 4,093.63
1st Resistance: 4,219.46
Disclaimer:
The opinions given above constitute general market commentary and do not constitute the opinion or advice of IC Markets or any form of personal or investment advice.
Any opinions, news, research, analyses, prices, other information, or links to third-party sites contained on this website are provided on an "as-is" basis, are intended to be informative only, and are not advice, a recommendation, research, a record of our trading prices, an offer of, or solicitation for, a transaction in any financial instrument and thus should not be treated as such. The information provided does not involve any specific investment objectives, financial situation, or needs of any specific person who may receive it. Please be aware that past performance is not a reliable indicator of future performance and/or results. Past performance or forward-looking scenarios based upon the reasonable beliefs of the third-party provider are not a guarantee of future performance. Actual results may differ materially from those anticipated in forward-looking or past performance statements. IC Markets makes no representation or warranty and assumes no liability as to the accuracy or completeness of the information provided, nor any loss arising from any investment based on a recommendation, forecast, or any information supplied by any third party.

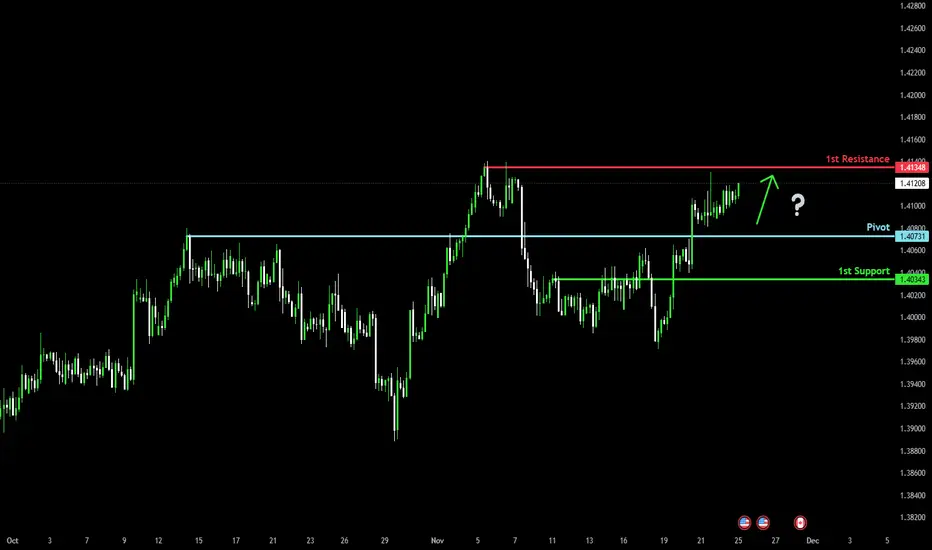
Bullish momentum to set to continue?Loonie (USD/CAD) could fall towards the pivot, which is a pullback support and could bounce to the 1st resistance.
Pivot: 1.4073
1st Support: 1.4034
1st Resistance: 1.4134
Disclaimer:
The opinions given above constitute general market commentary and do not constitute the opinion or advice of IC Markets or any form of personal or investment advice.
Any opinions, news, research, analyses, prices, other information, or links to third-party sites contained on this website are provided on an "as-is" basis, are intended to be informative only, and are not advice, a recommendation, research, a record of our trading prices, an offer of, or solicitation for, a transaction in any financial instrument and thus should not be treated as such. The information provided does not involve any specific investment objectives, financial situation, or needs of any specific person who may receive it. Please be aware that past performance is not a reliable indicator of future performance and/or results. Past performance or forward-looking scenarios based upon the reasonable beliefs of the third-party provider are not a guarantee of future performance. Actual results may differ materially from those anticipated in forward-looking or past performance statements. IC Markets makes no representation or warranty and assumes no liability as to the accuracy or completeness of the information provided, nor any loss arising from any investment based on a recommendation, forecast, or any information supplied by any third party.
Bullish continuation?Swissie (USD/CHF) could make a short-term pullback to the pivot and could bounce to the swing high resistance.
Pivot: 0.8030
1st Support: 0.7987
1st Resistance: 0.8109
Disclaimer:
The opinions given above constitute general market commentary and do not constitute the opinion or advice of IC Markets or any form of personal or investment advice.
Any opinions, news, research, analyses, prices, other information, or links to third-party sites contained on this website are provided on an "as-is" basis, are intended to be informative only, and are not advice, a recommendation, research, a record of our trading prices, an offer of, or solicitation for, a transaction in any financial instrument and thus should not be treated as such. The information provided does not involve any specific investment objectives, financial situation, or needs of any specific person who may receive it. Please be aware that past performance is not a reliable indicator of future performance and/or results. Past performance or forward-looking scenarios based upon the reasonable beliefs of the third-party provider are not a guarantee of future performance. Actual results may differ materially from those anticipated in forward-looking or past performance statements. IC Markets makes no representation or warranty and assumes no liability as to the accuracy or completeness of the information provided, nor any loss arising from any investment based on a recommendation, forecast, or any information supplied by any third party.
