EURUSD— FRGNT DAILY CHART FORECAST.Q1 | W4 | D29 | Y26📅 Q1 | W4 | D29 | Y26
📊EURUSD— FRGNT DAILY CHART FORECAST
🔍 Analysis Approach
I’m applying a developed version of Smart Money Concepts, with a structured focus on:
• Identifying Key Points of Interest (POIs) on Higher Time Frames (HTFs) 🕰️
• Using those POIs to define a clear and controlled trading range 📐
• Refining those zones on Lower Time Frames (LTFs) 🔎
• Waiting for a Break of Structure (BoS) as confirmation ✅
This process keeps me precise, disciplined, and aligned with market narrative, rather than reacting emotionally or chasing price.
💡 My Motto
“Capital management, discipline, and consistency in your trading edge.”
A positive risk-to-reward ratio, combined with a high-probability execution model, is the backbone of any sustainable trading plan 📈🔐
⚠️ On Losses
Losses are part of the mathematical reality of trading 🎲
They don’t define you — they are necessary, expected, and managed.
We acknowledge them, learn, and move forward 📊➡️
🙏 I appreciate you taking the time to review my Daily Forecast.
Further context and supporting material can be found in the Links section.
Stay sharp 🧠
Stay consistent 🎯
Protect your capital 🔐
— FRGNT 🚀📈
FX:EURUSD
USD

BCHUSD H4 | Bearish Drop OffThe price could rise to our sell entry level at 584.62, which is a pullback resistance.
Our stop loss is set at 607.01, which is a pullback resistance.
Our take profit is set at 563.43, which is a multi swing low support.
High Risk Investment Warning
Stratos Markets Limited fxcm.com Stratos Europe Ltd fxcm.com
CFDs are complex instruments and come with a high risk of losing money rapidly due to leverage. 69% of retail investor accounts lose money when trading CFDs with this provider. You should consider whether you understand how CFDs work and whether you can afford to take the high risk of losing your money.
Stratos Global LLC fxcm.com Losses can exceed deposits.
Please be advised that the information presented on TradingView is provided to FXCM (‘Company’, ‘we’) by a third-party provider (‘TFA Global Pte Ltd’). Please be reminded that you are solely responsible for the trading decisions on your account. Any information and/or content is intended entirely for research, educational and informational purposes only and does not constitute investment or consultation advice or investment strategy. The information is not tailored to the investment needs of any specific person and therefore does not involve a consideration of any of the investment objectives, financial situation or needs of any viewer that may receive it. Past performance is not a reliable indicator of future results. Actual results may differ materially from those anticipated in forward-looking or past performance statements. We assume no liability as to the accuracy or completeness of any of the information and/or content provided herein and the Company cannot be held responsible for any omission, mistake nor for any loss or damage including without limitation to any loss of profit which may arise from reliance on any information supplied by TFA Global Pte Ltd.
Stratos Trading Pty. Limited fxcm.com
Trading FX/CFDs carries significant risks. FXCM AU (AFSL 309763), please read the Financial Services Guide, Product Disclosure Statement, Target Market Determination and Terms of Business at fxcm.com

Potential bullish continuation?WTI Oil (XTI/USD) could fall towards the pivot which isan overlap support and could bounce to the 1st resistance.
Pivot: 62.45
1st Support: 60.81
1st Resistance: 65.26
Disclaimer:
The opinions given above constitute general market commentary and do not constitute the opinion or advice of IC Markets or any form of personal or investment advice.
Any opinions, news, research, analyses, prices, other information, or links to third-party sites contained on this website are provided on an "as-is" basis, are intended to be informative only, and are not advice, a recommendation, research, a record of our trading prices, an offer of, or solicitation for, a transaction in any financial instrument and thus should not be treated as such. The information provided does not involve any specific investment objectives, financial situation, or needs of any specific person who may receive it. Please be aware that past performance is not a reliable indicator of future performance and/or results. Past performance or forward-looking scenarios based upon the reasonable beliefs of the third-party provider are not a guarantee of future performance. Actual results may differ materially from those anticipated in forward-looking or past performance statements. IC Markets makes no representation or warranty and assumes no liability as to the accuracy or completeness of the information provided, nor any loss arising from any investment based on a recommendation, forecast, or any information supplied by any third party

Bearish drop off?USD/JPY has rejected off the pivot, which is a pullback resistance, and could drop to the 1st support.
Pivot: 153.59
1st Support: 152.15
1st Resistance: 154.77
Disclaimer:
The opinions given above constitute general market commentary and do not constitute the opinion or advice of IC Markets or any form of personal or investment advice.
Any opinions, news, research, analyses, prices, other information, or links to third-party sites contained on this website are provided on an "as-is" basis, are intended to be informative only, and are not advice, a recommendation, research, a record of our trading prices, an offer of, or solicitation for, a transaction in any financial instrument and thus should not be treated as such. The information provided does not involve any specific investment objectives, financial situation, or needs of any specific person who may receive it. Please be aware that past performance is not a reliable indicator of future performance and/or results. Past performance or forward-looking scenarios based upon the reasonable beliefs of the third-party provider are not a guarantee of future performance. Actual results may differ materially from those anticipated in forward-looking or past performance statements. IC Markets makes no representation or warranty and assumes no liability as to the accuracy or completeness of the information provided, nor any loss arising from any investment based on a recommendation, forecast, or any information supplied by any third party

USDJPY H4 | Bearish ContinuationThe price has rejected off our sell entry level at 154.04, which is a pullback resistance that is slightly above the 23.6% Fibonacci retracement.
Our stop loss is set at 155.20, which is a pullback resistance that is slightly above the 38.2% Fibonacci retracement.
Our take profit is set at 151.66, which is a swing low support.
High Risk Investment Warning
Stratos Markets Limited fxcm.com Stratos Europe Ltd fxcm.com
CFDs are complex instruments and come with a high risk of losing money rapidly due to leverage. 69% of retail investor accounts lose money when trading CFDs with this provider. You should consider whether you understand how CFDs work and whether you can afford to take the high risk of losing your money.
Stratos Global LLC fxcm.com Losses can exceed deposits.
Please be advised that the information presented on TradingView is provided to FXCM (‘Company’, ‘we’) by a third-party provider (‘TFA Global Pte Ltd’). Please be reminded that you are solely responsible for the trading decisions on your account. Any information and/or content is intended entirely for research, educational and informational purposes only and does not constitute investment or consultation advice or investment strategy. The information is not tailored to the investment needs of any specific person and therefore does not involve a consideration of any of the investment objectives, financial situation or needs of any viewer that may receive it. Past performance is not a reliable indicator of future results. Actual results may differ materially from those anticipated in forward-looking or past performance statements. We assume no liability as to the accuracy or completeness of any of the information and/or content provided herein and the Company cannot be held responsible for any omission, mistake nor for any loss or damage including without limitation to any loss of profit which may arise from reliance on any information supplied by TFA Global Pte Ltd.
Stratos Trading Pty. Limited fxcm.com
Trading FX/CFDs carries significant risks. FXCM AU (AFSL 309763), please read the Financial Services Guide, Product Disclosure Statement, Target Market Determination and Terms of Business at fxcm.com

USDCAD: Bearish! Sell The Pullback!Welcome back to the Weekly Forex Forecast for the week of Jan 26-30th.
USDCAD is weak, as the USD is trending lower against the CAD. Looking at the bearish momentum from las t week to continue going into this week.
Enjoy!
May profits be upon you.
Leave any questions or comments in the comment section.
I appreciate any feedback from my viewers!
Like and/or subscribe if you want more accurate analysis.
Thank you so much!
Disclaimer:
I do not provide personal investment advice and I am not a qualified licensed investment advisor.
All information found here, including any ideas, opinions, views, predictions, forecasts, commentaries, suggestions, expressed or implied herein, are for informational, entertainment or educational purposes only and should not be construed as personal investment advice. While the information provided is believed to be accurate, it may include errors or inaccuracies.
I will not and cannot be held liable for any actions you take as a result of anything you read here.
Conduct your own due diligence, or consult a licensed financial advisor or broker before making any and all investment decisions. Any investments, trades, speculations, or decisions made on the basis of any information found on this channel, expressed or implied herein, are committed at your own risk, financial or otherwise.

Bullish continuation?Cable (GBP/USD) could fall towards the pivot, which acts as a pullback support, and could bounce to the 1st resistance.
Pivot: 1.3668
1st Support: 1.3550
1st Resistance: 1.3849
Disclaimer:
The opinions given above constitute general market commentary and do not constitute the opinion or advice of IC Markets or any form of personal or investment advice.
Any opinions, news, research, analyses, prices, other information, or links to third-party sites contained on this website are provided on an "as-is" basis, are intended to be informative only, and are not advice, a recommendation, research, a record of our trading prices, an offer of, or solicitation for, a transaction in any financial instrument and thus should not be treated as such. The information provided does not involve any specific investment objectives, financial situation, or needs of any specific person who may receive it. Please be aware that past performance is not a reliable indicator of future performance and/or results. Past performance or forward-looking scenarios based upon the reasonable beliefs of the third-party provider are not a guarantee of future performance. Actual results may differ materially from those anticipated in forward-looking or past performance statements. IC Markets makes no representation or warranty and assumes no liability as to the accuracy or completeness of the information provided, nor any loss arising from any investment based on a recommendation, forecast, or any information supplied by any third party

Falling towards pullback support?Fiber (EUR/USD) is falling towards the pivot, which is a pullback support and could bounce to the 1st resistance.
Pivot: 1.1804
1st Support: 1.1730
1st Resistance: 1.2039
Disclaimer:
The opinions given above constitute general market commentary and do not constitute the opinion or advice of IC Markets or any form of personal or investment advice.
Any opinions, news, research, analyses, prices, other information, or links to third-party sites contained on this website are provided on an "as-is" basis, are intended to be informative only, and are not advice, a recommendation, research, a record of our trading prices, an offer of, or solicitation for, a transaction in any financial instrument and thus should not be treated as such. The information provided does not involve any specific investment objectives, financial situation, or needs of any specific person who may receive it. Please be aware that past performance is not a reliable indicator of future performance and/or results. Past performance or forward-looking scenarios based upon the reasonable beliefs of the third-party provider are not a guarantee of future performance. Actual results may differ materially from those anticipated in forward-looking or past performance statements. IC Markets makes no representation or warranty and assumes no liability as to the accuracy or completeness of the information provided, nor any loss arising from any investment based on a recommendation, forecast, or any information supplied by any third party

Neural Brain Diagnosis: EUR/USD Short (Forensic Analysis)The "Glass Box" Verdict: EUR/USD (1H)
Most indicators are black boxes. The Neural Brain tells you why it's taking the trade. Here is the forensic breakdown of the SELL signal on Euro.
📉 1. THE PHYSICS: Efficiency Score (0.34)
Status: Structured Grind
The Math: For every pip gained downside, the market travels ~3x the distance in chop ($0.002 Net / $0.007 Noise).
The Meaning: This isn't a crash; it's a "grind." Sellers are winning, but it is a fight. The structure is messy but valid.
🧠 2. THE MIND: Conviction (GAINING)
Status: Bearish Lock
Bias: BEARISH (Price < Cloud).
The Paradox: Despite the "Mixed" efficiency, the AI's conviction is GAINING. The math detects that this volatility is "persistent distribution," not indecision.
🎯 3. THE STRATEGY: TRACKING
Signal: SELL (100% Confidence)
Action: Press the Short. The AI determines the bearish momentum is statistically significant enough to override the noise.
Disclaimer: Educational analysis via CustomQuantLabs.

Potential bullish bounce?USD/JPY is falling towards the support level, which is a pullback support and could bounce from this level to our take profit.
Entry: 152.98
Why we like it:
There is a pullback support level.
Stop loss: 152.13
Why we like it:
There is a pullback support level.
Take profit: 154.76
Why we like it:
There is a pullback resistance level that aligns with the 38.2% Fibonacci retracement.
Enjoying your TradingView experience? Review us!
TradingView (www.tradingview.com)
Please be advised that the information presented on TradingView is provided to Vantage (‘Vantage Global Limited’, ‘we’) by a third-party provider (‘Everest Fortune Group’). Please be reminded that you are solely responsible for the trading decisions on your account. There is a very high degree of risk involved in trading. Any information and/or content is intended entirely for research, educational and informational purposes only and does not constitute investment or consultation advice or investment strategy. The information is not tailored to the investment needs of any specific person and therefore does not involve a consideration of any of the investment objectives, financial situation or needs of any viewer that may receive it. Kindly also note that past performance is not a reliable indicator of future results. Actual results may differ materially from those anticipated in forward-looking or past performance statements. We assume no liability as to the accuracy or completeness of any of the information and/or content provided herein and the Company cannot be held responsible for any omission, mistake nor for any loss or damage including without limitation to any loss of profit which may arise from reliance on any information supplied by Everest Fortune Group.

Could we see a reversal from here?USD/CHF has bounced off the support level, which is a pullback support, and could potentially rise from this level to our take profit.
Entry: 0.7666
Why we like it:
There is a pullback support level.
Stop loss: 0.7599
Why we like it:
There is a pullback support level.
Take profit: 0.7792
Why we like it:
There is a pullback resistance level that aligns with the 50% Fibonacci retracement.
Enjoying your TradingView experience? Review us!
TradingView (www.tradingview.com)
Please be advised that the information presented on TradingView is provided to Vantage (‘Vantage Global Limited’, ‘we’) by a third-party provider (‘Everest Fortune Group’). Please be reminded that you are solely responsible for the trading decisions on your account. There is a very high degree of risk involved in trading. Any information and/or content is intended entirely for research, educational and informational purposes only and does not constitute investment or consultation advice or investment strategy. The information is not tailored to the investment needs of any specific person and therefore does not involve a consideration of any of the investment objectives, financial situation or needs of any viewer that may receive it. Kindly also note that past performance is not a reliable indicator of future results. Actual results may differ materially from those anticipated in forward-looking or past performance statements. We assume no liability as to the accuracy or completeness of any of the information and/or content provided herein and the Company cannot be held responsible for any omission, mistake nor for any loss or damage including without limitation to any loss of profit which may arise from reliance on any information supplied by Everest Fortune Group.

Bullish momentum to extend?GBP/USD is falling towards the support level, which is a pullback support that aligns with the 38.2% Fibonacci retracement and could bounce from this level to our take profit.
Entry: 1.3657
Why we like it:
There is a pullback support level that aligns with the 38.2% Fibonacci retracement.
Stop loss: 1.3553
Why we like it:
There is a pullback support level that aligns with the 61.8% Fibonacci retracement.
Take profit: 1.3841
Why we like it:
There is a pullback resistance level.
Enjoying your TradingView experience? Review us!
TradingView (www.tradingview.com)
Please be advised that the information presented on TradingView is provided to Vantage (‘Vantage Global Limited’, ‘we’) by a third-party provider (‘Everest Fortune Group’). Please be reminded that you are solely responsible for the trading decisions on your account. There is a very high degree of risk involved in trading. Any information and/or content is intended entirely for research, educational and informational purposes only and does not constitute investment or consultation advice or investment strategy. The information is not tailored to the investment needs of any specific person and therefore does not involve a consideration of any of the investment objectives, financial situation or needs of any viewer that may receive it. Kindly also note that past performance is not a reliable indicator of future results. Actual results may differ materially from those anticipated in forward-looking or past performance statements. We assume no liability as to the accuracy or completeness of any of the information and/or content provided herein and the Company cannot be held responsible for any omission, mistake nor for any loss or damage including without limitation to any loss of profit which may arise from reliance on any information supplied by Everest Fortune Group.

Falling towards 50% Fib support?EUR/USD is falling towards the support level, which is a pullback support slightly below the 50% Fibonacci retracement and could bounce from this level to our take profit.
Entry: 1.1806
Why we like it:
There is a pullback support that is slightly below the 50% Fibonacci retracement.
Stop loss: 1.1701
Why we like it:
There is an overlap support that aligns with the 78.6% Fibonacci retracement.
Take profit: 1.2037
Why we like it:
There is a pullback resistance level.
Enjoying your TradingView experience? Review us!
TradingView (www.tradingview.com)
Please be advised that the information presented on TradingView is provided to Vantage (‘Vantage Global Limited’, ‘we’) by a third-party provider (‘Everest Fortune Group’). Please be reminded that you are solely responsible for the trading decisions on your account. There is a very high degree of risk involved in trading. Any information and/or content is intended entirely for research, educational and informational purposes only and does not constitute investment or consultation advice or investment strategy. The information is not tailored to the investment needs of any specific person and therefore does not involve a consideration of any of the investment objectives, financial situation or needs of any viewer that may receive it. Kindly also note that past performance is not a reliable indicator of future results. Actual results may differ materially from those anticipated in forward-looking or past performance statements. We assume no liability as to the accuracy or completeness of any of the information and/or content provided herein and the Company cannot be held responsible for any omission, mistake nor for any loss or damage including without limitation to any loss of profit which may arise from reliance on any information supplied by Everest Fortune Group.

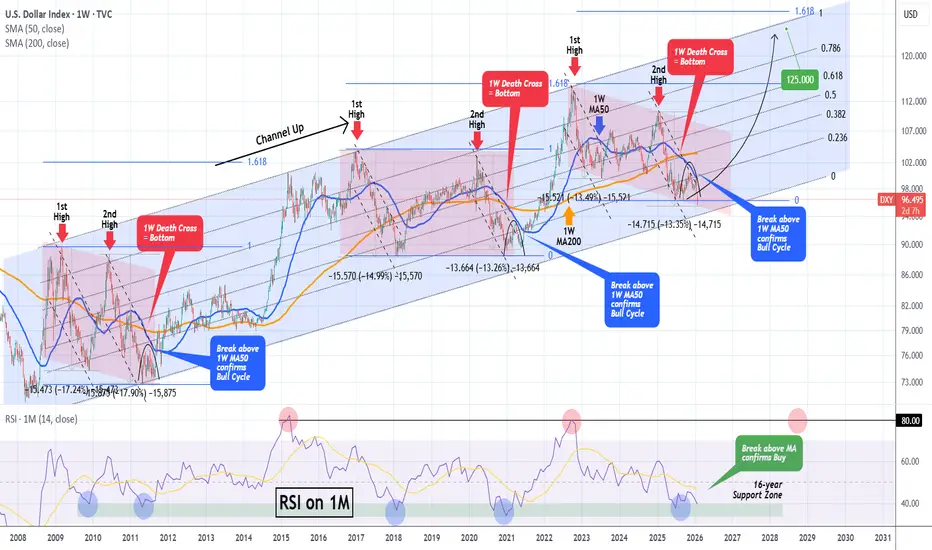
DXY has bottomed and is starting a massive 2-year rallyThe U.S. Dollar index (DXY) has been trading within a Channel Up since the March 2008 bottom during the U.S. Housing Crisis. This is not the first time we use this pattern to identify key macro trend shifts, in fact we revisited it 2 months ago, calling for 'a final pull-back before a massive rally'.
Well the time for this rally is here as yesterday it completed a -13.35% decline from the January 2025 High a year ago.
That decline was technically the Bearish Leg of this pattern's correction phase (red Channel). This is part of its incredible symmetry, with similar correction phases throughout this time period followed by bullish phases, that eventually lead to price rallies to the 1.618 Fibonacci extension.
All conditions for the new Bull Cycle (Bullish Leg) have been fulfilled. Along with the price being at the bottom of the Channel Up, with the -13.35% decline being a benchmark correction historically, we are also past a 1W Death Cross, which has always been a bottom signal on this multi-year Channel Up.
This has always happened at the end of the Bear Cycles (red correction phase) with the Arc pattern making a multi-week Double Bottom before the decisive rebound the breaks above the 1W MA50 (blue trend-line). That break-out is the confirmation of the Bull Cycle start (Bullish Leg).
With the 1M RSI having already touched its 16-year Support Zone, which has provided the most optimal Buy Signals throughout this pattern, we expect the Dollar Index to start rising aggressively in the long-term, targeting the 120.000 - 128.000 Zone on its way to the 1.618 Fib ext, which has been where the previous Higher Highs (Cycle Tops) were priced. 125.000 is a fair Target within a 2-year time-frame.
Notice also that a solid peak indicator (Sell signal) is when the 1M RSI hits 80.00, indicating that the market is massively overbought (overheated trend).
---
** Please LIKE 👍, FOLLOW ✅, SHARE 🙌 and COMMENT ✍ if you enjoy this idea! Also share your ideas and charts in the comments section below! This is best way to keep it relevant, support us, keep the content here free and allow the idea to reach as many people as possible. **
---
💸💸💸💸💸💸
👇 👇 👇 👇 👇 👇
BTCUSD | Rejection Seeing a lot of people online talking about their BTC long positions.
Here I am to share you my short bias idea. With the big red weekly candle from last week, I am looking for a rejection from the upper zone. ($91.000)
If this one breaks I would be out of short ideas. I would like one of those big red candles on one of the higher time frames. The one that makes the bull shiver.
Let me know what you are thinking!
Do your own due diligence, this is not investment advise!

GOLD | ATH at 5311 – Correction Below 5265 in FocusGOLD | New Record Above $5,300 as Dollar Pressure Intensifies
Gold prices surged to fresh record highs above $5,300, after President Donald Trump added pressure on the U.S. dollar by stating he was not concerned about currency declines. As a result, the most actively traded gold futures climbed to around $5,306 per ounce, marking a new intraday record and reinforcing strong safe-haven demand.
The combination of USD weakness, political pressure, and ongoing macro uncertainty continues to support gold, although short-term profit-taking is now emerging after the sharp rally.
Technical Outlook
Gold recorded a new all-time high at 5311 and is currently trading in a corrective phase.
While price trades below the 5265 pivot, a bearish correction is favored toward 5233 and 5216. From this zone, a bullish reaction is possible.
However, if price stabilizes below 5216, the correction could extend toward 5185 and 5163.
On the upside, a recovery above 5265 would support renewed bullish momentum toward 5282 and 5300.
A break above 5300 would reopen upside targets at 5328 and 5350.
Key Levels
• Pivot: 5265
• Support: 5233 – 5216 – 5185 – 5163
• Resistance: 5282 – 5300 – 5328 – 5350
previous idea:

QuyetP | EURUSD: Buy Until the Trend BreaksFX:USDOLLAR is in a strong bearish trend as we all see.
OANDA:EURUSD price just retraced exactly at the 1H base zone and swept previous 1H low - just a breakout + retest setup.
That is enough reasons for me to enter a continuation buy setup.
"If a trading setup needs too much explanation, it’s probably not a good trade." :)

THE DOLLAR IS CRACKING | HISTORIC 4-YEAR LOWS 🚨 THE DOLLAR IS CRACKING | HISTORIC 4-YEAR LOWS 🚨
The TVC:DXY (USD Index) has officially reached a critical tipping point. We haven't seen these levels in 4 years, and the global markets are feeling the heat. This is the definition of a "Make or Break" zone.
📉 THE CRITICAL LEVEL: 94
The dollar is currently hovering at 96. If we see a weekly candle close below 94, the dollar officially enters a structural breakdown.
* If it breaks: It will be "hard" to ever recover that ground.
* The Result: A massive capital flight into hard assets—most notably GOLD.
💰 MARKET SNAPSHOT (TODAY):
* 💵 USD Index: 96.00
* 🟡 GOLD: $5,266
* ⚪️ SILVER: $115.2
* 📈 Nasdaq: 26,210
* 💷 GBP/USD: 1.3812
* 🇦🇪 XAU/AED: 19312
THOUGHTS: The inverse correlation is screaming. As the Dollar loses its grip, Gold and Silver are entering a new era of price discovery. This week's close determines the next decade of macro trends.
Stay sharp. Stay hedged. 🛡
---
✨ ✨
The pulse of the markets.

Potential bullish reversal?Ethereum (ETH/USD) is falling towards the pivot and could bounce to the 1st resistance.
Pivot: 2,956.16
1st Support: 2,814.66
1st Resistance: 3,162.22
Disclaimer:
The opinions given above constitute general market commentary and do not constitute the opinion or advice of IC Markets or any form of personal or investment advice.
Any opinions, news, research, analyses, prices, other information, or links to third-party sites contained on this website are provided on an "as-is" basis, are intended to be informative only, and are not advice, a recommendation, research, a record of our trading prices, an offer of, or solicitation for, a transaction in any financial instrument and thus should not be treated as such. The information provided does not involve any specific investment objectives, financial situation, or needs of any specific person who may receive it. Please be aware that past performance is not a reliable indicator of future performance and/or results. Past performance or forward-looking scenarios based upon the reasonable beliefs of the third-party provider are not a guarantee of future performance. Actual results may differ materially from those anticipated in forward-looking or past performance statements. IC Markets makes no representation or warranty and assumes no liability as to the accuracy or completeness of the information provided, nor any loss arising from any investment based on a recommendation, forecast, or any information supplied by any third party

Silver XAG/USD - Breakout + Retest Signals Upside Continuation📝 Description🔍 Setup (Market Structure) FX:XAGUSD
XAG/USD is forming a well-defined Triangle Breakout pattern on the M30 timeframe.
After a strong bullish move, price consolidated with lower highs and higher lows, compressing volatility — a classic sign of an upcoming expansion.
Price has now broken above the triangle resistance and is showing a healthy breakout & retest, supported by EMA and holding above the structure.
This favors a bullish continuation scenario.
📍 Support & Resistance
🟨 Support Zone: 104.70 – 106.00
🟢 1st Resistance: 123.90
🟢 2nd Resistance: 130.00 – 130.20
⚠️ Disclaimer
This analysis is for educational purposes only.
Commodities are volatile — always use proper risk management and position sizing.
💬 Support the Idea👍 Like if you’re bullish on Silver
💬 Comment: Clean breakout or fake move?🔁 Share with traders watching XAG/USD
#XAGUSD #Silver #CommodityTrading #TriangleBreakout #PriceAction #TechnicalAnalysis #TradingView #Kabhi_TA_Trading

USDCHF Oversold and approaching an 11-year Low.The USDCHF pair has been trading within a Channel Down since its November 2022 High rejection on the 1M MA200 (orange trend-line). This month isn't only approaching the bottom of that pattern but also Support 1, which consists of the January 2015 Low (0.74250).
With the 1M RSI almost oversold and similar to December 2020 (every oversold 1M RSI has historically been a massive long-term buy signal), we don't technically believe that this decline has much more room to extend to, beyond at least the -17.86% of the previous Bearish Leg.
Instead, we treat this as an excellent long-term buy opportunity, with a first Target on the 0.5 Fibonacci retracement level (again similar as the previous Channel Down rebound) at 0.83450. Note that this is more suited to long-term investors and not shorter term traders.
---
** Please LIKE 👍, FOLLOW ✅, SHARE 🙌 and COMMENT ✍ if you enjoy this idea! Also share your ideas and charts in the comments section below! This is best way to keep it relevant, support us, keep the content here free and allow the idea to reach as many people as possible. **
---
💸💸💸💸💸💸
👇 👇 👇 👇 👇 👇

NZDUSD Breakout and Potential Retrace!Hey Traders, in today's trading session we are monitoring NZDUSD for a buying opportunity around 0.58200 zone, NZDUSD was trading in a downtrend and successfully managed to break it out. Currently is in a correction phase in which it is approaching the retrace area at 0.58200 support and resistance area.
Trade safe, Joe.

GOLD | Breaks $5,100 as Shutdown & Geopolitical Risks RiseGOLD | Breaks Above $5,100 as Shutdown & Geopolitical Risks Fuel Rally
Gold surged above $5,100 per ounce, extending its historic rally after decisively breaking the $5,000 psychological level. The move comes as markets react to rising U.S. government shutdown fears, persistent geopolitical tensions, and expectations that the Federal Reserve may be approaching the later stage of its restrictive cycle.
With risk sentiment fragile and real yields under pressure, gold continues to attract strong safe-haven demand, keeping volatility elevated despite overextended conditions.
Technical Outlook
After the sharp upside move, price is expected to consolidate within the 5097–5077 zone before the next directional break.
A confirmed 15min or 1H close below 5077 would signal a deeper corrective move toward 5052, with further downside risk toward the 5000 psychological level.
However, price stability above 5052, and especially a hold above 5097, would keep the bullish structure intact and support a continuation toward 5140 and 5168.
Key Levels
• Pivot Zone: 5077 – 5097
• Support: 5052 – 5000
• Resistance: 5140 – 5168
