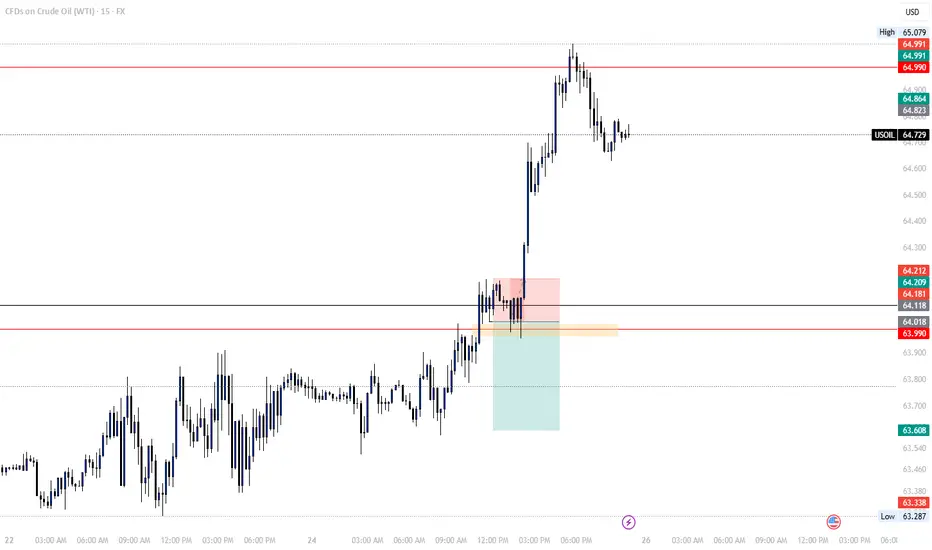
CRUDE OIL Short From Resistance! Sell!
Hello,Traders!
CRUDE OIL made a retest
Of the horizontal resistance
Of 65.00$ from where
We are already seeing a
Bearish reaction and we
Will be expecting a
Further bearish move down
Sell!
Comment and subscribe to help us grow!
Check out other forecasts below too!
Disclosure: I am part of Trade Nation's Influencer program and receive a monthly fee for using their TradingView charts in my analysis.
Crude Oil WTI

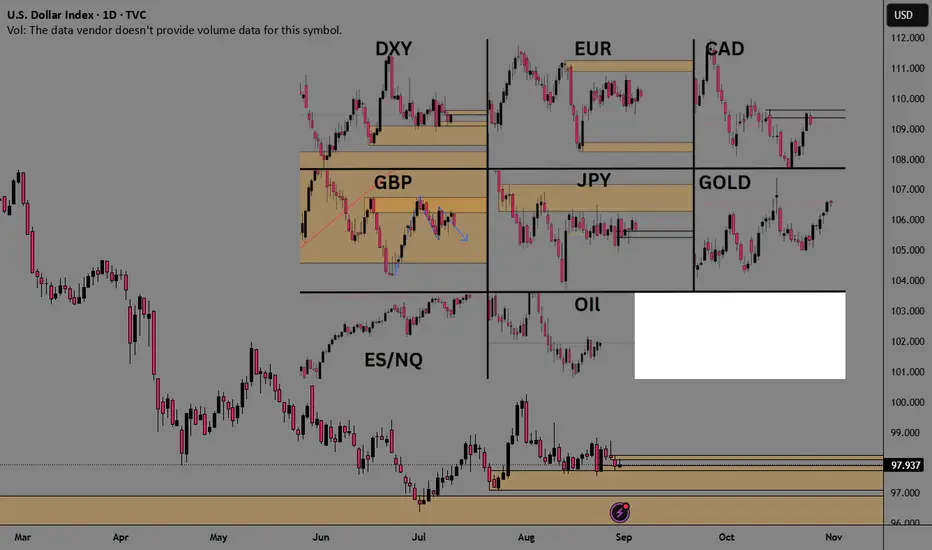
Current Price Action All MarketsWanted to share a picture of the daily TF price action of the major markets.
1) August has been a very slow market for forex. Nothing but chop... Especially over the last 3 weeks.,
2)Stocks and gold have seen a slow grinding uptrend.,
Each market is unique in its own right and benefits not only different types of traders, but also different setups perform better during specific market conditions. It's essential to trade various types of market conditions to suit your style, as well as when you perform at your best and worst.
WTI Crude Oil – Range Support in FocusWe're waiting for price to reach the bottom of the range, and with a solid buy signal, we’ll consider going long.
However, since this level has been tested multiple times, it’s highly vulnerable to stop fishing — so caution is key.
As always, we’re ready for all scenarios:
If price breaks below, we’ll wait for a pullback to enter short.
But right now, we’re watching the range support for potential longs

USOIL SENDS CLEAR BEARISH SIGNALS|SHORT
USOIL SIGNAL
Trade Direction: short
Entry Level: 64.06
Target Level: 61.35
Stop Loss: 65.86
RISK PROFILE
Risk level: medium
Suggested risk: 1%
Timeframe: 12h
Disclosure: I am part of Trade Nation's Influencer program and receive a monthly fee for using their TradingView charts in my analysis.
✅LIKE AND COMMENT MY IDEAS✅

Oil Market Faces Balancing Act as Supply Risks Meet Glut FearsOil Market Faces Balancing Act as Supply Risks Meet Glut Fears
Russian supply risks are clashing with growing concerns of a global supply glut as summer winds down. Crude benchmarks gained over 1% in the previous session after the EIA reported a larger-than-expected draw in U.S. crude inventories, though the pace of declines slowed from the prior week.
Analysts warn that OPEC+ unwinding production cuts, combined with rising output from non-member producers, could tip the market into surplus, according to MUFG’s Soojin Kim.
While Brent continues to trade at a near-term premium, signaling tight supplies, that premium has narrowed — a sign of softening demand expectations ahead.

USOIL H4 | Bearish reversal offUSOIL has reacted off the sell entry, which acts as a pullback resistance that aligns with the 50% Fibonacci retracement and could drop from this level to the downside.
Sell entry is at 63.96, which is a pullback resistance that aligns with the 50% Fibonacci retracement.
Stop loss is at 65.00, which is a pullback resistance.
Take profit is at 61.80, which is a swing low support.
High Risk Investment Warning
Trading Forex/CFDs on margin carries a high level of risk and may not be suitable for all investors. Leverage can work against you.
Stratos Markets Limited (tradu.com ):
CFDs are complex instruments and come with a high risk of losing money rapidly due to leverage. 65% of retail investor accounts lose money when trading CFDs with this provider. You should consider whether you understand how CFDs work and whether you can afford to take the high risk of losing your money.
Stratos Europe Ltd (tradu.com ):
CFDs are complex instruments and come with a high risk of losing money rapidly due to leverage. 66% of retail investor accounts lose money when trading CFDs with this provider. You should consider whether you understand how CFDs work and whether you can afford to take the high risk of losing your money.
Stratos Global LLC (tradu.com ):
Losses can exceed deposits.
Please be advised that the information presented on TradingView is provided to Tradu (‘Company’, ‘we’) by a third-party provider (‘TFA Global Pte Ltd’). Please be reminded that you are solely responsible for the trading decisions on your account. There is a very high degree of risk involved in trading. Any information and/or content is intended entirely for research, educational and informational purposes only and does not constitute investment or consultation advice or investment strategy. The information is not tailored to the investment needs of any specific person and therefore does not involve a consideration of any of the investment objectives, financial situation or needs of any viewer that may receive it. Kindly also note that past performance is not a reliable indicator of future results. Actual results may differ materially from those anticipated in forward-looking or past performance statements. We assume no liability as to the accuracy or completeness of any of the information and/or content provided herein and the Company cannot be held responsible for any omission, mistake nor for any loss or damage including without limitation to any loss of profit which may arise from reliance on any information supplied by TFA Global Pte Ltd.
The speaker(s) is neither an employee, agent nor representative of Tradu and is therefore acting independently. The opinions given are their own, constitute general market commentary, and do not constitute the opinion or advice of Tradu or any form of personal or investment advice. Tradu neither endorses nor guarantees offerings of third-party speakers, nor is Tradu responsible for the content, veracity or opinions of third-party speakers, presenters or participants.

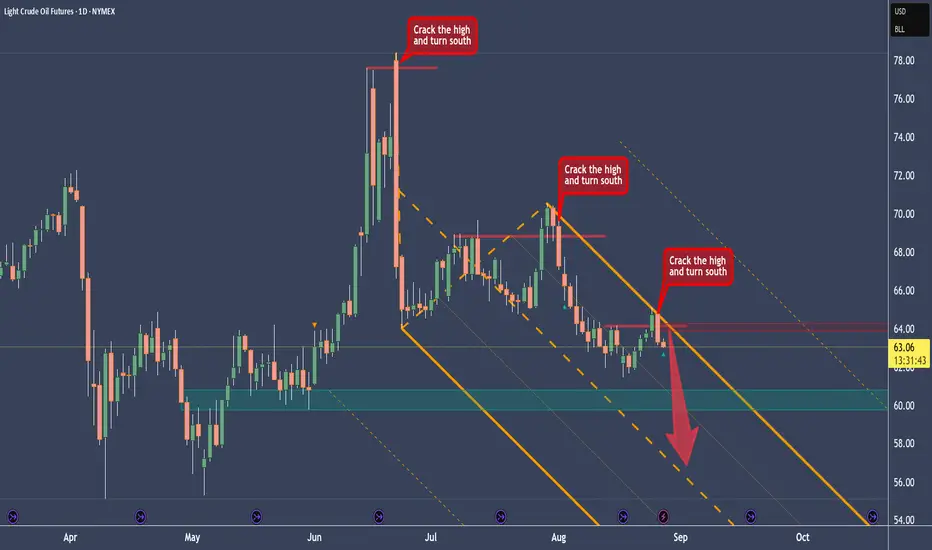
Crude Oil Short After Finding A Recurring BehaviorAfter I cleared the CL chart, I immediately saw a behavior that we can use for a setup right now.
You see that the highs got cracked, and then immediately price turns to the south. And since we are in a downtrend on Crude, we have a legit Short-Trade at hand.
With the modified Shiff-Fork you see how nice CL is reacting at the U-MLH, where it get's rejected. This level also coincides with the crack level.
I personally would love a pullback up to the crack-zone before shorting it. Maybe the trading Gods give us a gift on this Wednesday.
Talking about Wednesday: today we get the Crude Oil EIA numbers, which will probably move the markets.
However you plan is if you trade it, don't have FOMO. There are many more trades to come in your trading career.
Have a happy hump day §8-)
XTI/USD Analysis: Oil Price Falls 2.8% from This Week’s HighXTI/USD Chart Analysis: Oil Price Falls 2.8% from This Week’s High
As the XTI/USD chart shows, this morning (27 August) WTI crude oil is trading around the $63 level, although on Monday it climbed above $64.70. This means the price has retreated by approximately 2.8% from this week’s high.
The bearish momentum may be linked to the market’s reassessment of geopolitical risks. According to Reuters, US Special Representative Steve Witkoff stated that:
→ he will meet with a Ukrainian delegation in New York this week;
→ the US administration is also in talks with Russia, seeking to bring the war to an end.
He also noted that Washington is striving for de-escalation in the Middle East. We could assume that market participants are pricing in the possibility that these efforts could lead to the easing of sanctions and reduce risks and restrictions in global oil trade.
Technical Analysis of the XTI/USD Chart
On 19 August, we highlighted that:
→ the August downtrend remained intact, though it appeared to be weakening;
→ bulls might exploit this situation and attempt to launch an attack.
Indeed, since then the price rallied to a peak near $64.80, forming an upward trajectory shown by the orange lines. However, at the start of this week, momentum shifted back to the bears, as evidenced by a series of bearish signals on the chart:
→ Yesterday, bulls attempted to resume the upward trend from the lower orange boundary but failed – this was reflected in a candlestick with a long upper shadow, touching the $64 level before reversing downwards.
→ Bears then built on this success, pushing the price below $63.50 (where the lower orange line had been positioned).
→ This morning, WTI is trading close to weekly lows, highlighting the bulls’ inability to counter the pressure.
As a result, bears have driven the price back into the descending channel that has been in place since the start of the month. Given the above, we could assume that the market may continue to develop bearish dynamics within this downward channel – with WTI potentially heading towards the red median line.
The forthcoming oil inventory report (due today at 15:30 GMT+3) might have a significant influence on how the situation unfolds.
This article represents the opinion of the Companies operating under the FXOpen brand only. It is not to be construed as an offer, solicitation, or recommendation with respect to products and services provided by the Companies operating under the FXOpen brand, nor is it to be considered financial advice.

Market Analysis: WTI Crude Oil Faces HurdlesMarket Analysis: WTI Crude Oil Faces Hurdles
Crude oil is showing bearish signs and might decline below $62.80.
Important Takeaways for WTI Crude Oil Price Analysis Today
- Crude oil prices failed to clear the $65.00 region and started a fresh decline.
- There was a break below a major bullish trend line with support at $64.00 on the hourly chart of XTI/USD.
WTI Crude Oil Price Technical Analysis
On the hourly chart of WTI Crude Oil, the price struggled to clear the $65.00 level and started a fresh decline below $64.50.
There was a break below a major bullish trend line at $64.00, opening the doors for more losses. The price dipped below the 50% Fib retracement level of the upward move from the $61.56 swing low to the $64.85 high.
XTI/USD even dipped below $63.50 level and the 50-hour simple moving average. The bulls are now active near $63.00. If there is a fresh increase, it could face a barrier near $63.70.
The first major resistance is near $64.10. Any more gains might send the price toward $64.85 and call for a test of $65.50. Conversely, the price might continue to move down and revisit the $62.80 support and the 61.8% Fib retracement.
The next major support on the WTI crude oil chart is $62.35. If there is a downside break, the price might decline toward $61.55. Any more losses may perhaps open the doors for a move toward $60.50.
This article represents the opinion of the Companies operating under the FXOpen brand only. It is not to be construed as an offer, solicitation, or recommendation with respect to products and services provided by the Companies operating under the FXOpen brand, nor is it to be considered financial advice.

USOIL Bearish Reversal & Selling OpportunityUSOIL (WTI Crude Oil) – Bearish Setup Analysis
The chart shows a clear bearish structure with multiple confirmations:
Trendline Rejection & Break: Price rejected from the upper rejection line and later broke the rising trendline, confirming bearish momentum.
FVG (Fair Value Gap) Selling Zone: Price retested the imbalance zone (63.53–63.94), creating a strong selling opportunity.
EMA Confluence: Both the 70 EMA and 200 EMA are above the price, acting as dynamic resistance, supporting bearish bias.
Market Structure Shift (MSS): Breakdown of higher lows signals shift to bearish structure.
Target: Downside continuation expected towards 61.65, the next liquidity and support zone.
Stop Loss: Above 63.94 (selling zone invalidation).
📉 Strategy: Look for sell entries around 63.53–63.94 zone, with target at 61.65 and stop loss above 63.94.

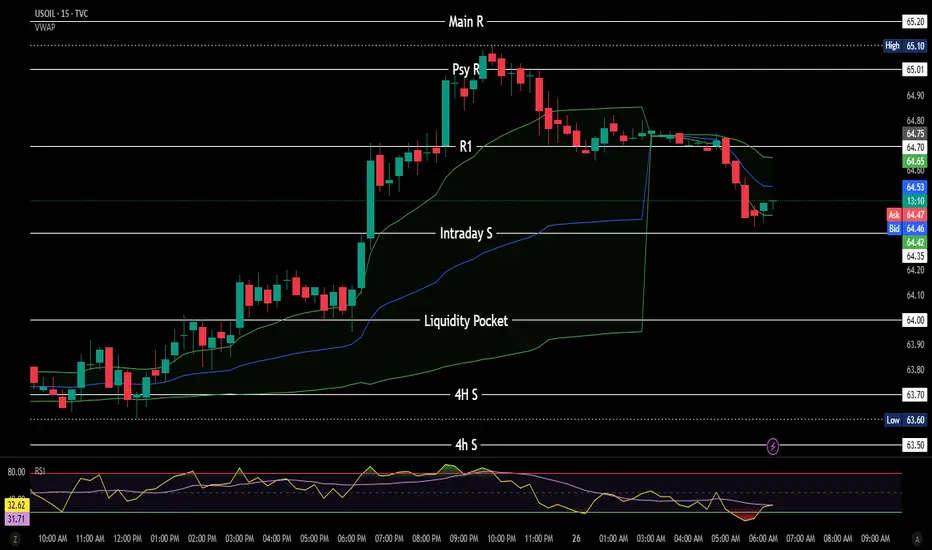
USOIL - OutlookAreas of interest marked on 4H.
If price drops to the discount zone, always wait for confirmation as it could go either way. (Momentum is our friend)
Avoid yellow zone.
Red zone speaks for itself, we do have EIA inventory data releasing later tonight. I would keep an eye on that for incoming volatility.
NFA

OUR TRADE ON OIL FOR TODAYToday we went long on OIL after that the market grabbed a liquidity and gave us our entry point to take.
The market went straight to our target which was again a liquidity level, then it came lower.
I couldn't share the trade today since when we entered I was in a live trading session with my students.
Follow for more!

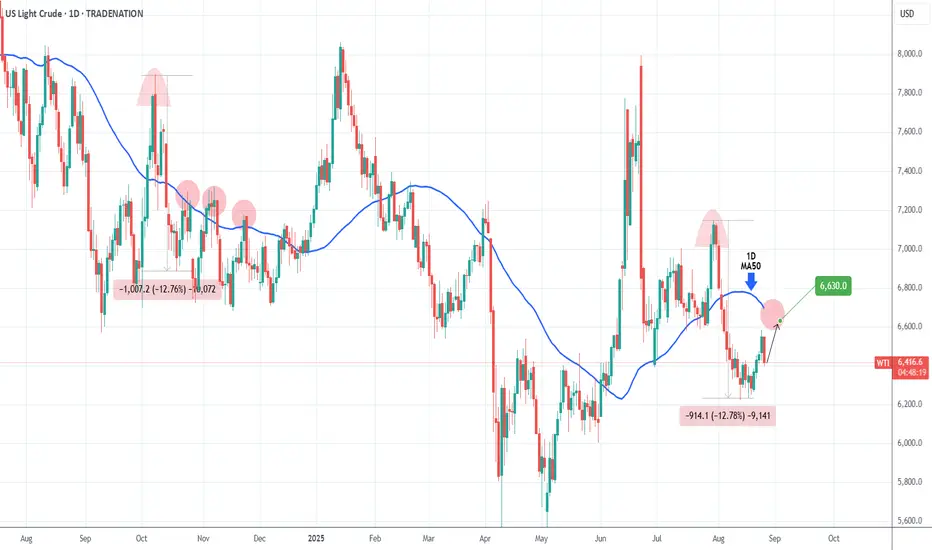
WTI OIL technically more chances to test the 1D MA50. Buy.Last week (August 20, see chart below) we issued a bullish break-out signal on WTI Oil (USOIL) that reached our $65.60 Target within 3 days:
This time we get a new buy signal, despite today's sharp pull-back. The -12.78% decline since the July 30 rejection, resembles the one since the October 08 2024 High.
This rebounded to just above the 1D MA50 (blue trend-line) to form a new Lower High and get rejected again.
As a result, our immediate short-term Target is $66.30.
-------------------------------------------------------------------------------
** Please LIKE 👍, FOLLOW ✅, SHARE 🙌 and COMMENT ✍ if you enjoy this idea! Also share your ideas and charts in the comments section below! This is best way to keep it relevant, support us, keep the content here free and allow the idea to reach as many people as possible. **
-------------------------------------------------------------------------------
Disclosure: I am part of Trade Nation's Influencer program and receive a monthly fee for using their TradingView charts in my analysis.
💸💸💸💸💸💸
👇 👇 👇 👇 👇 👇
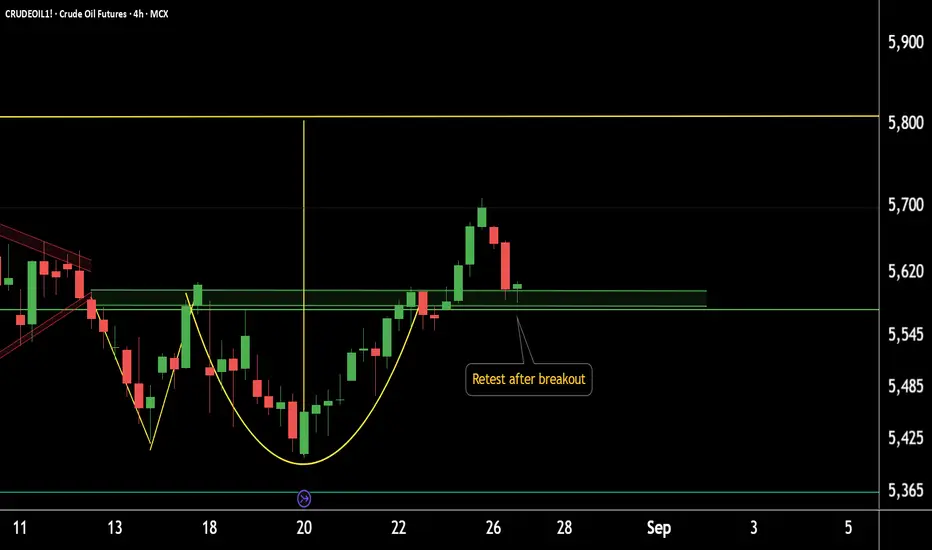
CRUDEOIL1! breakout + support confirmation=potential upside move4-Hour Chart Update: CRUDEOIL1!
CRUDEOIL1! has retested the breakout zone at 5580–5600.
If this level sustains, we may see higher prices ahead in CRUDEOIL1!.
Thank you!
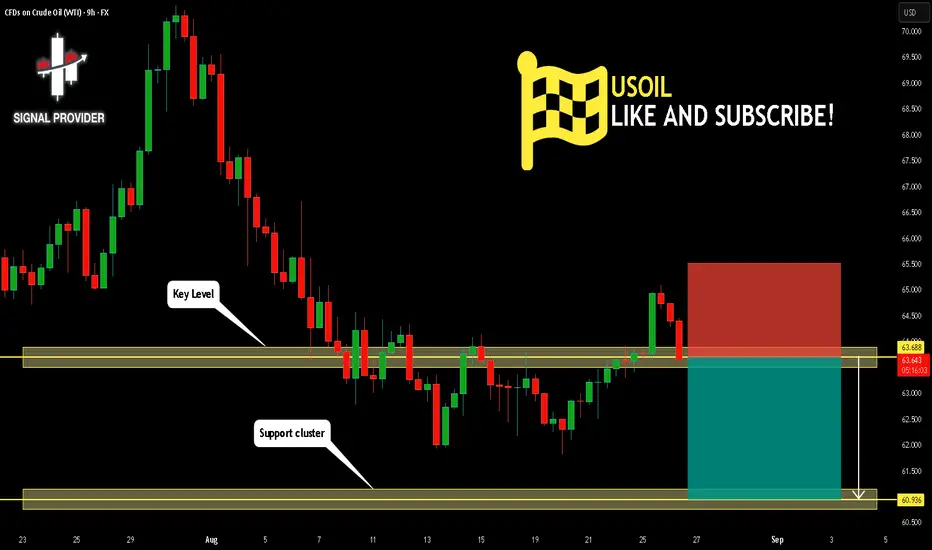
USOIL Is Bearish! Short!
Take a look at our analysis for USOIL.
Time Frame: 9h
Current Trend: Bearish
Sentiment: Overbought (based on 7-period RSI)
Forecast: Bearish
The price is testing a key resistance 63.688.
Taking into consideration the current market trend & overbought RSI, chances will be high to see a bearish movement to the downside at least to 60.936 level.
P.S
The term oversold refers to a condition where an asset has traded lower in price and has the potential for a price bounce.
Overbought refers to market scenarios where the instrument is traded considerably higher than its fair value. Overvaluation is caused by market sentiments when there is positive news.
Disclosure: I am part of Trade Nation's Influencer program and receive a monthly fee for using their TradingView charts in my analysis.
Like and subscribe and comment my ideas if you enjoy them!
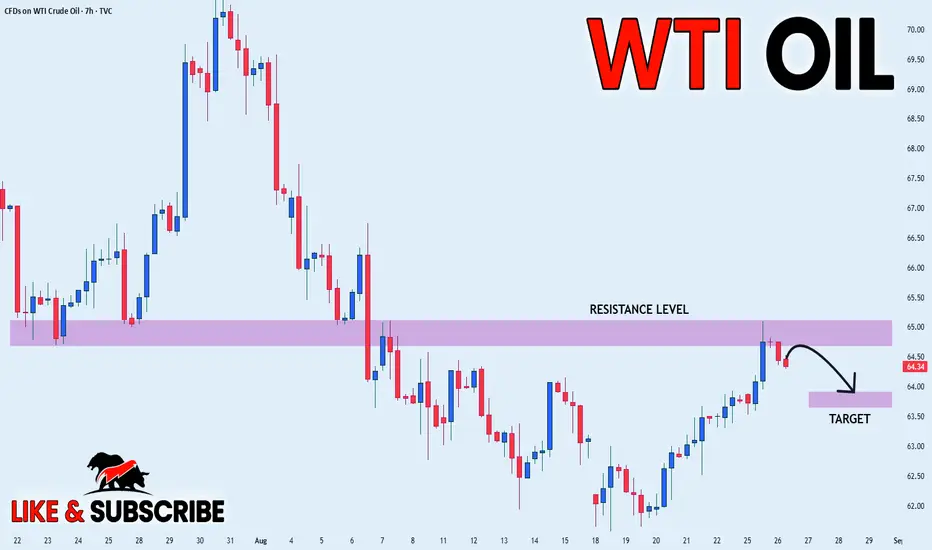
CRUDE OIL SHORT FROM RESISTANCE|
✅CRUDE OIL has retested a key resistance level of 65.10$
And as the price is already making a bearish pullback
A move down to retest the demand level below at 63.85$ is likely
SHORT🔥
✅Like and subscribe to never miss a new idea!✅
WTI Edges Up On Big EIA Draw, Risk-on ToneFundamental approach:
- Last week, USOIL was modestly higher amid risk-on sentiment and tighter supply signals after a larger‑than‑expected US crude draw.
- Support came from the EIA’s reported six-million-barrel crude draw tied to lower imports and stronger exports, reinforcing a tightening balance even as Cushing stocks ticked up; broader sentiment also leaned on expectations of looser Fed policy aiding demand.
- Gains were tempered by mixed macro cues, fading Eastern Europe risk headlines, choppy dollar moves, and cautious positioning ahead of the next API/EIA prints.
- However, China's Sinopec last week reported a sharp profit drop, citing weak fuel consumption. The trend of subdued fuel demand is likely to continue as factors including lower consumer confidence, rising electric-vehicle adoption and improved fuel efficiency are reducing petroleum demand in China.
- Into late week, USOIL could firm if US inventories show continued draws and risk tone improves, while any surprise builds or de‑escalation of supply risks may cap rallies; follow‑through from Fed‑cut pricing and geopolitics could potentially steer near‑term direction.
Technical approach:
- USOIL found support quickly after closing below the key level at 63.90. The price is retesting both EMAs and closed above the key level at 63.90, signaling a make-or-break situation. The market awaits a clear breakout to determine the short-term movement.
- If USOIL closes above both EMAs and breaks the descending trendline, the price may continue to advance to retest the following resistance at 67.50.
- On the contrary, closing below the support at 63.90 may prompt a further weakness to retest the next support at 60.00.
PS: I shared a piece of the above ideas on The Wall Street Journal: www.wsj.com
Analysis by: Dat Tong, Senior Financial Markets Strategist at Exness

TRADE WENT SIDEWAYSIn the trade I posted today, the price managed to take the LQ, fill the Buyside FVG and keep climbing higher.
Small loss which will be recovered in the following days!
Follow for more!
SELL USOILOur trade today on OIL is going to be a short one,
We entered after that the market swept the LQ and gave us a reversal as a confirmation.
Follow for more!

WTI Crude Awaits Breakout Amid Sanction RisksWTI Crude Oil – Overview
Oil Holds Steady on Fed Cut Bets and Sanction Risks
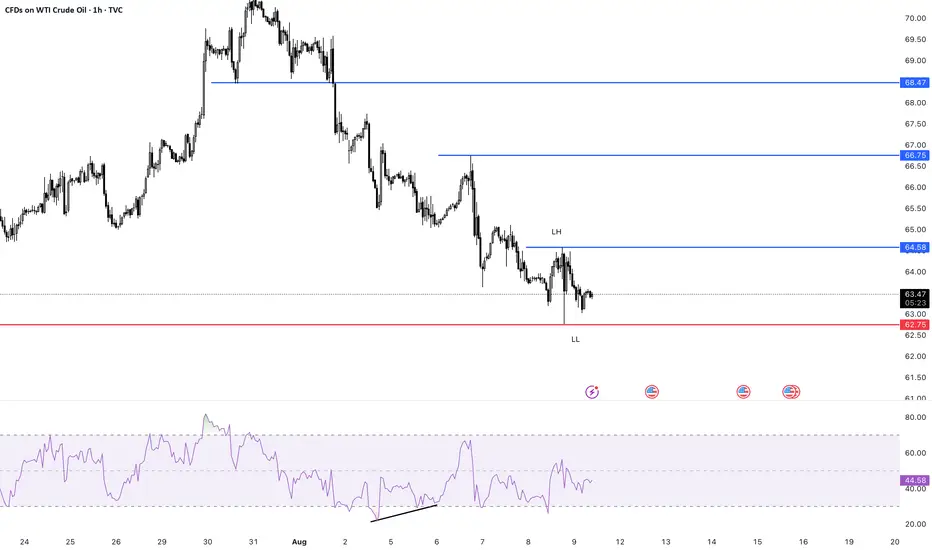
Oil prices are flat in early trade as markets weigh the likelihood of a U.S. Fed rate cut in September against potential disruptions to Russian crude flows. Brent trades at $67.18 (-0.1%), while WTI is steady at $63.64, following a 2.5% gain last week.
Fading optimism over a Russia–Ukraine summit and renewed U.S. tariff threats against India add to volatility. Markets are closely watching the Aug. 27 deadline, when secondary U.S. tariffs against India for Russian oil purchases are expected to take effect.
🔹 Technical Outlook
WTI is trading in bullish momentum as long as it holds above 63.47.
Price is likely to consolidate between 63.47 – 64.72 until a breakout.
✅ Above 64.72: Bullish continuation toward 65.83 → 67.20.
⚠️ Below 63.47: Bias turns bearish, targeting 61.83.
🔹 Key Levels
Support: 63.47 – 61.83
Resistance: 64.72 – 65.83 – 67.20
✅ Summary:
WTI crude remains range-bound but biased to the upside, supported by Fed cut expectations and geopolitical risks. A decisive break from the 63.47–64.72 range will set the next trend direction.

WTI Steadies as Rate-Cut Bets and Supply Risks CollideWTI Steadies as Rate-Cut Bets and Supply Risks Collide
WTI crude hovered around $64 on August 25, steady after last week’s gains as traders balanced U.S. rate-cut expectations with geopolitical risks. The Fed is seen 85% likely to cut rates in September, boosting demand outlooks.
Supply concerns persist after Washington threatened 50% tariffs on Indian imports over Russian oil purchases, while India signaled it will keep buying from Moscow. Stalled Russia-Ukraine talks and renewed attacks on energy infrastructure add to uncertainty.

WTI Bull setupSwing trade
Bull points
- RSI div
- Wait for trend reversal
Put Buy stop on last Lower High or wait for HH and HL or reversal
RRR 1:1
Go for 1:2 manage your risk first...