$DFLI is back on its original launch pad. What happens next?The last time NASDAQ:DFLI broke the top of the current range from the underside, with technicals following positively, the path of least resistance was straight up.
I believe there is a chance this occurs again. With the price absorbing energy and accumulation within a very tight current range almost identical to its previous base, I think this is a great area to work long from.
The market has absorbed a lot of news from NASDAQ:DFLI since last September. Now that the stock is back on its launch pad, it may attract institutional commitment.
This is also coinciding with a perfect Elliot Wave cycle completion, allowing for a new cycle to begin.
GL!
Value

Constellation Brands | STZ | Long at $134.50Constellation Brands NYSE:STZ
Technical Analysis:
Currently trading just below my "crash" simple moving average area. This area is often a bottom, even if temporary (sometimes there is a continuous stairstep down, though). There is a high probability the stock could drop down to the "major crash" zone ($120 and below) in the near-term, but all price gaps on the daily chart since 2020 that were open below the current price are now closed (bullish).
Earnings and Revenue Growth
Projected earnings increase from 2025 ($11.6 billion) to 2028 ($15.4 billion): +38.2%
Projected revenue increased from 2025 ($9.1 billion) to 2028 ($9.8 billion): +8.3%
www.tradingview.com
Health
Debt-to-Equity: 1.6x (high)
Altman's Z-Score/Bankruptcy Risk: 3.1 (excellent/very low risk)
Insiders
Warning: Selling outweighs buying.
openinsider.com
Action
Constellation Brands hold a number of major names in the alcohol industry. While sales have slumped and revenue growth is weak, it's a solid company paying a +3% dividend. I do not expect this to skyrocket any time soon, so those into overnight returns may want to pass. The decision to enter is primarily based on technical analysis and name-brand recognition. I am also going to keep my target low for a swing trade due to the unknown economic times ahead.
Targets in 2028
$158.00 (+17.5%)
$178.00 (+32.3%)

Gelaxy IG: Why Stablecoins Lost StabilityIn the cryptocurrency world, stablecoins have long been viewed as a safe haven — digital assets pegged to the US dollar, promising a near-perfect price of $1 with virtually no fluctuations. They are used for hedging volatility, fast transfers, margin trading, and as an entry/exit point in DeFi. However, in recent years — especially throughout 2025 — we have increasingly seen even the largest stablecoins deviate from their peg, sometimes for hours and sometimes for days. For traders, this is no longer a rare anomaly but a systemic risk that must be factored into any strategy. Let’s break down why this is happening and how to adapt.
Liquidity Issues During Panic Moments
The most common reason for deviations is a sharp imbalance between supply and demand during periods of market stress. When Bitcoin and altcoins drop sharply, traders and investors rush to exit into “dollars” — meaning stablecoins. But if exchanges lack enough buyers at $1, or if the issuer cannot quickly provide liquidity for fiat withdrawals, the stablecoin’s price begins to fall below the peg.
During such periods, spreads on exchanges widen dramatically, and on decentralized platforms massive slippage occurs. This creates a cascading effect: position liquidations, margin calls, panic selling — and the price can drop 5–35% below $1 in just hours.
Dependence on Reserves and Market Trust
Fiat-backed stablecoins (USDT, USDC, BUSD, and others) hold reserves in banks, Treasury bonds, commercial paper, and other assets. As soon as doubts arise about whether these reserves are real, accessible, or sufficient, trust collapses — and outflows begin.
It only takes one major negative event — a banking crisis, regulatory pressure, asset freezes, or even a viral rumor on social media — for the price to fall. Decentralized and algorithmic models are even more vulnerable: they rely on arbitrage and over-collateralization mechanisms that break down during panic.
Price Deviations Among Major Stablecoins
In 2025 we witnessed several notable cases:
USDT repeatedly dropped below $0.95–0.97 amid global sell-offs and capital outflows from Asian markets.
USDC showed short-term deviations to $0.98–0.99 during banking news and regulatory noise.
Certain DeFi-oriented stablecoins (including algorithmic and hybrid models) lost 10–35% from their peg, triggering millions of dollars in liquidations across protocols.
These events are no longer seen as exceptions — they have become part of the market cycle.
Risks of Centralized vs. Algorithmic Models
Centralized stablecoins (USDT, USDC, etc.) depend on the issuer:
regulatory risks (account freezes, sanctions, audit demands),
banking risks (reserve freezes, as seen in the past),
operational risks (hacks, errors).
Algorithmic and hybrid models are vulnerable to:
“death spirals”,
lack of arbitrageurs during stress,
smart-contract exploits,
oracle manipulations.
In both cases, systemic risk remains: a depeg of one major stablecoin can trigger a chain reaction across the entire market.
How to Use Stablecoins Correctly in Trading
To minimize damage, a modern trader should:
Diversify — never keep all funds in a single stablecoin. A popular combination: 50–70% USDT/USDC + 20–30% in decentralized options + a small portion in fiat.
Monitor in real time — track prices across different exchanges (CEX + DEX), volumes, spreads, and issuer-related news.
Use limit orders — avoid market orders when converting during high volatility.
Have an exit plan — define in advance the levels at which you move from stablecoins to fiat or other assets.
Avoid excessive leverage — using stablecoins as collateral with high leverage can lead to rapid liquidation during a depeg.
Conclusion
Stablecoins are a convenient and powerful tool, but they are far from a guarantee of absolute stability. In 2025–2026, depegs have become a regular occurrence, especially during periods of market stress. Understanding their mechanics, risks, and limitations has turned into an essential skill for any serious trader.
Gelaxy IG reminds you: stability is not a property of the asset — it is the result of your strategy and level of preparation. Trade consciously.
Gelaxy IG — your partner in understanding modern crypto markets.

RippleX Develops Zero Knowledge Proofs for Privacy on XRPLRipple is working on a big upgrade for the XRP Ledger. Its developer team RippleX is building zero knowledge proofs also called ZK-proofs. The goal is simple: make XRPL more private, more secure and more powerful for real world use.
This is not just an idea on paper. RippleX says this work is already in the research and testing stage. In Ripple’s Onchain Economy video series, Aanchal Malhotra, Head of Research at RippleX, said ZK-proofs are now a top priority for the team. In short, Ripple wants XRPL to stay fast and cheap. But also become smarter and more private.
What Are Zero Knowledge Proofs?
Zero knowledge proofs let you prove something is true without sharing the actual data. Think of it like this. You want to prove you are over 18. Instead of showing your full ID, a ZK-proof can confirm your age without revealing your birthday or name. In crypto, this means users and businesses can prove things like balances, payments or rules without exposing private details. This gives privacy without breaking trust.
What RippleX Is Actually Building
XRPL was created long before ZK technology became popular. So RippleX is not just adding a plugin. They are designing a custom system that fits XRPL’s structure. Their plan uses a hybrid model. Some ZK features will be built directly into XRPL for speed and safety. Other ZK tools will live in a programmable layer so developers can choose what works best for their apps. This gives flexibility. One app may need strong privacy. Another may need fast verification. RippleX wants both to work smoothly.
Why This Upgrade Is Important
First, it brings real privacy. Not hidden activity, but smart privacy. Businesses can share only what is needed with banks, auditors or regulators. The rest stays private. Second, it improves cross-chain security. Today, many crypto bridges rely on trusted middlemen. ZK-proofs replace trust with math. The system checks proofs instead of trusting people. Third, it helps scaling. Heavy work can run on Layer-2 networks. These systems send small proofs back to XRPL. XRPL stays fast and simple, while apps become more powerful.
The Big Picture for XRPL
RippleX is moving ZK-proofs from research into real testing. The plan is to give XRPL:
Better privacy for users and businesses
Safer cross-chain transfers
A path for advanced apps without slowing the network
XRPL will stay focused on what it does best fast settlement and low fees. But now it can also support modern Web3 apps, private finance and secure global payments. This is how Ripple wants to build the next version of the on-chain economy. Simple, fast and finally private. Privacy is no longer a bonus feature. It is becoming a core part of blockchain and RippleX is making sure XRPL is ready for that future.

GMR Power — Extended Wave-3, Contracting Wave-4… Resolution📉 GMR Power & Urban Infra — Weekly Context and Daily Wave-4 / Wave-5 Structure (Elliott Study)
This publication presents an educational Elliott Wave structure study 📚 using the Weekly timeframe for the overall market context and the Daily timeframe to analyse the ongoing Wave-4 correction , its probable termination area, and the conditional Wave-5 projection .
On the Weekly chart , GMR Power shows a clear impulsive advance from the 2023 base into the ₹169.25 region , labelled as Wave-(3) . Fibonacci extension analysis shows that this move exceeded the 3.618 extension and approached the 4.0 level , confirming that Wave-3 is the extended wave . After this peak, price behaviour shifted from strong trending action to overlapping and corrective movement , signalling the development of Wave-(4) .
On the Daily chart , Wave-(4) is unfolding as a contracting triangle (A–B–C–D–E) 🔺. Each leg is corrective and overlapping, volatility has contracted, and momentum has faded. This behaviour is typical of a Wave-4 triangle following an extended Wave-3 , where the market corrects more through time than price ⏳.
From a structural and Fibonacci perspective 📐, the Wave-E termination zone is identified between approximately ₹85–95 . This region aligns with the 0.618–0.786 retracement band of the prior advance. In Elliott Wave studies, Wave-E of a triangle often resolves quietly and may not show a dramatic breakdown, which matches the current behaviour.
Because Wave-3 is extended , Elliott alternation principles suggest that Wave-5 is more likely to be contracted rather than extended . Therefore, Wave-5 expectations are best framed using triangle thrust measurement and reduced Fibonacci relationships to Wave-1 , rather than equality or extension relative to Wave-3.
Using these methods, the primary Wave-5 reference zone lies in the ₹120–140 region . A move toward the ₹160–170 area would be considered a lower-probability stretch scenario and would require clear impulsive behaviour and momentum expansion. A truncated Wave-5 remains possible but is not the base expectation.
This study focuses on structure, probability, and wave behaviour 🧠 rather than prediction. Discussion of Wave-5 becomes relevant only after the triangle completes and price clearly transitions from corrective overlap to impulsive movement .
This publication is shared strictly for educational and analytical discussion 📚⚠️ and does not constitute investment advice.

January Effect: Mid and Small-Cap Stocks Outperform Mega-CapsIn the first half of the first month of the year the market is clearly dominated by mid and small-cap stocks (which carry more influence in equal-weighted index than in the cap-weighted).
They are outperforming mega-caps by 1.94%.
This could be a sign of the January Effect where small stocks tend to outperform early in the year.

NewtekOne | NEWT | Long at $10.92NewtekOne NASDAQ:NEWT is a financial holding company providing business and financial solutions to small- and medium-sized businesses across the U.S. Services include Newtek Bank, business lending, SBA loans, electronic payment processing, payroll and benefits, insurance, and technology solutions. While the stock has taken a major hit recently, insiders have scooped up over $1 million in shares with an average price of $11.70. Currently trading at a P/E of 5.6x, forward P/E of 6.6x, and near book value, the stock may be poised for a move up soon with the anticipation of interest rates dropping. Revenue is up 24.93% from $271.15M (2023) to $338.73M (2024) and earnings are forecast to grow 11.63% per year, but the company does have a high debt-to-equity ratio (over 5x).
Tariffs could indirectly impact NASDAQ:NEWT by increasing costs for its small- and medium-sized business clients, particularly in industries reliant on imports (e.g., manufacturing, retail). Higher costs may reduce client profitability, increasing loan default risks or reducing demand for Newtek’s lending and payment processing services. But an interest rate reversal may greatly limit the impact (longer-term).
So, at $10.92, NASDAQ:NEWT is in a personal buy zone.
Targets into 2027:
$12.00 (+9.9%)
$14.00 (+28.2%)

ASTS 4H: space internet or orbital dream?AST SpaceMobile (ASTS) is consolidating above the $61–69 zone, right near the 0.618 Fibonacci level of its last major rally. On the 4H chart, momentum shows early reversal signs: falling volume on pullbacks, stochastic turning up, and buyers defending local lows. The bullish setup holds as long as price stays above $61, with upside targets at $100 and $135 where the extension projection aligns.
Fundamentally , as of November 2025, ASTS stands out as one of the most promising yet capital-intensive players in the satellite telecom industry. The company completed deployment of its BlueWalker test constellation and is preparing for commercial rollout of direct-to-cell satellite connectivity. Successful phone-to-satellite calls using standard smartphones - validated with AT&T and Vodafone - mark a true technological milestone, positioning ASTS as a potential first-mover in global space-based mobile internet.
Revenue for the first nine months of 2025 reached roughly $55M, almost double last year’s level, but operating losses still exceed $300M due to high manufacturing and launch costs. The company holds about $180M in cash versus ~$260M in debt, continuing to rely on strategic partnerships and funding programs to maintain liquidity. The key upcoming catalyst is the commercial network activation in 2026 in cooperation with AT&T, Vodafone, and Rakuten, which could dramatically change valuation if successful.
With investor attention shifting back to space communications, competition with Starlink and Lynk Global is heating up, but ASTS’s advantage lies in using standard smartphones without extra hardware. Risks remain - high capital needs, launch delays, and dependency on partner timelines - yet the reward potential is extraordinary if execution holds.
Tactically, staying above $61 keeps the bullish structure alive with $100 and $135 as primary targets. A breakdown below $60 would negate the setup.
They’ve already connected phones to space - now let’s see if they can connect revenue to profit.

Gold and Silver Rally as Bitcoin Trades Far Below Its PeakA recent post from Crypto Rover draws attention to a growing divergence across major asset classes. Gold and silver have both pushed to new all-time highs, while Bitcoin remains well below its previous peak. Gold is trading above $4,500 per ounce and silver near $84 per ounce, reflecting strong demand for traditional safe-haven assets. Bitcoin, by contrast, sits around $90,000, roughly 28% below its October 2025 high near $126,000. The comparison fuels renewed discussion around Bitcoin’s role as “digital gold.”
Why Precious Metals Are Surging Right Now
The rally in gold and silver is largely driven by macro uncertainty rather than speculative momentum. Rising geopolitical tensions and persistent global instability have increased demand for assets viewed as reliable stores of value. Investors tend to rotate into precious metals during periods of elevated risk because they are less sensitive to equity market volatility. Expectations around looser monetary policy and concerns about currency debasement have further supported metals prices. As a result, capital has flowed steadily into gold and silver markets.
Bitcoin’s Lag Reflects Risk Asset Behavior
Bitcoin’s underperformance highlights its continued sensitivity to broader risk sentiment. While often compared to gold, Bitcoin has behaved more like a high-beta asset during recent market stress. Its correlation with technology stocks and risk assets has limited its upside while traditional safe havens rally. This dynamic has become more visible as investors reduce exposure to volatile assets and prioritize capital preservation. In the short term, this positions Bitcoin differently from gold and silver despite similar long-term narratives.
How Markets and Traders May Interpret the Divergence
Market participants are split on how to read this divergence. Some traders view Bitcoin’s lag as a sign of temporary undervaluation relative to precious metals. Others see it as a reminder that Bitcoin has not fully decoupled from risk markets. Historically, similar gaps have occurred during periods of macro stress, sometimes followed by strong Bitcoin recoveries once conditions stabilized. However, these patterns remain contextual rather than predictive. Short-term sentiment remains cautious rather than decisively bullish.
Historical Context From Previous Market Cycles
Looking back, periods where gold outperformed Bitcoin have often aligned with heightened macro fear. During those phases, capital favored stability before rotating back into growth-oriented assets. In past cycles, Bitcoin eventually outpaced metals once liquidity improved and risk appetite returned. Still, those transitions took time and depended heavily on macro conditions. The current environment shares similarities but also includes unique factors such as greater institutional participation and more complex cross-asset correlations.
What to Watch Going Forward
Going ahead, the key variables will be geopolitical risk, monetary policy expectations, and broader market volatility. A decline in global tensions or improved confidence in growth assets could support a Bitcoin catch-up move. On the other hand, sustained uncertainty may continue to favor gold and silver. This divergence matters beyond short-term price action because it highlights how different assets respond to stress. It also reinforces that Bitcoin’s digital gold narrative remains a long-term thesis, not a guaranteed short-term outcome.

Alight | ALIT | Long at $1.68Alight NYSE:ALIT is a cloud-based human capital technology provider that specializes in helping large organizations manage employee benefits, health, wealth, wellbeing, and related HR functions. It uses AI, data analytics, and personalized insights to improve employee experiences, boost engagement, and drive better outcomes for both employers and workers.
Technical Analysis:
The stock price entered, for the second time, my historical "crash" simple moving average zone. This area (green lines) is often a key location for share accumulation during algorithmic trading. While the lowest band is currently near $1.30 and trending lower (i.e. this is likely not officially bottom), it's a key zone for traders to consider entry for a potential bounce while leaving the emotions and guesswork at the door. But nothing is for certain in the stock market.
Insiders:
Significant buying and no selling through 2025: openinsider.com
Growth:
Modest rise in earnings per share and revenue expected between 2026 and 2028: tradingview.com
Health:
Debt-to-equity: 1x (just okay)
Quick ratio / ability to pay today's bills: 1.2 (just okay)
Altman's Z score / bankruptcy risk: 0.1 (high...)
Fair value: $8.00
Action:
While the price is at risk for heading into the low $1 range, I believe it is currently oversold based on the estimated fair value ($8), insider buying, and technical analysis. It's a risky play based on the financials and changing workforce, but it's a gamble that caught my attention. Thus, at $1.68, NYSE:ALIT is in a personal buy zone /starter position with potential for further declines near $1 - $1.30 in the near-term. Time will tell.
Targets into 2029
$2.00 (+19.0%)
$3.00 (+78.6%)

Parabolic Moves Don’t Always End in Collapse — Silver ExplainedI’ve seen many analyses from my colleagues where 1980 and 2011 are used not as upside projections, but as collapse templates for silver.
The argument is simple and visually convincing: silver has already gone parabolic, therefore the next chapter must be a collapse similar to those historical episodes.
I understand the logic.
I don’t predict the future, and I can’t categorically deny that such an outcome is possible.
But here’s where I draw a clear line: similar-looking charts do not guarantee similar outcomes, especially when the underlying drivers are fundamentally different.
And in silver’s case, they are different.
Let’s be precise about what 1980 really was (and why it collapsed)
The 1980 silver collapse is often treated as a “natural law of parabolic moves”.
In reality, it was not a natural market outcome.
It was the direct consequence of extreme concentration and leverage, driven by the Hunt brothers.
What made 1980 fragile by design
- The Hunts accumulated an extraordinary share of the global silver supply, both physical and paper.
- They used massive leverage in a relatively small and illiquid market.
- The price did not rise because global demand structurally changed — it rose because supply was artificially constrained.
- Once exchanges changed the rules (margin hikes, liquidation-only trading), the entire structure collapsed under its own weight.
This is critical:
The collapse of 1980 was not caused by silver being “too expensive”.
It was caused by the system forcibly unwinding a concentrated position.
So when someone says “this looks like 1980”, the real question is:
- Where is today’s equivalent of that concentration?
- Who controls 30–40% of deliverable supply?
- What single entity is forced to liquidate?
If that element is missing, then the collapse logic weakens dramatically.
2011: parabolic, yes — structurally unstable, also yes
2011 is a more honest comparison, and this is where many collapse arguments focus.
Silver:
- rallied aggressively,
- became a retail darling,
- and eventually collapsed hard.
But again, the reason it collapsed matters.
Why 2011 unraveled
- The rally was dominated by financial demand, not structural necessity.
- ETFs, leverage, and macro fear created fast money flows.
- When liquidity tightened and risk appetite faded, demand evaporated quickly.
- There was no structural constraint on supply forcing price stability.
In other words:
- 2011 collapsed because demand was reversible.
- Once sentiment flipped, there was nothing underneath to slow the fall.
Now comes the disagreement: why I don’t expect a 1980/2011-style collapse this time
Yes — I fully agree on one thing: extreme volatility is coming, or is already here (yes, more extreme than we've seen!)
Silver doesn’t trend quietly. It never has.
But volatility and collapse are not the same thing.
The key difference today: the type of demand
Today’s silver market is not driven solely by:
- fear,
- speculation,
- or monetary narratives.
A large and growing portion of demand is industrial and strategic:
- electrification,
- energy transition,
- technology infrastructure.
That demand:
- doesn’t disappear overnight,
- doesn’t panic-sell because RSI is overbought,
- and doesn’t care about chart symmetry.
This changes the downside dynamics.
Supply cannot respond the way people assume
Another overlooked point:
- most silver production is a by-product of other metals.
- higher prices do not instantly bring new supply online.
In 1980 and 2011, supply dynamics were not a binding constraint.
Today, they are.
That doesn’t mean price can’t drop — it means drops are more likely to be violent corrections, not structural collapses.
About the “parabolic = must collapse” logic
This is where I respectfully disagree with many analysts.
A parabolic move tells you:
- volatility is increasing,
- positioning is crowded,
- risk management becomes essential.
It does not automatically tell you:
- the entire move must fully retrace,
- or that price discovery was fake.
Markets can:
- correct through time instead of price,
- form wide ranges,
- or retrace partially and rebase.
History offers multiple outcomes, not a single script.
My base case (clear and unemotional)
- Yes, I expect extreme swings.
- Yes, I expect sharp pullbacks that will scare most participants.
- No, I do not see a clear mechanism today for a 1980-style forced collapse.
- And unlike 2011, I don’t believe demand disappears just because momentum cools.
This is not optimism.
It’s structure-based reasoning.
Trading perspective (grounded)
Because I expect volatility:
- I don’t chase vertical candles.
- I respect levels, not narratives.
- I scale, I take partial profits, and I allow room for noise.
- I treat silver as a dangerous instrument, not a lottery ticket.
Being right about direction is useless if volatility kicks you out first.
Final thought
My colleagues may be right — markets can always surprise.
But assuming collapse just because the chart looks familiar is lazy analysis.
1980 collapsed because of forced concentration unwind.
2011 collapsed because of reversible financial demand.
Today, silver is volatile — not hollow.
And that distinction matters more than any historical overlay.
The market will decide.
My job is to respect risk, not marry analogies 🚀
Best of luck!
Mihai Iacob

Cosmos Health | COSM | Long at $0.54***Very Risky OTC play***
Cosmos Health NASDAQ:COSM is a pharmaceutical and healthcare company focused on developing, manufacturing, and distributing prescription drugs, OTC medicines, nutraceuticals and medical devices. Share price has been diluted in the past, but the CEO is grabbing shares at an unprecedented rate ( average around $0.49 for a commitment of $2.2+ million ). Doing a little research, two primary catalysts that may move the share price soon are:
Recent Manufacturing Agreement for PathMuscle : Just days before the latest buys, on approximately January 5, 2026, NASDAQ:COSM announced a five-year deal with Greek pharmaceutical distributor Libytec Pharmaceutical S.A. for its subsidiary Cana Laboratories to handle end-to-end manufacturing (including formulation, production, quality control, and packaging) of PathMuscle, a muscle-related medicine. The agreement projects volumes exceeding 1.2 million units, with a minimum of 591,500 units in the first two years alone. This contract is expected to boost revenue through expanded production capacity and could contribute to stock price recovery, with shares rising on the news.
Upcoming Product Launch : A new product (potentially tied to recent FDA-related announcements or manufacturing expansions) is slated for release in Q1 or Q2 2026, which could serve as a near-term catalyst for growth in the pharmaceutical and nutraceutical segments.
So, I've rolled the dice and jumped in near $0.54, following the insider buying and potential catalyst growth.
Targets into 2028
$0.75 (+38.9%)
$1.00 (+85.2%)

United Postal Service | UPS | Long at $92.00The United Postal Service NYSE:UPS finally closed out the last remaining price gap on the daily chart (since 2020) and entered my "crash" simple moving average zone. With a P/E of 15x, earnings forecast growth of 8.12% per year, and a dividend over 6%, NYSE:UPS "may" be a good buy and hold through these tumultuous economic/trade war times. I wouldn't place a continued price drop near $75-$85 out of the question, but I'm not in the game of calling bottoms.
At $92.00, NYSE:UPS is in a personal buy zone. Word of caution: if this stock really tanks due to trade issues and massive recession, $50s...
Targets:
$108.00
$120.00
$133.00

Fancamp Exploration – Asset-Backed Spin-Out SetupFancamp has announced a strategic spin-out of all its core exploration assets into a new company, Goldera Exploration Ltd. Existing FNC shareholders will receive Goldera shares pro-rata, with no change to their Fancamp holdings.
The transaction will be completed via a court-approved plan of arrangement and is targeted for Spring 2026. No record date has been announced yet, meaning the spin-out window remains open pending the Information Circular.
Post spin-out, Fancamp becomes a cash-flow and royalty vehicle, holding:
>$20M in marketable securities (dividend-generating)
$34.5M secured note in Ontario’s Ring of Fire (~$2M annual interest)
A diversified royalty portfolio, including up to $40M in future production payments and titanium exposure
At current levels, cash and securities alone approach the company’s market cap, leaving the secured note, royalties, Ring of Fire leverage, and spin-out optionality largely unpriced.
This is not a typical junior explorer trade, but a balance-sheet-backed asymmetric setup with a clearly defined corporate catalyst ahead.
Not investment advice. Do your own due diligence.

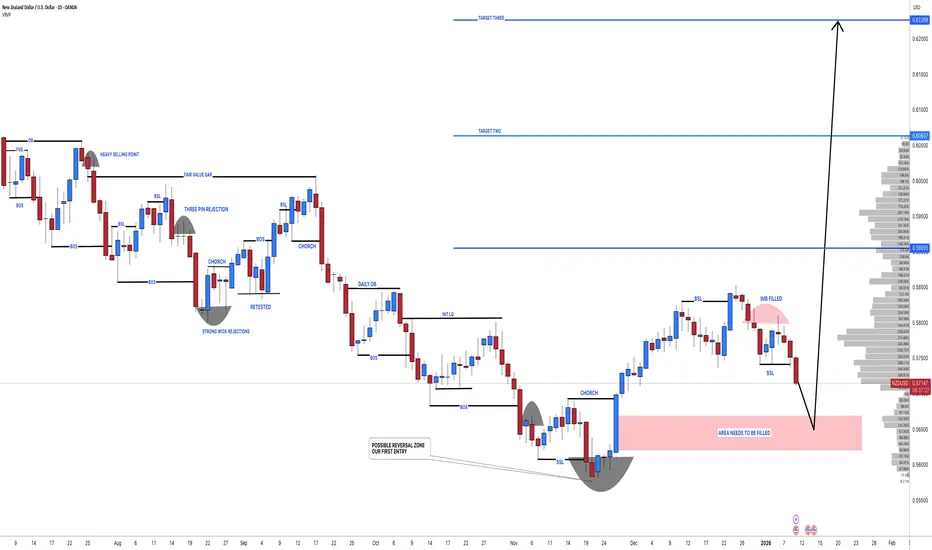
NZDUSD: Latest Chart Analysis 07/01/2026 🔺As per our previous analysis, the price was expected to maintain a bullish trend until all our targets were met. However, we have observed a shift in price behavior, and the price has now reversed, initiating a bearish trend. This presents a favorable opportunity for us, as the price decline is attributed to a previously unaddressed liquidity void.
🔺The entry zone has been clearly indicated by a red box labeled "area needs to be filled." Given the current strong bearish momentum, our entry is anticipated to become active by Monday. Once the entry is activated, the stop loss can be positioned below the designated entry zone.
🔺We have identified three target points that we believe are likely to be achieved within the next couple of months. Kindly utilize this analysis for educational purposes exclusively, and we recommend setting your take-profit levels based on your own informed judgment.
🔺If you appreciate our efforts, please consider liking and commenting for more analyses of these type.
Team SetupsFX❤️🏆
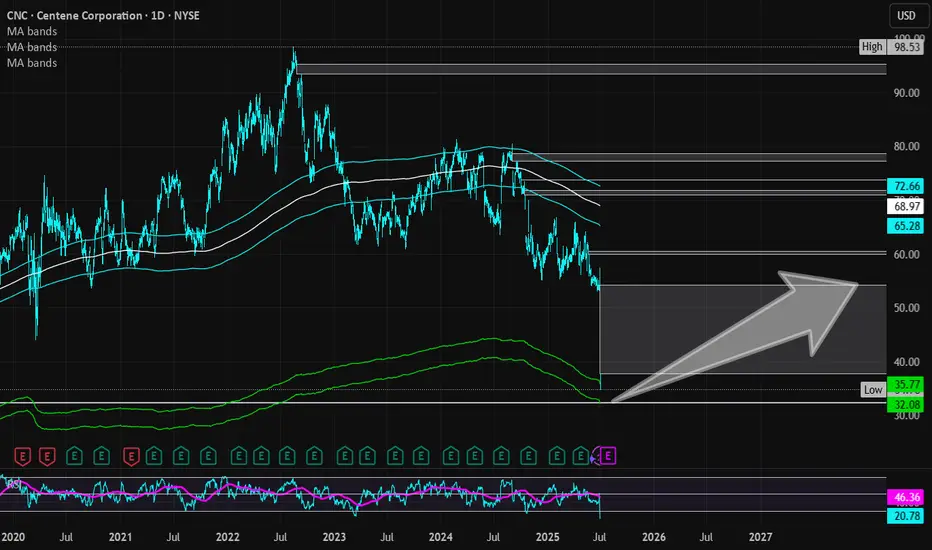
Centene Corp | CNC | Long at $35.00Centene Corp NYSE:CNC is a healthcare enterprise providing programs and services to under-insured and uninsured families, commercial organizations, and military families in the U.S. through Medicaid, Medicare, Commercial, and other segments. The stock dropped almost 40% this morning due to recent challenges, such as a $1.8B reduction in 2025 risk adjustment revenue and rising Medicaid costs (leading to withdrawal of 2025 earnings guidance). However, the company has a book value near $56, debt-to-equity of 0.7x (healthy), a current P/E of 5x, and a forward P/E of 9x.
It may be a few years before this stock recovers. But the price has entered my "crash" simple moving average area (currently between $32 and $36) and there is a price gap on the daily chart between $32 and $33 that will likely be closed before a move higher. Long-term, and potentially a new political administration, new life may enter this stock once again as the baby boom generation requires more healthcare services. But holding is not for the faint of heart...
Thus, at $35.00, NYSE:CNC is in a personal buy zone with a likely continued dip into the low $30s or high $20s before a slow move higher (where I will be accumulating more shares). Full disclosure: I am also a position holder in the $60s and cost averaging down.
Targets into 2028:
$45.00 (+28.6%)
$54.00 (+54.3%)
Alexandria Real Estate (Revised) | ARE | Long at $45.00**This is a revised analysis from January 13, 2025:
I am still in that position ($97.41) but adding heavily now that the price has entered my selected "crash" simple moving average zone.
Technical Analysis
The trading price of Alexandria Real Estate NYSE:ARE has now reentered the "crash" simple moving average zone. The price first entered this zone back in October 2023. This rare, long-term double entry into this zone is often a (at least short-term) bottom indicator. But I remain heavily cautious here given the financials of this company. My reentry is an exit plan since this is a company I do not wish to hold longer than I have to.
Pros:
Fair value: $103.00
Intrinsic Value: $96.00
Forward P/E: 31x (current P/E in the negative)
Annual Dividend: 6.37% (Quarterly dividend just cut by 45%, so hopefully bad news is done for now...)
Debt-to-Equity: .8x (not bad)
Cons:
Bankruptcy risk is high: Altman's Z Score = .7
Inability to pay recent bills is high: Quick ratio = 3.5
REIT sector is in rough shape
More dividend cuts?
Action:
I originally underestimated the downfall of the REIT sector. This company's financials are questionable. From a technical analysis perspective, a short-term bottom may be in. However, there is more room to fall and the next support zone is down in the $30's. My hope is that the shift in interest rates will push more investors into dividend / value plays. While most investors would cut their losses and be out here, I'm not. Personally, *as long as NYSE:ARE doesn't keep cutting its dividend and the fundamentals do not get worse,* I am cost averaging down to hopefully escape soon. There are much better investments out there than NYSE:ARE , but patience often pays - or allows you to break even. I'll be the contrarian.
Targets into 2028:
$53.00 (+17.8%)
$69.00 (+53.3%)

Manuka Resources (ASX: MKR) – Australia’s only near-term silver Manuka Resources is positioning itself as the only near-term silver producer on the ASX. The company’s Wonawinta Mine in New South Wales is fully permitted and infrastructure-ready, with a confirmed 10-year mine life and planned output of 13.2 Moz silver.
At current silver prices above A$70/oz, and an AISC of around A$31/oz, the project has one of the highest operating margins in the sector. Metallurgical issues from previous operations have been resolved through a new log washer, clearing the way for restart.
Manuka recently restructured its debt, replacing a Hong Kong lender with a consortium of existing shareholders — significantly improving financial flexibility. A binding term sheet with non-bank lenders is now in place to fund the restart, targeting first production and cashflow in Q1 2026.
Additional leverage comes from the Mount Boppy gold project (feed-ready ore) and the large-scale Taranaki vanadium–titanium–iron sands project in New Zealand, which could become a future growth pillar.
With financing near completion and silver momentum building, Manuka stands as a high-leverage, near-term play on rising silver prices.
Please, do your own research!

Uber’s "Hybrid" Pivot: Why Robotaxi Threat is Now an OpportunityTime Horizon: Long-term, Bias: Bullish (Long)
The "Big Picture" (Summary) For years, the biggest fear for Uber investors was that autonomous vehicles (like Tesla or Waymo) would make the company obsolete. However, the newly confirmed partnership with Lucid and Nuro changes the story completely. Instead of being a victim of the robotaxi revolution, Uber is effectively "hedging" its future by securing its own fleet of 20,000 autonomous Lucid vehicles. This pivot transforms Uber from a simple marketplace into a resilient "Hybrid Network," making the current share price a compelling value for long-term holders.
The Analysis:
The Trend Uber is currently trading in a consolidation phase (moving sideways) in the low $80s after dropping about 20% from its 52-week highs. While the stock has been stuck due to fears about the future of driving, the actual business is accelerating—total trips grew 22% last year, faster than in previous quarters. The trend remains upward in the long term, but the stock is currently taking a breather.
Key Price Areas:
"Cheap" (Support): $75 – $80. This area has established itself as a "floor" where buyers step in. The recent news of on-road testing starting in San Francisco has reinforced this support level.
"Expensive" (Resistance): ~$102. This is the previous high. If the price breaks above this, it signals that the market has fully accepted Uber's new strategy.
The Catalyst The game-changer is the CES 2026 announcement of the Uber-Lucid-Nuro alliance. This isn't just a promise; Uber has invested $300 million and committed to deploying 20,000 vehicles. This proves Uber has a "Plan B" if other partners (like Waymo) try to squeeze them out. It removes the "existential risk" that has been holding the stock price down.
Investment Plan:
Buy Zone: $78.00 – $82.00 - Accumulating shares in this range allows you to enter while the market is still skeptical, offering a favorable entry point before the broader market reprices the stock.
Risk Level (Invalidation): Close below $65.00 - If the price drops below $65, our thesis is likely wrong. This would suggest the "Bear Case" is unfolding—where autonomous tech fails to scale or competitors like Tesla successfully cut Uber out of the market.
Target: $112.00 - We are targeting a move to $112, which represents roughly 37% upside from current levels. This valuation reflects Uber's successful shift to a "Hybrid Network" and its continued dominance as a "Super App."
Disclaimer: This content is for educational purposes only and does not constitute financial advice. All investments carry risk. Please do your own due diligence before making any investment decisions.

Sprouts Farmers Market (SFM): Why The Market Is Wrong About ThisTime Horizon: Long-term (Years), Bias: Long
The "Big Picture" (Summary) Sprouts Farmers Market (SFM) is currently trading at a price that suggests its growth is over, but the financial data tells a completely different story. While the market worries that 2025 was a "one-off" peak, the company's underlying business has fundamentally improved with wider margins and higher returns on capital. This creates a rare opportunity to buy a high-growth retailer at a value-stock price.
Analysis:
The Trend: While the stock price reflects skepticism, the company's performance is dominant. Revenue is expected to grow +14% (compared to the industry average of +3%), and profit margins have hit new highs.
Key Price Areas: The stock is currently "cheap" at $79.31. It is trading at a Price-to-Earnings (P/E) ratio of roughly 15x, while similar growth retailers trade at 25x. This is a 40% discount to its peers.
The Catalyst: The market believes profit margins will collapse, but this view is flawed because the improvements are driven by permanent changes, such as smaller, more efficient store formats. Future catalysts include continued earnings beats and the potential for the company to aggressively buy back its own shares using its $322M cash pile.
Investment Plan:
Buy Zone: $79.00 - $80.00 - At the current price of $79.31, the stock offers a massive "margin of safety" because it is already priced as if the worst-case scenario is happening.
Risk Level (Invalidation): $67.90 - This price represents the "Bear Case" scenario. If the price drops below this level, it suggests the market's negative view on future earnings may be materializing, and the thesis should be re-evaluated.
Target: $132.00 - This is the "Base Case" target, representing a potential +66% upside as the market realizes the company's growth is sustainable and re-rates the stock to a higher multiple.

Netflix (NFLX): Why We Are Buying the 'New Media Major' DiscountTime Horizon: Long-term Directional Bias: Bullish (Long)
The "Big Picture" (Summary) We hold a High Conviction bullish bias on Netflix. The market is currently mispricing the company's "Mega-Merger" with Warner Bros.. While investors are fearful of the debt load, we view this as a "Generational Consolidation" event. Netflix is acquiring prime assets like HBO and Harry Potter while rejecting the toxic, declining linear cable networks.
The Analysis (Why We Are Bullish)
The Valuation Disconnect: Our bullish stance is built on a valuation arbitrage. The stock trades at roughly 36x this year's earnings. However, because the market is ignoring the "cherry-picked" nature of the deal, you are effectively paying only 21.6x for the projected 2027 earnings. We are buying future growth at a historical discount.
Underlying Strength vs. Headline Noise: The recent price action has been dampened by a "red flag" in the Q3 earnings: a $619M tax charge in Brazil. This one-time event masked the reality that organic revenue accelerated by 17% and adjusted operating margins are healthy at ~33.6%. The fundamental engine is stronger than the headlines suggest.
The Catalyst: The completion of the Warner Bros. asset integration (expected Q3 2026). We expect $2–3 billion in cost savings simply by shutting down redundant tech stacks and combining marketing efforts.
Investment Plan
Buy Zone: $90.00 – $92.00 We look to accumulate long positions in this area. We want to be positioned before the "synergies" become obvious to the broader market.
Invalidation Level (Stop): Close below $80.00 Our bullish bias is invalidated if the deal is blocked by regulators, likely causing an initial drop to $80.
Target: $105.00 (+15%) This is our conservative Base Case target. If Netflix achieves "utility" status and realizing full synergies, our Bull Case extends to $144.00.
________________________________________
Disclaimer: This content is for educational purposes only and does not constitute financial advice. All investments carry risk. Please do your own research or consult a certified financial planner.

Baidu | BIDU | Long at $82.50Baidu NASDAQ:BIDU - the Google of China. This one is being ignored by AI investors, and may be an opportunity. Maybe... nothing is certain (especially with the "risks" of Chinese investments).
P/E = 9x
Debt/Equity = 0.27x
Price/Sales = 1.55x
Price/Book = 0.80x
Price/Cash flow = 7.59x
Thus, at $82.50, NASDAQ:BIDU is in a personal buy zone.
Targets:
$109.00
$125.00
$150.00

Novo Nordisk (NVO): A Rare Value Opportunity in a DuopolyBias: Long (Bullish) Time Horizon: Long-term (2+ Years)
The "Big Picture" Novo Nordisk, the pioneer of the modern weight-loss market, has seen its stock price fall to roughly $52, a level not seen since mid-2021. The market has panicked due to competition from Eli Lilly and some temporary setbacks, effectively pricing Novo as if it has stopped growing. We believe this is a classic overreaction: Novo is still growing revenue at 15% (currency-neutral) and remains a dominant player in a global market large enough for two winners.
The Analysis:
The Trend: The stock experienced a "free fall" in late 2025, driven by a series of negative updates rather than a single catastrophic event. Sentiment shifted from "perfection" to extreme pessimism after the company lowered guidance and missed targets on an Alzheimer's trial. However, the business fundamentals remain strong, with the company generating over $33 billion USD in revenue in the first nine months of 2025.
The Valuation Gap: This is the core of the thesis. Novo Nordisk is currently trading at a Price-to-Earnings (P/E) ratio of roughly 14.2x. For context, its primary competitor, Eli Lilly, trades at over 50x earnings. This 73% discount suggests the market expects Novo to lose almost all relevance, which we view as analytically flawed given their pipeline and cash generation.
The Catalyst: Three main drivers will likely push the price back up:
1. Pipeline Success: The expected launch of "CagriSema" in late 2026, a next-gen drug with projected weight loss of 25%, which effectively neutralizes Eli Lilly's efficacy advantage.
2. Supply Chain Moat: Massive investments in manufacturing (CapEx) will allow Novo to meet demand that competitors simply cannot supply.
3. Leaner Operations: Following a painful restructuring in 2025, the company has cut costs significantly, which should improve profit margins moving forward.
Investment Plan
• Buy Zone: $50.00 – $55.00
o We view the current price of ~$52 as a "bear case" floor, offering an excellent entry point for long-term accumulation.
• Risk Level (Invalidation): Below $48.00
o While a hard stop isn't explicitly set in the report, a sustained drop below the $50 psychological and valuation floor would require re-evaluating the thesis.
• Target: $72.00
o This target assumes a recovery to a more reasonable valuation (20x earnings) over the next 12 months as market sentiment normalizes.
________________________________________
Disclaimer: This content is for educational purposes only and does not constitute financial advice. Past performance is not indicative of future results. Please do your own research before making any investment decisions.
