OSCR - I love it. As you may know if you've seen one of my many OSCR posts in the past, I have a strong bias toward this company as a long time shareholder and treat any trade I make here as a long term position. This is only my opinion and analysis so please do your own analysis and always trade with patience and intention.
If anyone sees this differently, I'd appreciate to hear a convincing long term bear case here. I know I'm completely blinded on this one and that's where traders could get trapped!
That being said, the signs and timeframes are all aligning on this one:
- Recent volume and volatility increase (good for growth company and signals start up for a HTF trend continuation. We've get the necessary liquidity for now.)
- RSI crossing 50 Weekly & Daily
- MacD crossing 0 Weekly & Daily
- CMF crossing 0! Weekly & Daily!
This is a massive indication of a move - look back at any previous V-shape recoveries above 0 like this - always precedes a large breakout.
- 50% HTF Fib ($13.15) is major support level and recently proven with the gap up.
- And my favorite - The algorithms are presenting themselves beautifully. We are initiating buying continuation and that is the key to sustain the breakout of a HTF algorithm like orange.
I highlight the yellow flip zone as our trade confirmation area.
$17.23 - $18.77.
Below, better price, potential to enter in the $15's potentially or maybe a dig to $14 to try and close gap?
Above, big confirmation and immediate room to $21-24.
This zone is a Middle-time-frame liquidity pool set up within a HTF taper structure allowing for a larger move and that in the future can act as a near or long term support beam and liquidity pool if necessary.
I'm not a massive indicator user but I do check them out for a position like this and they look primed on all fronts.
Happy Trading :)
Value

Alexandria Real Estate (Revised) | ARE | Long at $45.00**This is a revised analysis from January 13, 2025:
I am still in that position ($97.41) but adding heavily now that the price has entered my selected "crash" simple moving average zone.
Technical Analysis
The trading price of Alexandria Real Estate NYSE:ARE has now reentered the "crash" simple moving average zone. The price first entered this zone back in October 2023. This rare, long-term double entry into this zone is often a (at least short-term) bottom indicator. But I remain heavily cautious here given the financials of this company. My reentry is an exit plan since this is a company I do not wish to hold longer than I have to.
Pros:
Fair value: $103.00
Intrinsic Value: $96.00
Forward P/E: 31x (current P/E in the negative)
Annual Dividend: 6.37% (Quarterly dividend just cut by 45%, so hopefully bad news is done for now...)
Debt-to-Equity: .8x (not bad)
Cons:
Bankruptcy risk is high: Altman's Z Score = .7
Inability to pay recent bills is high: Quick ratio = 3.5
REIT sector is in rough shape
More dividend cuts?
Action:
I originally underestimated the downfall of the REIT sector. This company's financials are questionable. From a technical analysis perspective, a short-term bottom may be in. However, there is more room to fall and the next support zone is down in the $30's. My hope is that the shift in interest rates will push more investors into dividend / value plays. While most investors would cut their losses and be out here, I'm not. Personally, *as long as NYSE:ARE doesn't keep cutting its dividend and the fundamentals do not get worse,* I am cost averaging down to hopefully escape soon. There are much better investments out there than NYSE:ARE , but patience often pays - or allows you to break even. I'll be the contrarian.
Targets into 2028:
$53.00 (+17.8%)
$69.00 (+53.3%)

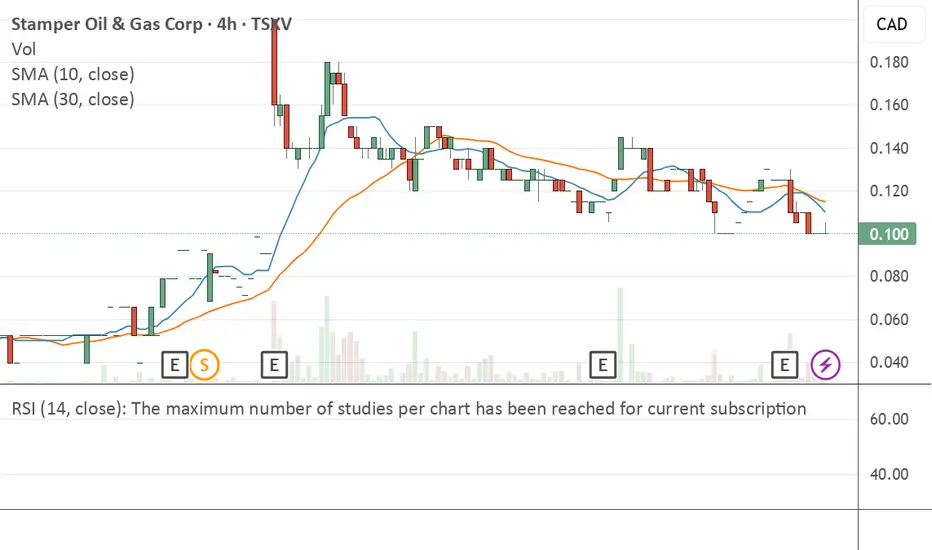
Stamper Oil & Gas (STMP.V/STMGF) is strategically expandingStamper Oil & Gas Corp (STMP.V / STMGF) presents a compelling exploration opportunity in offshore Namibia. The company's portfolio consists of five strategic petroleum exploration licenses across multiple promising basins.
Key technical highlights:
- Four blocks with carried interests
- Blocks located in Orange, Lüderitz, and Walvis Basins
- Proximity to recent significant discoveries
- Estimated potential of 1.7-2.2 billion recoverable barrels per block
The exploration strategy focuses on minimizing direct costs while maintaining exposure to potential major discoveries. Blocks are strategically positioned near recent finds by major energy companies, including Total Energies, Chevron, and Azule Energy. Exploration activities are anticipated to intensify in 2026-2027, creating potential value opportunities.

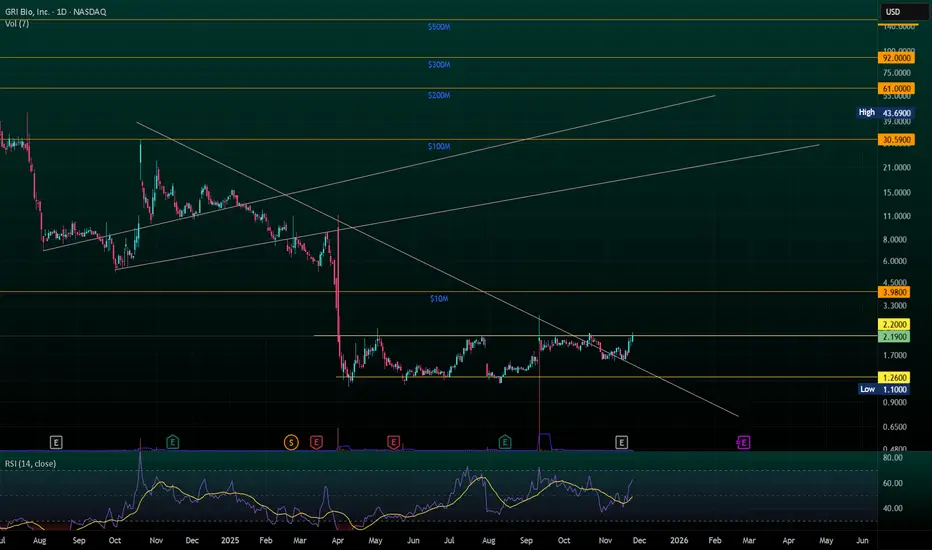
$GRI tap tap tapping $2.2 resistanceNASDAQ:GRI will release topline 12-week study data this week. All indications are that data will be positive. The price continues to test $2.2 resistance. This will be broken soon.
While all price movements are relative and unique, other companies with failed IPF trials lost ~$300M in market cap upon announcement. Others with successful trails have gained billions. GRI is worth approximately $6M today. Lots of room for upward valuation.
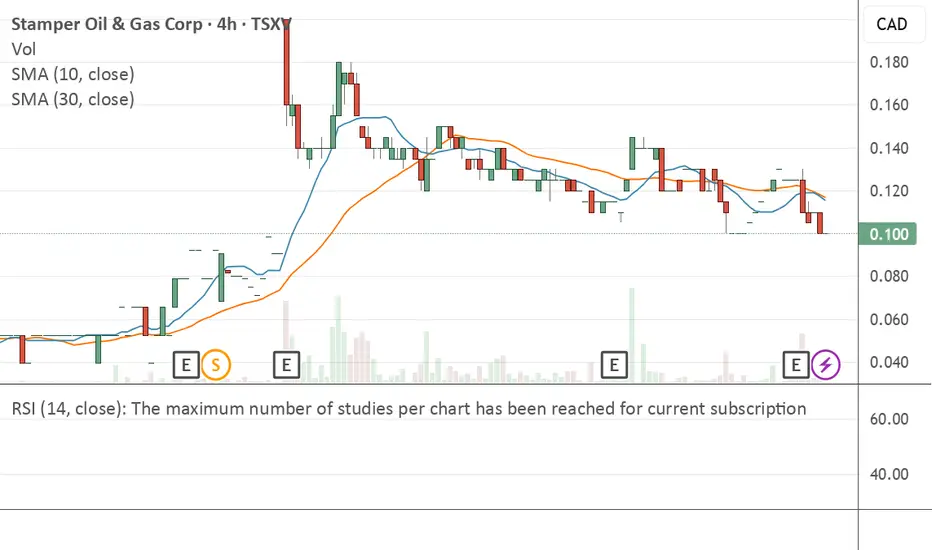
Stamper Oil & Gas: Namibian Offshore Exploration Potential
Stamper Oil & Gas Corp (STMP.V / STMGF) presents a compelling offshore exploration strategy in Namibia.
The company's portfolio includes five strategic petroleum exploration blocks across multiple basins, with carried interests on four blocks.
Each block demonstrates potential recoverable resources of 1.7-2.2 billion barrels. Strategic positioning near recent major discoveries by Total Energies, Galp, and Rhino Resources enhances exploration potential.
The company's approach of farming out working interests to secure carried positions mirrors successful strategies in the region.

XAUUSD | Gold Signal |Dec 8,2025📌 MARKET ASSESSMENT
1. General Context
Gold continues to fluctuate within the medium-term range on the H1 chart with a slight downward correction structure. The price is currently moving between the upper supply zone and the lower support trendline, indicating that the market is waiting for more momentum to break out.
2. Current Trend
The H1 chart maintains an overall uptrend but is in a correction phase.
The supply and demand zones are clearly formed, creating conditions for trading according to the technical reaction zone.
The uptrend trendline plays an important support role and has not been penetrated yet.
3. Important Observation Zone
H1 Supply Zone (Sell Zone): 4225 – 4230
The position of confluence with the recent peak.
If the price approaches and is rejected, it is likely to fall back to the support zones.
Support Zone/Entry Buy: 4167 – 4175
Confluence between the uptrend line + H1 bottom + demand zone.
This is the zone with a high probability of forming a bullish reaction.
4. Trading Scenario
Scenario 1 – Sell at Supply Zone
Entry: 4225 – 4230
SL: Above 4235
TP:
Target 1: 4200
Target 2: H1 Trendline
Scenario 2 – Buy at Support Zone
Entry: 4167 – 4175
SL: Below 4160
TP:
Target 1: 4198 – 4205
Target 2: 4220
5. Conclusion
Gold is approaching important technical zones and is suitable for trading on price reaction instead of chasing the market. Both scenarios are highly plausible given the H1 structure remains intact. Prioritize waiting for the price to touch the supply and support zones to avoid the risk of fluctuations between zones.

Stellantis | STLA | Long at $9.59Stellantis NYSE:STLA is the maker of the auto brands Fiat, Peugeot, Jeep, Citroën, Opel/Vauxhall, Ram Trucks, Dodge, Chrysler, Alfa Romeo, Maserati, DS Automobiles, Lancia, Abarth, and Vauxhall. The stock has fallen sharply due to a 70% profit drop in 2024, weak U.S. sales, high inventory, and tariff uncertainties. The turnaround for NYSE:STLA beyond 2025 hinges on new CEO Antonio Filosa’s focus on U.S. market recovery, new product launches (e.g., Ram 1500 Ramcharger, Jeep hybrids), pricing adjustments, aggressive marketing, $5B U.S. manufacturing investment, and mending dealer relations. The stock is trading at a P/E of 5.1x, debt-to-equity of 0.8x (not bad), a book value of $29 (undervalued), a tangible book value of $9.82, and earnings and revenue are forecasted to grow into 2028. Economic weakening and tariffs may hamper these predictions, but the new CEO and future interest rate drops may get this stock rolling again.
However, if NYSE:STLA shows zero sign of near-term recovery or other fundamental issues arise, I truly think this stock could enter the high $5-$6 range before a true reversal begins.
From a technical analysis perspective, the stock price is currently with my selected "crash" simple moving average. This area often signifies a near-term bottom, but like mentioned above, watchout out for the "major crash" simple moving average area currently between $5.83 and $7.09.
Regardless of bottom predictions, NYSE:STLA is in a personal buy zone at $9.59 with a greater position likely if it enters my "major crash" zone, as mentioned above.
Targets into 2027:
$12 (+25.1%)
$14 (+46.0%)

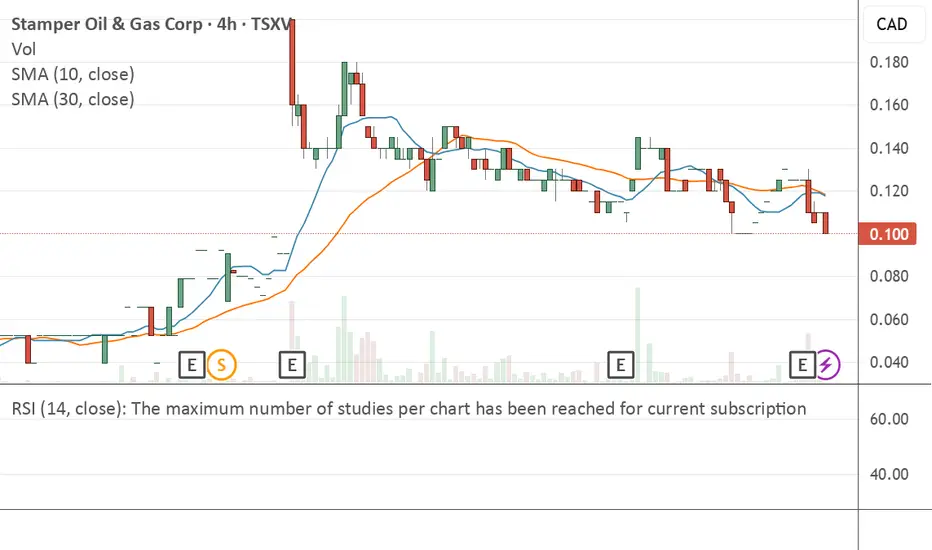
Stamper Oil & Gas: Namibian Offshore Exploration Asset AnalysisStamper Oil & Gas Corp (STMP.V / STMGF) presents a strategic offshore exploration portfolio in Namibia's emerging petroleum basins. Key analytical insights:
- Five exploration blocks across Orange, Walvis, and Namibe Basins
- Four blocks feature carried interests, minimizing exploration expenses
- Estimated 1.7-2.2 billion barrels potential recoverable resources per block
Strategic positioning near major discoveries by Total Energies, Galp, and Chevron provides potential value. The company's approach focuses on:
- Minimal upfront exploration costs
- Strategic block locations
- Potential for future farm-out agreements
The exploration strategy targets multiple petroleum basins with proven hydrocarbon potential, offering exposure to an emerging exploration frontier.
Dollar General | DG | Long at $90.00Dollar General NYSE:DG took a massive hit this morning after revising their future earnings guidance. The economy is showing many signs of a recession, and this is a clear warning. From a technical analysis perspective, it has retouched my "crash" simple moving average and may dip further into the $80's in the near-term. But, like many overall strong companies that suddenly plummet, I view this as a future opportunity given the strength of NYSE:DG as a business (holistically). Dollar General is the only grocery and home goods store around in many rural locations. So, while there is doom and gloom in the near-term, Dollar General is in a personal buy zone at $90.00. I view this as a starter position, though, with the potential for future declines/opportunities for additional share accumulation in the near-term.
Target #1 = $100.00
Target #2 = $122.00
Target #3 = $200.00+ (very-long term outlook...)

Stamper Oil & Gas: Strategic Namibian Offshore ExplorationStamper Oil & Gas Corp (STMP.V / STMGF) presents a strategic offshore exploration opportunity in Namibia's emerging petroleum basins. The company has assembled a portfolio of five exploration licenses across the Orange, Lüderitz, and Walvis basins.
Portfolio composition:
- Four blocks with carried interests
- Potential recoverable resources of 1.7-2.2 billion barrels per block
- Proximity to significant discoveries by major operators
Key exploration assets:
- PEL 107 in deep water, near Total's Venus discovery
- PEL 102 with a 20% carried interest
- PEL 106 and PEL 98 with 5% carried interests in the Walvis Basin
Exploratory activities are anticipated in 2026-2027, with potential 3D seismic acquisition planned for PEL 106.
XAUUSD | Gold Signal |Dec 4,2025📌 MARKET ASSESSMENT
As of Thursday, December 4, spot gold is trading at $4,202 per ounce, up roughly $10 on the day.
ADP data showed that the U.S. private sector lost 32,000 jobs in November, sharply missing expectations for a gain of 10,000 and marking the steepest drop since March 2023. Win Thin (Nassau 1982) noted that the ADP index has been weakening consistently, reflecting a sustained cooling trend in the labor market. Nela Richardson from ADP added that the slowdown is broad-based across all business groups, especially among small and medium-sized enterprises — a sign that consumers are becoming more cautious amid ongoing macroeconomic uncertainty.
While gold jumped in response to the data, silver — which briefly touched $58.97 per ounce early yesterday — fell sharply back to $57.83, triggering short-term corrections across the entire precious metals complex.
Since gold is a non-yielding asset, expectations of monetary easing remain its core support. However, the combination of soft economic data, silver’s volatility, and profit-taking suggests that gold’s path upward will remain uneven.
Macro forces — weakening labor indicators, a softer U.S. dollar, and political uncertainty surrounding the Fed Chair position — continue to tilt in gold’s favor. But until the metal can firmly break above $4,400 per ounce with strong liquidity, any upside acceleration remains only potential rather than confirmed. This is for reference only.

Stamper Oil & Gas: Strategic Namibian Offshore Exploration AnalStamper Oil & Gas Corp (STMP.V / STMGF) is executing a strategic offshore exploration approach in Namibia. The company has acquired five petroleum exploration licenses across multiple basins, with a focus on minimizing exploration costs through carried interests.
Key strategic elements:
- Five licenses in Orange, Lüderitz, and Walvis Basins
- Carried interests on four blocks
- Potential 1.7-2.2 billion barrels of recoverable resources per block
- Proximity to recent significant discoveries
The Volans 1 well discovery has validated the region's geological potential. Major international oil companies are actively exploring these basins, suggesting significant opportunity.
XAUUSD | Gold Signal |Dec 2,2025Gold has pulled back to $4,210/oz today as the market sees some profit-taking after yesterday’s strong rally to a six-week high. Despite the dip, overall sentiment remains firmly supported by expectations of a Federal Reserve rate cut next week.
📌 Key Drivers Behind Today’s Move
1️⃣ Profit-Taking After a Sharp Rally
Gold surged on Monday, and today’s decline reflects natural profit-taking rather than a shift in trend.
Momentum remains intact as long as expectations for a rate cut stay elevated.
2️⃣ Rate-Cut Expectations Strengthen Further
Markets now price in an 88% probability of a 25bps cut at the upcoming Fed meeting.
This confidence is driven by:
• Weak US economic data
• Dovish comments from multiple Fed officials
3️⃣ Manufacturing Weakness Adds Pressure on the Fed
Monday’s data showed US manufacturing contracted for the 9th straight month, signaling persistent economic softness.
This reinforces the case for easing and remains supportive for gold.
📊 What Investors Are Watching Next
• Jerome Powell’s speech today
His ton, hawkish or dovish could influence short-term volatility in gold.
• ADP Employment Data (later this week)
A weaker print would strengthen expectations for a rate cut.
• Delayed September PCE Report
As the Fed’s preferred inflation gauge, this data will be critical for confirming the policy path.

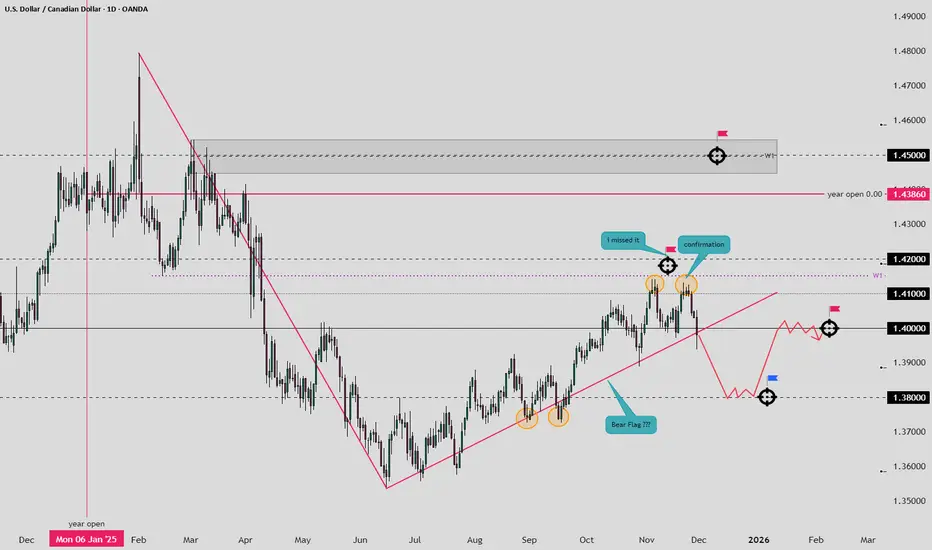
Why USD is a forex King !USD continues to show why it’s considered the king of the forex market—its strength sets the tone across major pairs. I’m watching how its momentum influences broader market structure

XAUUSD | Gold Signal |Dec 1,2025BUY TREND TARGET FOR TODAY 📊
☄️ GOLD (XAU/USD) H1 STRUCTURE BREAKDOWN: BULLS IN CONTROL ☄️
The market has decisively confirmed the trend reversal. After navigating the consolidation phase, the price action has established a strong, clear Bullish structure.
📊Key Observations
🔤Clear BOS: We have seen multiple Bullish Break of Structures (BOS), confirming that buyers are in complete control of the H1 timeframe. The initial structural resistance (4140-4150) has been cleared.
🔤Current Price Action: Price is currently pushing into the prior high liquidity zone (around 4220) and shows strong momentum, now trading near 4250.
🔤Unmitigated FVG: The most critical immediate Demand Zone lies around 4150 - 4160 (FVG/Order Block). This is the key zone the price may return to for mitigation before continuing higher.
📊Trading Outlook
🔤The bias remains STRONGLY BULLISH.
🔤Primary Strategy: Look for BUY opportunities on minor pullbacks or when price revisits the nearest Demand Zone/FVG for correction.
🔤Invalidation: A decisive close below the key structural low (the Order Block below 4150) would signal a CHoCH back to bearish pressure.

Update Formation..
it didn't come to my sweet spot Sell, so i change formation, waiting for next trade... be patience.
i can't predict future, just planning "if-in-fact" for the future.
Crazy BTC x20 zoomHello,
again welcome to this post
this crypto crisis is going to expose a lot of fake money and imagination movements throw the years...
we've seen some chocking up's and down's and now the moment has arrived because there is no more hiding is seek.
big wheals are done and brokers and trying to keep the flow with no money in pockets..
we have 6 mouths till we see the truth and it might be very ugly for almost all of us.
the back up strategies is to fall back if you have gains and the results might bleed blood from to march.
GL

JD.COM is an extremely oversold stockThere’s an interesting situation with JD.com right now.
According to the latest report, the company’s net cash position (cash on the balance sheet minus debt) is around $18 billion.
At the same time, its stakes in the publicly traded JD Health (~67%) and JD Logistics (~62%) are worth about $25 billion at current market caps.
So the combined value of the subsidiaries and the group’s net assets is $43 billion, while the whole company is currently trading at $39 billion.
This implies that JD Retail (their core business — the marketplace), JD Industrials, JD Technology, and JD Property are being valued by the market at negative levels.
Until last September, there were quite a few companies trading below their cash balances with no debt, and since then many have corrected significantly upward. The fact that JD is once again trading like this is surprising.
In my view, the current price can be explained by the following: In September–October, a huge amount of 40-strike calls expiring January 16 were bought — roughly 450,000 contracts, which is enormous (45 million shares against an average daily volume of 16 million). But they couldn’t sustain it, and now this positioning is working against the stock price: the options are decaying, which is putting pressure on the price. Since November the SPX has been volatile, and around 80k contracts were closed; open interest is now 374k — still extremely high.
So I think this is purely a technical drawdown that will fade as the options expire. Alternatively, a very strong catalyst would be needed to generate a +30–50% spike in daily volume for delta to “start working.”
Today China released a plan for additional stimulus, and JPMorgan upgraded Chinese equities to “overweight,” expecting that AI and economic stimulus will be the key drivers in 2026.

MERL Correction LoadingWhat Goes Up Must Come Down. Waiting for one of the major resistances to hit and then short the correction towards VAH.

XAUUSD | Gold Signal |Now 26,2025BUY TREND TARGET FOR TODAY 📊
The BUY setup on XAUUSD makes sense in the current market context because price is moving within a clear uptrend, supported by the EMA 34, 89, and 200 all pointing upward and aligned in a bullish structure. The entry zone around 4152–4149 coincides with a supportive area on the Volume Profile, indicating strong previous trading activity and liquidity that often acts as a base for price to bounce. When price pulls back into this zone during an uptrend, it typically represents a healthy correction rather than a reversal, especially if bullish candles or increased buying volume appear. Overall, this setup aligns well with the prevailing bullish momentum, and entering near a support area within a rising structure increases the probability of catching the next upward swing.
♾️Gold BUY @ 4051 - 4049
💰TP1 - 4155
💰TP2 - 4258
🚨Sl: 4145

MONAD $5.00 ATH HODL!I pre-ordered 12,000 MON tokens on Coinbase 11-17-25
Coinbase added the tokens to my wallet today! :)
IN $0.025

$ETH looks MAJORLY BULLISH for 2026CRYPTOCAP:ETH has been stagnant this entire year, performing very poorly related to CRYPTOCAP:BTC
However, CRYPTOCAP:ETH will have its day. It looks majorly bullish fundamentally leading into 2026, and the chart checks out as potentially very bullish setup.
As you can see, CRYPTOCAP:ETH closed above the .618 the past few days from the range dating back to April 2025. It also is channeling down in a falling wedge.
What is interesting is Ethereum's recent strength relative to Bitcoin. It looks stronger than CRYPTOCAP:BTC and I believe the narrative majorly shifts from BTC to ETH next year. The chart is primed for an absolute explosion and the suppression of it this year reminds me of the BTC suppression that happened in 2022 as institutions and whales had their fill (bought a ton).
Keep an eye on Ethereum into 2026, but the chart screams she is ready to rip with a proper push. If we break out of this falling wedge and retest it with volume, get ready to fuel the jets because Ethereum has not had a proper run since 2021.
It is quite likely it will be a keystone to the digitalization of our society and world via the blockchain. No other coin or company can compete. ETH is about to have its day in the sun.

MONAD - Public Release 11-24-2025 - Spot Long!I pre-ordered 12,000 MON tokens on Coinbase 11-17-25
Coinbase added the tokens to my wallet today! :)
IN $0.025
