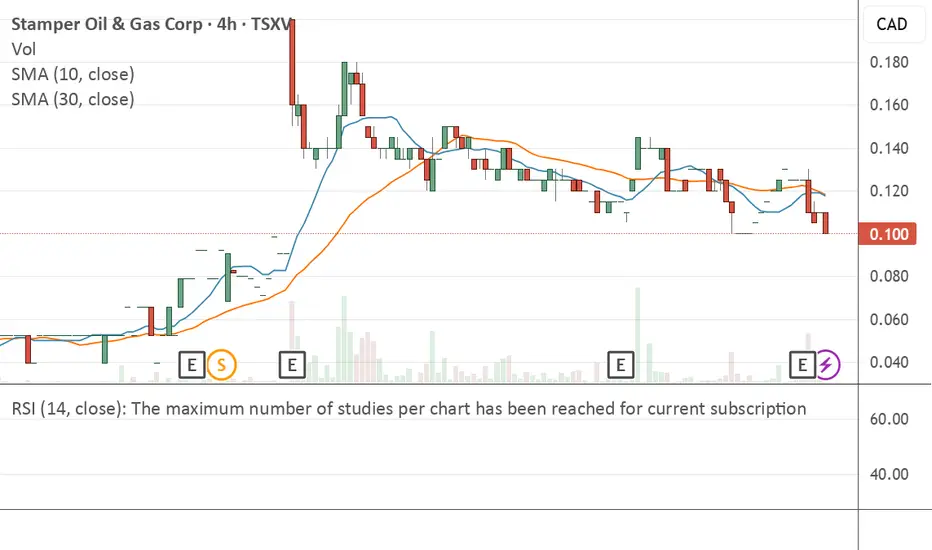
Stamper Oil & Gas: Strategic Namibian Offshore Exploration AnalStamper Oil & Gas Corp (STMP.V / STMGF) is executing a strategic offshore exploration approach in Namibia. The company has acquired five petroleum exploration licenses across multiple basins, with a focus on minimizing exploration costs through carried interests.
Key strategic elements:
- Five licenses in Orange, Lüderitz, and Walvis Basins
- Carried interests on four blocks
- Potential 1.7-2.2 billion barrels of recoverable resources per block
- Proximity to recent significant discoveries
The Volans 1 well discovery has validated the region's geological potential. Major international oil companies are actively exploring these basins, suggesting significant opportunity.
Value
XAUUSD | Gold Signal |Dec 2,2025Gold has pulled back to $4,210/oz today as the market sees some profit-taking after yesterday’s strong rally to a six-week high. Despite the dip, overall sentiment remains firmly supported by expectations of a Federal Reserve rate cut next week.
📌 Key Drivers Behind Today’s Move
1️⃣ Profit-Taking After a Sharp Rally
Gold surged on Monday, and today’s decline reflects natural profit-taking rather than a shift in trend.
Momentum remains intact as long as expectations for a rate cut stay elevated.
2️⃣ Rate-Cut Expectations Strengthen Further
Markets now price in an 88% probability of a 25bps cut at the upcoming Fed meeting.
This confidence is driven by:
• Weak US economic data
• Dovish comments from multiple Fed officials
3️⃣ Manufacturing Weakness Adds Pressure on the Fed
Monday’s data showed US manufacturing contracted for the 9th straight month, signaling persistent economic softness.
This reinforces the case for easing and remains supportive for gold.
📊 What Investors Are Watching Next
• Jerome Powell’s speech today
His ton, hawkish or dovish could influence short-term volatility in gold.
• ADP Employment Data (later this week)
A weaker print would strengthen expectations for a rate cut.
• Delayed September PCE Report
As the Fed’s preferred inflation gauge, this data will be critical for confirming the policy path.

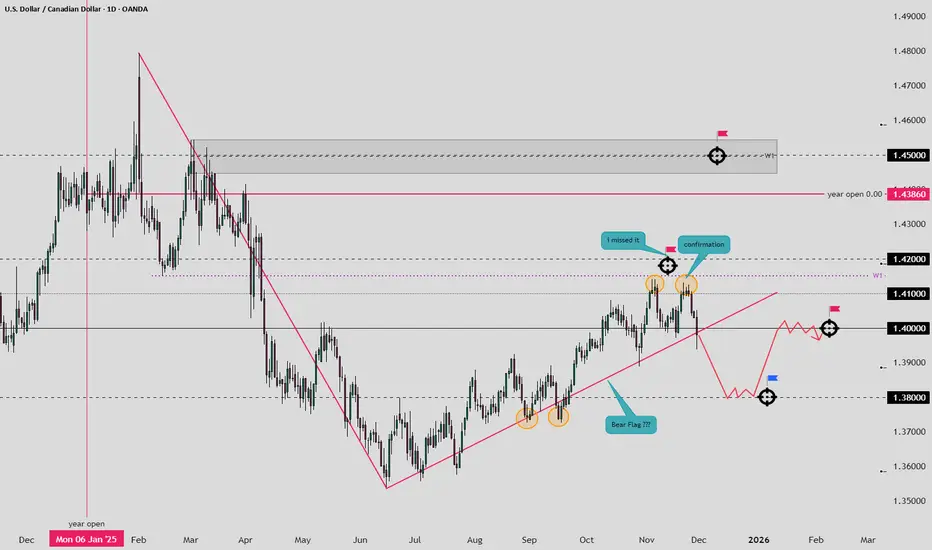
Why USD is a forex King !USD continues to show why it’s considered the king of the forex market—its strength sets the tone across major pairs. I’m watching how its momentum influences broader market structure

XAUUSD | Gold Signal |Dec 1,2025BUY TREND TARGET FOR TODAY 📊
☄️ GOLD (XAU/USD) H1 STRUCTURE BREAKDOWN: BULLS IN CONTROL ☄️
The market has decisively confirmed the trend reversal. After navigating the consolidation phase, the price action has established a strong, clear Bullish structure.
📊Key Observations
🔤Clear BOS: We have seen multiple Bullish Break of Structures (BOS), confirming that buyers are in complete control of the H1 timeframe. The initial structural resistance (4140-4150) has been cleared.
🔤Current Price Action: Price is currently pushing into the prior high liquidity zone (around 4220) and shows strong momentum, now trading near 4250.
🔤Unmitigated FVG: The most critical immediate Demand Zone lies around 4150 - 4160 (FVG/Order Block). This is the key zone the price may return to for mitigation before continuing higher.
📊Trading Outlook
🔤The bias remains STRONGLY BULLISH.
🔤Primary Strategy: Look for BUY opportunities on minor pullbacks or when price revisits the nearest Demand Zone/FVG for correction.
🔤Invalidation: A decisive close below the key structural low (the Order Block below 4150) would signal a CHoCH back to bearish pressure.

Update Formation..
it didn't come to my sweet spot Sell, so i change formation, waiting for next trade... be patience.
i can't predict future, just planning "if-in-fact" for the future.
Crazy BTC x20 zoomHello,
again welcome to this post
this crypto crisis is going to expose a lot of fake money and imagination movements throw the years...
we've seen some chocking up's and down's and now the moment has arrived because there is no more hiding is seek.
big wheals are done and brokers and trying to keep the flow with no money in pockets..
we have 6 mouths till we see the truth and it might be very ugly for almost all of us.
the back up strategies is to fall back if you have gains and the results might bleed blood from to march.
GL

JD.COM is an extremely oversold stockThere’s an interesting situation with JD.com right now.
According to the latest report, the company’s net cash position (cash on the balance sheet minus debt) is around $18 billion.
At the same time, its stakes in the publicly traded JD Health (~67%) and JD Logistics (~62%) are worth about $25 billion at current market caps.
So the combined value of the subsidiaries and the group’s net assets is $43 billion, while the whole company is currently trading at $39 billion.
This implies that JD Retail (their core business — the marketplace), JD Industrials, JD Technology, and JD Property are being valued by the market at negative levels.
Until last September, there were quite a few companies trading below their cash balances with no debt, and since then many have corrected significantly upward. The fact that JD is once again trading like this is surprising.
In my view, the current price can be explained by the following: In September–October, a huge amount of 40-strike calls expiring January 16 were bought — roughly 450,000 contracts, which is enormous (45 million shares against an average daily volume of 16 million). But they couldn’t sustain it, and now this positioning is working against the stock price: the options are decaying, which is putting pressure on the price. Since November the SPX has been volatile, and around 80k contracts were closed; open interest is now 374k — still extremely high.
So I think this is purely a technical drawdown that will fade as the options expire. Alternatively, a very strong catalyst would be needed to generate a +30–50% spike in daily volume for delta to “start working.”
Today China released a plan for additional stimulus, and JPMorgan upgraded Chinese equities to “overweight,” expecting that AI and economic stimulus will be the key drivers in 2026.

MERL Correction LoadingWhat Goes Up Must Come Down. Waiting for one of the major resistances to hit and then short the correction towards VAH.

XAUUSD | Gold Signal |Now 26,2025BUY TREND TARGET FOR TODAY 📊
The BUY setup on XAUUSD makes sense in the current market context because price is moving within a clear uptrend, supported by the EMA 34, 89, and 200 all pointing upward and aligned in a bullish structure. The entry zone around 4152–4149 coincides with a supportive area on the Volume Profile, indicating strong previous trading activity and liquidity that often acts as a base for price to bounce. When price pulls back into this zone during an uptrend, it typically represents a healthy correction rather than a reversal, especially if bullish candles or increased buying volume appear. Overall, this setup aligns well with the prevailing bullish momentum, and entering near a support area within a rising structure increases the probability of catching the next upward swing.
♾️Gold BUY @ 4051 - 4049
💰TP1 - 4155
💰TP2 - 4258
🚨Sl: 4145

MONAD $5.00 ATH HODL!I pre-ordered 12,000 MON tokens on Coinbase 11-17-25
Coinbase added the tokens to my wallet today! :)
IN $0.025

$ETH looks MAJORLY BULLISH for 2026CRYPTOCAP:ETH has been stagnant this entire year, performing very poorly related to CRYPTOCAP:BTC
However, CRYPTOCAP:ETH will have its day. It looks majorly bullish fundamentally leading into 2026, and the chart checks out as potentially very bullish setup.
As you can see, CRYPTOCAP:ETH closed above the .618 the past few days from the range dating back to April 2025. It also is channeling down in a falling wedge.
What is interesting is Ethereum's recent strength relative to Bitcoin. It looks stronger than CRYPTOCAP:BTC and I believe the narrative majorly shifts from BTC to ETH next year. The chart is primed for an absolute explosion and the suppression of it this year reminds me of the BTC suppression that happened in 2022 as institutions and whales had their fill (bought a ton).
Keep an eye on Ethereum into 2026, but the chart screams she is ready to rip with a proper push. If we break out of this falling wedge and retest it with volume, get ready to fuel the jets because Ethereum has not had a proper run since 2021.
It is quite likely it will be a keystone to the digitalization of our society and world via the blockchain. No other coin or company can compete. ETH is about to have its day in the sun.

MONAD - Public Release 11-24-2025 - Spot Long!I pre-ordered 12,000 MON tokens on Coinbase 11-17-25
Coinbase added the tokens to my wallet today! :)
IN $0.025

XAUUSD | Gold Signal |Now 24,2025TREND TARGET FOR TODAY 📊
Gold prices fell on Monday, extending Friday’s decline, as investors awaited more U.S. economic data for clearer signals on the Federal Reserve’s policy outlook.
Attention will mainly focus on September retail sales and PPI data on Tuesday, along with weekly jobless claims on Wednesday.
Expectations for a December rate cut have shifted after Fed Chair John Williams signaled support for another cut in the near term.
The market is now pricing in about a 70% chance of a 25-basis-point rate cut next month, compared to around 40% last Thursday following the strong jobs report.
XAUUSD trading strategy around key price areas:
♾️SELL XAUUSD 4102–4104
🚨SL: 4109
💰TP 1: 4097
💰TP 2: 4092
💰TP 3: 4087
💰TP 4: 4082
♾️BUY XAUUSD 4030–4032
🚨SL: 4025
💰TP 1: 4036
💰TP 2: 4041
💰TP 3: 4045
💰TP 4: 4050


$IONQ - Priced to perfection?IonQ is an early-stage quantum computing company (trapped-ion architecture). Disclosure is thin: revenue is not segmented by source and recent acquisitions (e.g. Oxford Ionics, Capella, Lightsynq) make organic revenue growth trends hard to isolate.
Even if FY2025 revenue reaches ~$100m (≈132% y/y), I estimate a full-year net margin ≈ -240%. Given the scale of continued R&D and engineering spend required to reach error-corrected, production-grade systems, I don’t expect positive operating margins in the near term, and at an enterprise value of roughly $20bn, the stock embeds substantial future success.
On simple cross-checks (EV/Revenue, implied long-run FCF margin, and dilution
from SBC/capex needs), the market price already assumes rapid commercialization and high
steady-state margins. As such, execution risk is under-discounted and the shares screen
overvalued on current fundamentals.
For today’s ~$20bn EV to be reasonable, IonQ would likely need:
• Commercial scale: multi-year >50% revenue growth from recurring customers and annual contracts.
• Economics: credible path to ~30%+ GAAP net margin in the early 2030s.
• Technology: order-of-magnitude gains in algorithmic qubits and error correction, independently verified.
• Disclosure quality: segmented revenue (organic vs M&A), backlog visibility.
Technicals:
Significant overvalued signal on RSI, and close to the next Fib level, indicates a good opportunity to short.

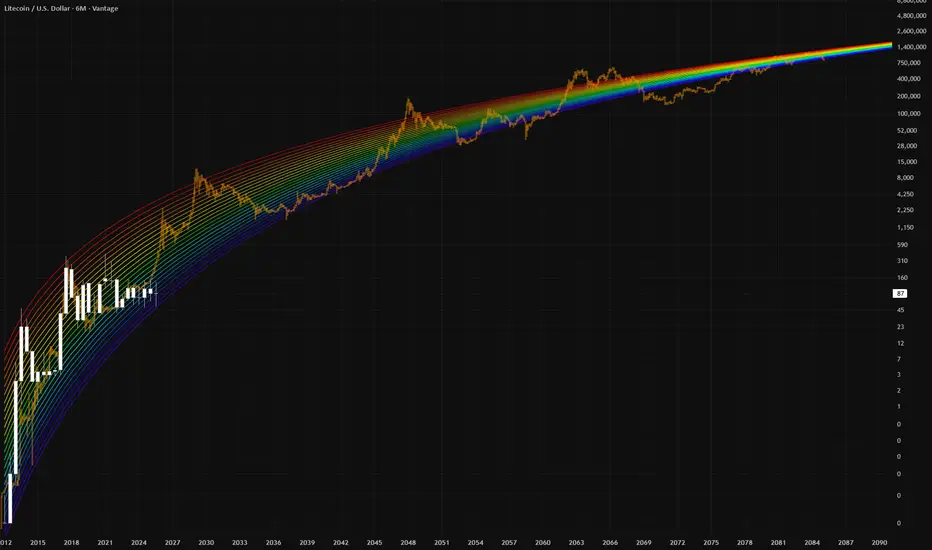
Litecoin = Bitcoin in 4× slow-motionLitecoin is Bitcoin in 2012 and basically it's living in a time 4x slower
JGB Selloff Flags Rising Fiscal RiskJapan 10Y Yields Hit 17-Year High: JGB Selloff Flags Rising Fiscal Risk
Idea Summary
Japan’s 10-year government bond yield has climbed to around 1.8% for the first time in more than 17 years, driven by concerns over an aggressive fiscal stimulus package and a deteriorating debt outlook. At the same time, ultra-long JGB yields are surging, signaling that investors are demanding a higher risk premium to hold Japanese debt. In this note, I focus on what this means for JGBs and JPY going forward.
Macro Background
The new government under PM Sanae Takaichi is pushing a large fiscal stimulus package, with total size reportedly above ¥20 trillion and additional budget issuance likely around ¥17 trillion.
Investors worry that this will further weaken Japan’s already stretched public finances, with the debt-to-GDP ratio sitting near 240%.
As a result, long-dated JGBs have been under heavy selling pressure, with the 40-year yield jumping to around 3.7% – its highest level since the bond was first issued.
The market is now waiting for more details on the stimulus package and watching closely for any signals from the BoJ about the pace of future rate hikes or balance-sheet adjustments.
Bond Market Technical View
The 10Y JGB yield has clearly broken above previous resistance and is now trading in a strong uptrend, forming a series of higher highs and higher lows.
Ultra-long yields (20Y, 30Y, 40Y) are also pushing toward or testing multi-year highs, suggesting a continued steepening bias at the long end of the curve.
As long as the yield holds above its recent breakout zone, dips are likely to be bought by investors who expect further fiscal slippage and limited BoJ support.
Implications for JPY and Risk Assets
Rising long-term yields and fiscal worries can be a double-edged sword for JPY:
On one hand, higher yields can support the yen in theory.
On the other hand, if investors see Japan’s debt dynamics as increasingly risky, they may demand a higher risk premium and sell both JGBs and JPY.
For now, FX price action suggests that the yen is still under pressure, with markets more focused on fiscal concerns and the global rate backdrop than on BoJ normalization.
Trading Idea (Conceptual Only, Not Investment Advice)
Bias: Cautiously bearish on JGBs at the long end and still not convinced of a sustained JPY recovery.
For JGBs, any short-term pullback in yields toward previous breakout zones may be an opportunity for traders who expect further steepening.
For JPY pairs (e.g., USDJPY, GBPJPY), any rebound in the yen may be limited unless we see:
Clear signals of more aggressive BoJ tightening, or
A meaningful downside shock to global yields and risk appetite.
Key Risks to This View
A smaller-than-expected fiscal package or credible medium-term consolidation plan that restores confidence in Japan’s public finances.
A surprise hawkish pivot from the BoJ that tightens policy faster than the market currently expects.
A sharp global risk-off move that pushes investors back into JPY as a safe-haven currency and drags global yields lower.
Analysis by: Krisada Yoonaisil, Financial Markets Strategist at Exness

Those must be one of the best times to buy Cardano tokens [ADA]It very rarely happens that a coin similar to both BTC (UTXO model/limited supply) and ETH (programmable/smart contracts) has its bearish low lower than the last cycle's highest top.
Tech stocks are somehow related to Crypto tech tokens, Therefore BTC likes to correlate to other Alts, but for the longer-term BTC on itself is closer to Gold from the Store of value standpoint and medium of exchange (the lightning network has been developing rapidly recently).
The bottom line is sometimes BTC and crypto will correlate to gold and sometimes it will correlate to stocks, it's not one or the other only. The statistics are very clear that crypto is the most uncorrelated asset.
Keep in mind the global situation with Russia and Ukraine is somehow dragging the US stock market that was already long overdue to pop bubble sooner than later.
The situation with Canadian truckers only confirmed that storing BTC and any crypto on custodian exchange is a bad idea and breaks the purpose of decentralization, do keep your crypto off those central points of failure, and remember, those news are not negative for BTC and other cryptos, they are positive. Truly decentralized ledger blockchain technology cannot be stopped, govs can only block fiat on/off ramps, and even there people are getting smarter and more creative.
For the longer timeframes in my opinion any buy below 0.95 cents for ADA is a good buy, make sure not to wait too long, this thought has 5-year time horizon. Do not trade daily, it's a waste of time and money.

Full Reset before Full SendWhy March 2025 Could See New Highs
What's Happening Right Now?
Everyone is freaking out right now, but this is actually creating one of the best buying opportunities we've seen. Bitcoin is trading around $95,600 after dropping about 24% from its peak of $126,000 in October.
The Fear & Greed Index is at 10 (Extreme Fear) – and you know what they say? Be greedy when others are fearful. But, also, be patient and set limits.
The thing is, most people don't understand the economics behind Bitcoin or how liquidity actually works in crypto markets. We're playing a completely different game than stocks here.
The Real Cost to Mine Bitcoin (And Why It Matters)
Here's where it gets interesting. The big mining operations are producing Bitcoin for around $26,000-$28,000 per coin, while less efficient miners saw costs spike to $114,842 in October 2025... That's a massive range, and it tells you everything about where the floor is.
After the April 2024 halving, it now takes 854,400 kilowatt-hours to mine just one Bitcoin – that's about 81 years of electricity for an average home, just for one coin. That's a fun fact.
No smart miner is going to sell at a loss when they're paying that much for electricity and equipment (GPUs, etc). They'll just hold and wait. This creates natural supply constraints.
The Liquidity Trap
Right now, the market is in what I call a liquidity trap. As Bitcoin crashed from $126K down to where we are now, all the leveraged traders got wiped out. We saw $870 million in Bitcoin ETF outflows in a single day – that's both panic selling and intelligent, planned shorting, not fundamental weakness.
Here's what most people are missing: if Bitcoin drops to around $75K, it's going to unlock massive amounts of liquidity – I'm talking hundreds of millions, possibly billions of dollars that's currently locked up in long positions (Futures).
When those long get liquidated, the shorts will likely reverse their positions, that money floods back into the market and creates a supply shock. Basic economics: limited supply + sudden demand increase = price explosion.
Price Targets & When to Buy
I think we'll see $89K very soon – possibly this week between Monday and Wednesday (November 17-19, 2025). But here's my recommended strategy instead of trying to catch the exact bottom:
First Buy: $89K
Put in about 30% of what you're planning to invest. This is still a good entry even though it's not the absolute bottom.
Second Buy: $80K
Another 35% here. This is where things get really interesting from a risk/reward perspective.
Third Buy: $75K
The final 35%. This is the sweet spot where all that trapped liquidity gets released. Remember, demand increases as the price drops, and miners won't sell below cost. That's your supply shock waiting to happen.
What About MicroStrategy?
MSTR has crashed about 40% and is now trading at only 1.06 times its Bitcoin holdings, down from 2.7 times. The stock is around $200-$237 now, way down from its November 2024 high of $543.
My prediction: MSTR will probably hit the $140-$150 range, maybe even drop to $100-$120 (which is where it found strong support from March to September 2024). If we do see those lower prices, I'm going all-in on
MSTX
shares, not
MSTR
– the 2x leverage structure is better.
The Macro Picture
Fed rate cut expectations dropped from 90% to about 40%, which is why everything's selling off. But this is temporary sentiment, not permanent damage. The infrastructure is still being built, institutions are still coming in, and the fundamentals haven't changed.
Bottom Line
Be patient. Wait for the dips. Bitcoin will likely hit $89K this week, and from there we could see further drops to $80K and $75K. Each level is a buying opportunity. By March 2025, I expect we'll be making new all-time highs.
The key is understanding that crypto operates on different rules than stocks. Liquidity and supply dynamics matter more than anything else right now.
Good luck,
Terrapins

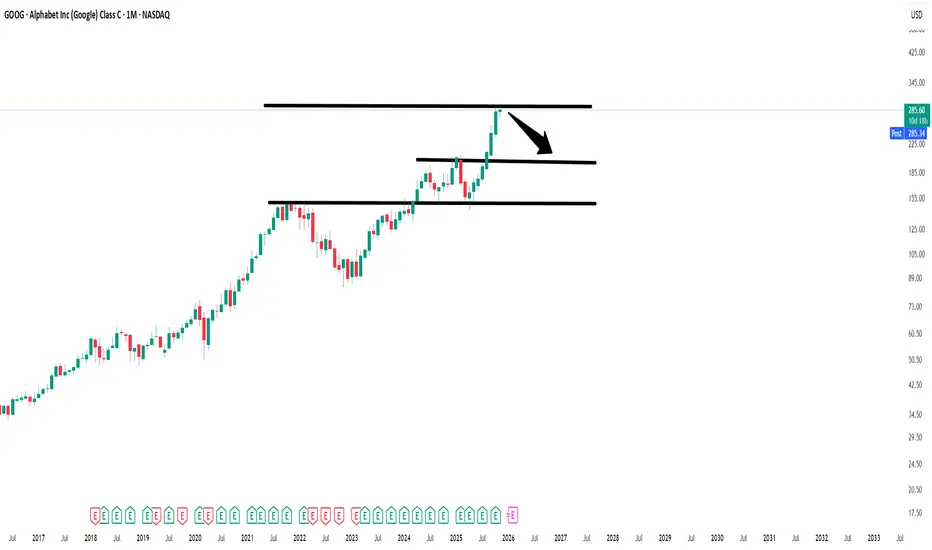
Even The Most Accomplished Make Mistakes $Goog [Berkshire]Berkshire Hathaway made an entrance into the Mag 7 (Excluding Apple) with its purchase of Alphabet / Google I believe that this was a mistake solely based on the fact that the majority of the tech industry is extremely overvalued. While Googles Valuation at least in my opinion is justified considering how strong Its business model is with its High Margin Reoccurring Subscription models (Google Cloud),(YouTube Premium),(Google Workshop),(Google Play) to name a few and how Dominate it is in Ads with YouTube / Chrome. It also Dominates Web Search let alone the majority of people saying they will "Google something" it sounds stupid but its a good mental metric on how people think of search. Google has built Search / web ecosystem to complement each other and force you to use there services in one way or another you are using there web ecosystem everyday from Google maps, to Google Docs or Gmail, they made you dependent on there services, Especially the younger generation (GenZ) is growing very dependent on Google Maps which may be free but shows you the grip they have on peoples web use. The Primary issue I have with Berkshire Hathaway entering at these prices is generally the markets are indiscriminate if the mag 7 or tech industry has a red day no matter how strong Google may be that will bring them down too.
-----------------------
My Personal Thesis on Google:
I am very bullish on several areas of Alphabet Including but not limited to Google Cloud, YouTube, Its subscription Services, Its high Margin software business model. Most Importantly to me is There Robotics Section Deepmind and Gemini Robotics. Robotics is underappreciated and my personal belief is that it is the Next AI like boom but we are very early to this. Robotics has use cases in every industry from Solving lack of labor issues and an aging workforce / population especially in western countries Robots can easily pick up this slack and they will greatly benefit from Artificial intelligence Google / Alphabet has the money and cashflow to heavily invest in this area maybe not creating the physical humanoid robots but they can definitely excel in the software section of it. Segments like Waymo are also interesting and bullish. Google is also massively profitable has very little debt, and an extremely solid balance sheet.
-----------------------
Risks:
I Believe the biggest Risk for Alphabet once again is that The American Tech Sector is extremely Overvalued, I Also See moderate amount of risk being that Google is such a monopoly that leaves it open for Antitrust Suits.
-----------------------
Business Model:
Google Is Vertically Integrated its Business was closely tied to the AI Boom being one of the Big 3 with its AI spending. People Disregard its extremely impressive moat it possesses having one of the strongest moats in tech let alone in the history of business.
-----------------------
Fundamentals:
Cash: US$98.50b
Debt: US$26.60b
Equity: US$386.87b
Total Liabilities: US$149.60b
Total assets: US$536.47b
Net Margins: 32.23%
-----------------------
Metrics:
Return On Equity: 32.1%
Return On Assets: 22.5%
Return On Capital Employed: 28.8%
-----------------------
Valuation:
Price to Sales: 8.9x
Price To Earnings: 27.7x
Price To Book: 8.9x
-----------------------
Disclaimer: I am not Initiating buy, Sell or Hold Opinions. I Only make these posts for Conversation. I am not a financial Expert or an Analyst.
Fear & Greed Index — Rebuilt as a Macro Oscillator for CryptoThe Fear & Greed Index is everywhere — a popular way to gauge market sentiment.
But it's usually just a mix of volatility, momentum, and social buzz...
📉 Not exactly macro.
This script is a technical reinterpretation of the Fear & Greed concept — but grounded in real, measurable economic behavior .
🧠 The Core Idea
This indicator is powered by the Copper/Gold ratio , a time-tested signal used by economists and institutional traders to track macroeconomic cycles:
- 🟢 When Copper outperforms → the economy is likely expanding → risk-on → Greed
- 🔴 When Gold outperforms → the economy may be contracting → risk-off → Fear
Copper represents industrial growth , while Gold signals defensive capital flows .
We track this ratio over time using a Z-Score oscillator to identify when sentiment is statistically stretched in either direction — highlighting moments of macro-level greed or fear.
📊 Why It Matters for Crypto
Crypto doesn’t live in a vacuum.
It's highly sensitive to the broader risk environment.
This oscillator gives you a macro lens to help:
- Anticipate bullish or bearish shifts in crypto markets
- Avoid common emotional traps at sentiment extremes
- Build entries or exits around macro confluence zones
It doesn’t tell you when to buy or sell — it tells you when the market context is shifting .
🔧 How to Use It
- Watch for the Z-Score entering > +2 (Greed) or < -2 (Fear)
- Use it to confirm broader risk-on/off behavior
- Combine with BTC or ETH price for potential lead/lag relationships
- Customize the tickers to test other macro pairs (e.g. SPX/VIX, BTC/DXY)
📈 Built with Pine Script v6
🔍 Default Tickers: CAPITALCOM:COPPER vs TVC:GOLD
📦 Fully customizable inputs, clean visual design, alert-ready
💡 Use this to trade with context — not emotion.
If you found this useful, give it a like and drop your feedback or improvements below 👇

Privacy is Pricy Again — How Zcash Got Back in the GameA significant shift is recently observed in the cryptocurrency space, indicating a resurgence of interest in privacy. The sharp rise of Zcash (ZEC) — over 46% in the week following Galaxy Research's analysis — is a clear example of this trend, reflecting the market's demand for untraceable funds.
Zcash, after years on the sidelines, has returned to the forefront, confirming that the fundamental cypherpunk ideals of privacy hold high value in the modern financial system.
1. Technological Breakthroughs and Zcash’s Fundamental Growth
The Zcash rally is driven not only by speculation but also by major improvements that have made privacy both more accessible and more effective:
Removing Barriers (Zashi & NEAR Intents): The use of zk-SNARKs (zero-knowledge proofs) has become more user-friendly. Enhanced user experience (UX) in new wallets (like Zashi) and integration with cross-chain mechanisms like NEAR Intents have removed the technical friction associated with "shielding" transactions.
Strengthening Anonymity: The most crucial network metric for Zcash is the increase of shielded coins in the Orchard pool to over 30% of the total supply. The more coins are "hidden," the larger the anonymity set becomes, which mathematically increases the difficulty of tracing transactions.
Technological Edge: Zcash, unlike some competitors, offers quantum-resistant cryptography and a stronger privacy mechanism via zk-SNARKs, which allows transaction validation without revealing the amount, sender, or receiver.
2. Zcash as a Counter-Trend to Transparency
The sharp price increase of ZEC after years of stagnation reflects a broader market narrative:
Reaction to Institutionalization: Against the backdrop of Bitcoin's growing transparency and institutionalization (ETFs, centralized custodians), Zcash is positioning itself as “encrypted Bitcoin”—an asset that refocuses attention on the decentralized and private nature of crypto assets.
Regulatory Balance: Zcash utilizes optional privacy, which, according to analysts, may provide the project with greater regulatory resilience compared to coins where privacy is mandatory by default.
Repricing Privacy: The market has demonstrated that the demand for confidentiality has not disappeared. The Zcash rally has forced investors to re-evaluate all privacy-focused projects, proving that, amid increasing online surveillance, the ability to transact privately has once again become a highly valuable feature.
Summary: Zcash is back in the game, bolstered by strong technological improvements that have made its privacy accessible and effective. The sustained nature of this growth will depend on whether the project can convert this speculative momentum into stable growth in user and network activity.

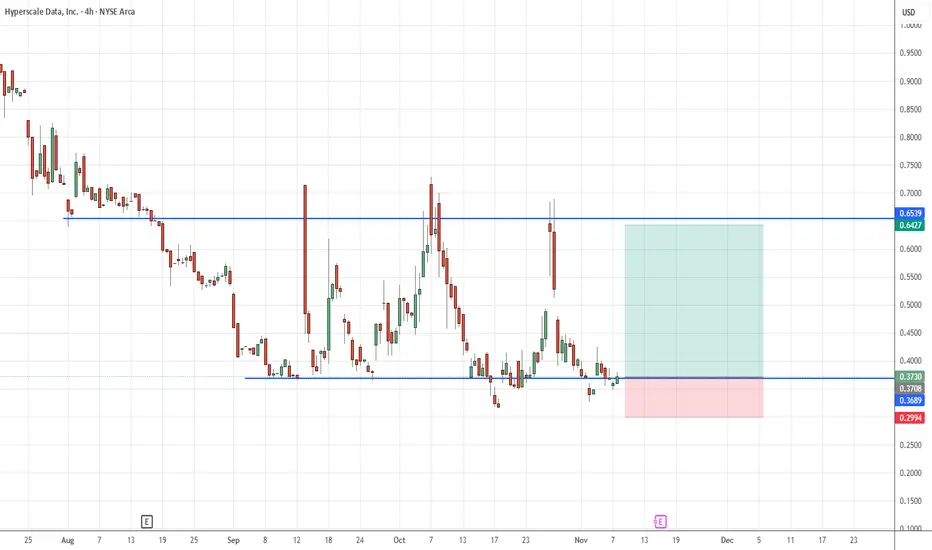
GPUS: Range Bound & Undervalued!AMEX:GPUS is quietly stacking value while trading in a range. At $0.35–$0.37, it's 61% below the estimated NAV of $1.02/share backed by $122M in cash + BTC vs. just $118M market cap (Nov 6 update).
Do your own research and trade at your own risk.