What Is Value at Risk, and How Do Traders Use It in Trading?What Is Value at Risk, and How Do Traders Use It in Trading?
Value at Risk (VaR) is a widely used risk metric that helps traders and institutions estimate potential losses over a given timeframe. By quantifying downside risk, VaR provides a structured way to assess exposure across different assets and strategies. This article explains the VaR definition, how it’s calculated, and how traders use it in real-world markets to refine risk management.
What Does VaR Stand For?
So what is Value at Risk? Value at Risk, abbreviated to VaR, is a statistical measure used to estimate how much a trader, portfolio, or institution could lose over a set period under normal market conditions. It provides a single risk figure, making comparison of different assets, portfolios, or strategies more straightforward.
VaR is defined by three key components:
- Time Horizon – The period over which the potential loss is measured, such as one day, week, or month.
- Confidence Level – Expressed as a percentage, typically 95% or 99%, indicating the probability that losses will not exceed the calculated VaR amount.
- Potential Loss – The estimated maximum amount or percentage that could be lost within the given timeframe, based on historical or simulated market movements.
For example, if a portfolio’s Value at Risk has a one-day 95% risk estimate of £10,000, it means that under normal conditions, there is a 95% chance that losses won’t exceed £10,000 in a single day. However, the remaining 5% represents extreme events where losses could be greater.
VaR is widely used in trading, portfolio management, and regulatory frameworks because it quantifies risk in monetary terms. It helps traders set position limits, assess exposure, and compare risk across different assets. However, while VaR is useful, it does not account for rare but extreme losses, which is why it’s often combined with other risk measures.
How Value at Risk Is Calculated
There are three main ways to calculate VaR, each with its own approach to estimating potential losses: the historical method, the variance-covariance method, and the Monte Carlo simulation. Each method has strengths and weaknesses, and traders often use a combination to cross-check risk assessments.
1. Historical Method
This approach looks at past market data to estimate future risk. It takes the historical returns of an asset or portfolio over a given period—say, the last 250 trading days—and ranks them from worst to best. The VaR is then set at the percentile corresponding to the chosen confidence level.
For example, in a 95% confidence level VaR calculation using 250 days of data, the worst 5% (12.5 worst days) would indicate the expected loss threshold. If the 13th worst loss was £8,000, that would be the VaR estimate. This method is simple and doesn’t assume a normal distribution, but it relies on past data, which may not capture extreme events.
2. Variance-Covariance Method
The Variance-Covariance (VCV) method assumes that potential returns follow a normal distribution and estimates risk using standard deviation (volatility).
One of the main advantages of the VCV method is its simplicity and efficiency, particularly for portfolios with multiple assets. However, its accuracy depends on the assumption that potential returns are normally distributed, which may not always hold, especially during extreme market conditions.
3. Monte Carlo Simulation
Monte Carlo simulations generate thousands of hypothetical market scenarios based on random price movements. It models different potential outcomes by simulating how prices might evolve based on past volatility and correlations. The resulting dataset is then analysed to determine the percentile-based VaR estimate.
This method is more flexible and can handle complex portfolios but is computationally intensive and requires strong assumptions about price behaviour.
How Traders Use Value at Risk in Trading
Traders use Value-at-Risk models to measure potential losses, manage exposure, and make decisions about position sizing. Since VaR quantifies risk in monetary terms, it provides a clear benchmark for setting risk limits on individual trades or entire portfolios.
One of the most practical applications of VaR is in position sizing. A trader managing a £500,000 portfolio might have a risk tolerance of 1% per trade, meaning they are comfortable with a potential £5,000 loss per trade. By calculating VaR, they can assess whether a given trade aligns with this limit and adjust the position size accordingly.
Hedge funds, proprietary trading firms, and institutional investors use VaR to allocate capital efficiently. If two trades have the same expected returns but one has a higher VaR, a trader may adjust exposure to avoid exceeding risk limits. Large institutions also use portfolio-wide VaR to monitor overall exposure and assess whether they need to hedge positions.
Another key use is stress testing. Traders often compare historical VaR to actual market moves, especially during volatile periods, to gauge whether their risk model holds up. If markets experience larger-than-expected losses, traders may refine their approach by incorporating additional risk measures like Conditional VaR (CVaR) or adjusting exposure to tail risks.
Ultimately, VaR is a risk filter—it doesn’t dictate decisions but helps traders identify when exposure might be higher than expected, so they can adjust accordingly.
Strengths and Limitations of VaR
Value at Risk is widely used in trading and portfolio management because it provides a single, quantifiable measure of potential loss. However, while it’s useful for assessing risk, it has limitations that traders need to be aware of.
Strengths of VaR
- Straightforward risk measure: VaR condenses complex risk exposure into a single number, making comparison of different assets and strategies more straightforward.
- Applicable across asset classes: It works for stocks, forex, commodities, and fixed income, allowing traders to standardise risk assessment across different markets.
- Useful for position sizing: Traders can align their risk limits with VaR calculations to try keeping exposure within predefined boundaries.
- Regulatory and institutional use: Banks and hedge funds use VaR to comply with risk management regulations.
Limitations of VaR
- Does not account for extreme losses: VaR shows the potential loss up to a given confidence level but does not measure tail risk—severe market events beyond that threshold.
- Assumes normal market conditions: Some VaR methods rely on historical data or normal distribution assumptions, which may not hold during volatile periods or financial crises.
- Sensitive to calculation method: Different approaches (historical, variance-covariance, Monte Carlo) can produce different VaR figures, leading to inconsistencies in risk estimation.
- Past data may not reflect future risks: Markets evolve and historical price patterns may not always be reliable indicators of future behaviour.
Because of these limitations, traders often combine VaR with other risk measures, such as Conditional VaR (CVaR), drawdowns, and volatility analysis, for a more comprehensive risk assessment.
Real-World Examples of VaR in Financial Markets
Value at Risk is used by traders, hedge funds, and financial institutions to assess market exposure and manage risk. It plays a key role in everything from daily trading operations to large-scale regulatory compliance.
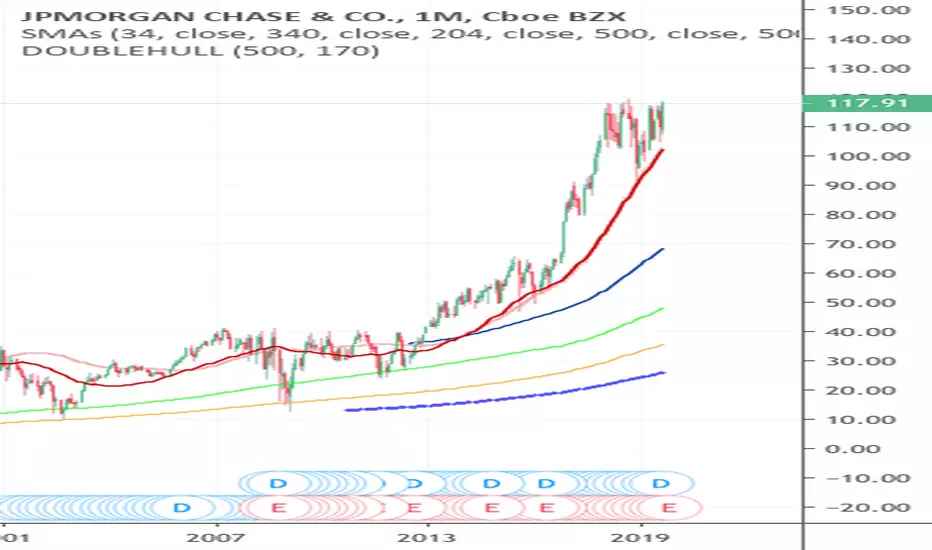
J.P. Morgan and the Birth of VaR
VaR gained prominence in the 1990s when J.P. Morgan developed its RiskMetrics system, which set a standard for institutional risk measurement. The firm used VaR to estimate potential losses across its trading desks, providing a consistent risk measure for its global operations. This approach became so influential that it was later adopted by regulators and central banks.
Long-Term Capital Management (LTCM) – A VaR Misstep
It’s believed that the reliance of the hedge fund Long-Term Capital Management (LTCM) on VaR to manage its highly leveraged positions in the late 1990s led to the fund’s collapse. While its models suggested limited downside risk, LTCM’s reliance on normal market conditions led to catastrophic losses when a position in Russian debt unravelled. The fund’s VaR calculations underestimated extreme market moves, contributing to a collapse that required a $3.6 billion bailout from major banks.
Goldman Sachs During the 2008 Crisis
During the 2008 financial crisis, Goldman Sachs relied on VaR to monitor trading risk. At the peak of market volatility in late 2008, its daily VaR jumped significantly, highlighting the increased risk in its portfolio. The firm adjusted exposure accordingly, reducing positions in high-risk assets to manage potential losses.
The Bottom Line
Value at Risk provides traders with a clear, quantifiable measure of potential losses, helping them manage exposure and refine risk strategies. However, while useful, it is combined with other metrics for a more complete risk assessment.
FAQ
What Is VaR?
The Value at Risk, or VaR, meaning refers to a statistical measure used to estimate the potential loss of an asset, portfolio, or trading strategy over a specific timeframe with a given confidence level. It helps traders and institutions assess market exposure and manage risk.
What Does VaR Mean in Trading?
In trading, VaR quantifies the potential downside of a position or portfolio. It provides a single number that represents the maximum expected loss over a set period, such as one day or one week, under normal market conditions.
How to Calculate Value at Risk?
VaR is typically calculated using three methods: historical simulation, which uses past market data; the variance-covariance method, which assumes a normal distribution of potential returns; and Monte Carlo simulation, which generates potential future price movements to estimate risk.
What Is a VaR Strategy?
A VaR strategy involves using VaR to set position limits, manage exposure, and allocate capital efficiently. Traders and institutions often integrate VaR into broader risk management frameworks to balance potential risk and returns.
What Does 95% VaR Mean?
A 95% VaR means there is a 95% probability that losses will not exceed the calculated VaR amount over the chosen period. The remaining 5% represents extreme market events where losses could be higher.
This article represents the opinion of the Companies operating under the FXOpen brand only. It is not to be construed as an offer, solicitation, or recommendation with respect to products and services provided by the Companies operating under the FXOpen brand, nor is it to be considered financial advice.
Valueatrisk
Gold & silver longs Based on history, silver follows gold pricing as well as charts very closely on average. Based on the fact that nothing has been truly settled and the dollars power has recently gained. It is opening up a perfect time to get in as ride the up swing just wait for the MAC D for example to switch directions heading up. Based on the time of the charts. Indicators are starting to show. That the down trend is slowing, shifting to the upside again. TTCF is a stock with great things happening also that had a high spike today. You do not always have to buy and hold or sell you can watch a few charts looking for a upward momentum about to happen. Once you see the confirmation ride the swing then get out if you are worried about the he takes of selling then that will be your downfall. I am fairly new to really studying the charts but hey will tell you the news before it happens. I also will be pulling out shortly for a while. I will post a better trend as well as a few charts as to why. That’s just me personally but if you are newer I used a lot of indicators that helped me at first changing the chart type…..

The Secrets to Forex & The Chrysopoeia MarketThe original article will be short and basic, like what you see in the mirror. It's just the supplementary reading to the prior article on technicals, it's the part seven point five. The emphasis is on what TO AVOID when conducting research or pursuing a technical indicator catalogue. There are thousands of dead end indicators, many of which are borderline timescams. These snake oilers will get the rope (in minecraft). Verily, as Jupiter smite Carthage, so shall Jupiter smite charlatans.
Saving you money has always been the goal of this series, it's about paying the right price, if you have to pay at all. That's the essence of risk management in markets, and real life.
And just look around you, risk management becomes a more useful skill everyday.
Part 1: Arcanum Capitalismus
Alchemists were obsessed with transmuting generic metals into precious metals, like gold. The ideal panacea to cure any disease, the potion to immortality... As with any 'perfect' solution oriented business, the offering always seems to perfectly meet the demand. This 'convenient certainty', is only certain insofar as it transmutes wealth and time out of your possession and into theirs. Today, these alchemists are in the business of translating the unprofitable into the profitable. You see them everyday. Their alchemical signs and circles and symbols, are on every screen and every wall of any geometry. Some people even wear them. Some low test people practically worship them. All designed to summon something from your wallet, as far as you understand it.
Not much has changed, except that there are more alchemists or magicians than ever before. They never managed to profitably turn lead into gold, but they found a much better method somewhere along the way.
Part 2: The Most Dangerous Predator
Not every product is a predator in disguise. But how do you tell the difference?
If it looks to good to be true, it usually is. Remember, 'convenient certainty' is far too convenient in this uncertain world and it's market. And that the most dangerous predator always camouflages itself to its prey (something a very large portion of the western world comically fails to realize). This is true in the real world just as it is in the market world. And it is just as overlooked in the real world as it is here.
This is the too-good-to-be-true threat vector I will be discussing in this article. I touched on wealth gurus in a prior article, but this covers a more comprehensive explanation, particularly with regards to common indicators or technical systems that present false certainty (many of them, coincidentally, originated as commercial systems).
Now, I should note that these are not necessarily designed for fraud, but often accompany fraudulent strategies, strategies with false or impossible claims. Sometimes the hoodwink is admitted in the footnote, almost Snopesian in the duplicity: "there is some repaint with XYZ, true, but considering 'our editorialized context' of the trading strategy, the system/indicator overall does not affect the trading decisions" etc.
So how does this fit into the article series? Not using deceptive and dangerous indicators will save you retail initiates more money than almost any other risk management tool.
As a friend from out of town once told me: "There are so many electrons out there, you just can't trust them all."
Part 3: Race to the Bottom
This isn't everything to watch out for, but let's start with the basics.
1. Anything that repaints or recalculates beyond 2 - 3 bars or calculates on higher timeframes EXCEPT regressions.. These are the MiniTrue indicators, erasing history to satisfy the present; fashionably 2020. Zigzags, TMAs, fractals, etc. Notably, divergence and trend line indicators can repaint, but are occasionally valuable if you time them with macro or geopolitical events, which we will talk about in point 3.
Others can be hard to determine at times. Backtesting or strategy tester simulations DO NOT always identify repainting behaviors. Look for indicators made by retail coding legends like mladen or MrTools to avoid this issue. Or, if using TV, be mindful of comments about pinescript issues, which can cause recalculation. In the early days of TV, back when you could have all the features for free, there were far fewer community indicators available, and many subtle repainters nestled below the top ranked Chris Moody productions. While ranking and upvote systems can prevent the repainters from becoming overly visible, those systems do not always exist elsewhere on the internet (like telegram, instagram, or youtube). The veblen class of hylic automatons are always 'dancing' and 'singing' some profit or praise on those sites; be especially wary of their signal system or technical indicator offerings. They are an embarrassing class of alchemist.
Which is why, unless you have several years of seasoning behind your trading you should avoid:
Anything being sold to you on telegram.
Anything being sold to you on instagram.
Anything being sold to you on youtube.
Any MT4 algo expert that ISN'T designed for basic alerts or order management.
Sold means cash value, but free is not much better. A free indicator can cost you more money in loses than a paid indicator that fails less. We will talk about the real market value of time and intellectual resources in the last article.
2. Gann Angles/Elliot Waves/Harmonics/etc.. The issue here is competitive edge, if you see a clear-cut pattern on a higher timeframe like 4h, the setup has been built across several weeks. As a result, 10s of thousands of other traders and algos have seen it as well. This reduces the edge potential and introduces a lot of price action variability at the 'precise' entry point that many of these shape systems require. Thus, instead of getting your ideal entry, you might find yourself down 40 pips because a whale shorted your obvious setup. Your stop loss is chased and hit, and at some arbitrary point later, the pattern completes itself as predicted, just without any of the implied precision that drew you to the pattern system in the first place.
Autochartist data shows that a return to a commonly hit level has the highest probability of occurring, a slightly tautological realization but useful nevertheless. In other words, returning to a major resistance or support level (even if it was broken before), is the ultimate 'pattern' setup. This is not too far off from /CPG/, since this level will usually be near a large whole number. This is effectively the simplest pattern, and one you should prioritize if you want to add patterns to your /CPG/ analysis.
3. Double Tops/Head and Shoulders/etc.. More compelling than the above, but suffer in different ways. These patterns will principally attract the greediest of retail traders. It's good to be in the company of the greedy if they have evidence of success (thick pockets), but greedy beggars are not the leaders you want to follow. The perfect entry (from an /EX/) into the start of a mean reversion trend (/FLOW/ into /CPG/) is obviously attractive at first. But the higher the timeframe, the more obvious, and the better the opportunity for the Davosian men and women to add to their long-term positions. You cannot rely on chasing better fitting setups without running into the risk of losing edge potential (because other competitors will see it) and because your available pool of setups decreases (your overall gross income drops & you have to freeze capital during the setup scan phase). Meanwhile, the risk of trading a fake top into a trend continuation remains the same without applying non-technical analysis.
The net takeaway here is that, while those pattern setups may result in a greater than 50% chance of predicting a new trend genesis, they don't guarantee an advantageous money management outcome; and thus, they don't add much to your chances of becoming a professional trader. You may think: "well if I just reach for a further TP, it will offset the downsides" (cost of few setups, frozen capital for setup scan phase, and volatility at obvious pattern completion). You have no way of knowing how far the new trend will go, nor do the patterns necessitate or facilitate the length of the trend (in pips). The only way to offset the insured downside risk is by selecting for macro or geopolitical events. In those cases, even if the setups are obvious from a technical standpoint, other factors outside the market will insure your edge against traditional competitive factors. This is because macro/geo events draw in tactical open interest bumps from newly enfranchised investors who break prior market ecosystem paradigms and generate new trends. We will talk more about that in the next article on intra-day, because open interest is the magic to intra-day trading that carry/dividend is to multi-day trading.
4. Signals.. Most signals or basic arrow technicals have a low winrate (in the 40s or 50s) and a rate of return that doesn't include fees/spread (these have a higher 'operating cost' with lower 'profit margins'), while running without stop loss OR/AND with substantial drawdown (which means their rate of return has an expectancy of literally anything if they don't specify your necessary account size and position risked amount, IE your risk of ruin, which we will talk about later).
Those that are held multi-day do not account for carry conditions and fees (which add up significantly if your signal is one of those -7 to +7% a month color carnivals). They don't account for event risk, usually. And worst of all, they provide little investor guidance. Legally speaking, they are not money managers, so they have almost zero explicit liability nor any implicit requirement to deliver research and forward looking information about the operation of the signal and how it can affect your funds. Communication is a form of commerce and you aren't getting your fair share. As a result, most people just take their cash out or cancel the signal after a losing streak (even if the hypothetical system would go on to perform well in the long run).
For the record, the best would run on high ATR pairs, run only at certain times of day, and take advantage of currency correlation, but generally you should just avoid.
5. Moving Average Crosses/Convergence divergence.. There are thousands of these, in many different styles. They will suffer from low ATR periods and whipsaw issues, where you win during a week long market regime but lose during another. They tend to be overfitted from backtesting, resulting in the rapid dropoff of edge unexpectedly. Ehler's Optimal Filter or VWAPs will rarely suffer these issues comparatively, but you can't use them to enter trades without considering /CPG//EX//SEA/ comprehensively anyway.
6. Discount VaR.. VaR gives percentage risk, which can help with planning very long-term trades in response to client needs. But not in forex.
Remember that black swan and event risk is true volatility, (often called tail risk) which is not properly measured in VaR, which is why VaR is just an introductory tool for technical trading in forex (unlike in options or stocks). VaR, despite being commonly discussed online, is slowly being replaced with other methods like 'expected shortfall' (in part due to regulation updates from banking risk groups like the Basel Committee).
You can use it, but you need to use it sparingly. Some people will find this very controversial. It's not just reddit Dunning-Krugerists giving me fluoride stares right now, even people with successful backgrounds in trading or investing will take issue with this. Let me explain. Or you can skip the following 2 paragraphs if you have a 3 star or lower rated brain.
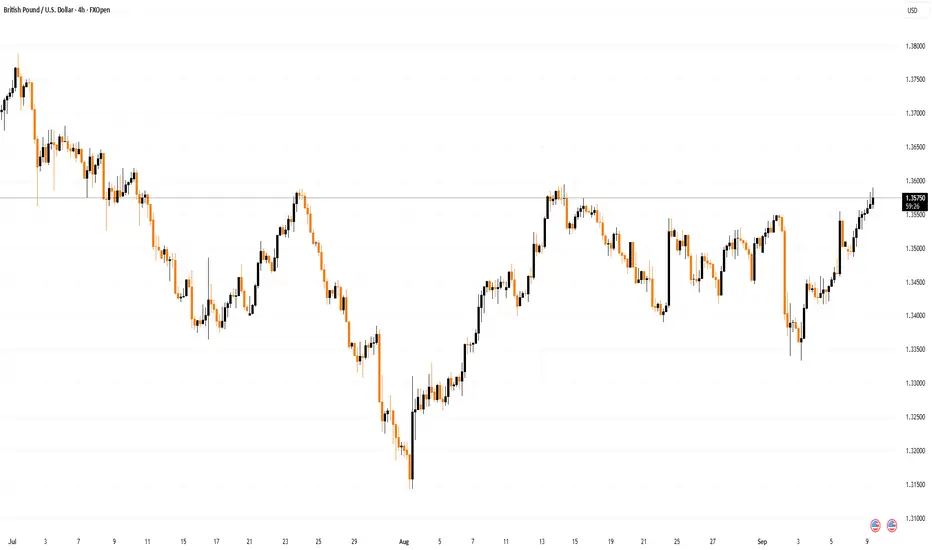
VAR doesn't make as much sense in forex, mainly because you should be using stop losses, and because upside/downside risk is unlimited in exposure . Forex, unlike most other assets, has uniform directional risk biases (unprejudiced bidirectional behavior in theory). For instance, a short on a stock will always have a slightly higher risk than a long, because a short leaves you exposed to unlimited risk while a long leaves you exposed to current price over 0 (the market cap represents the full current possible risk value expressed in dollars for all longs in that outstanding share universe). IE, on a 100$ dollar stock, you can only lose 100 per share (so long as you own the stock), you aren't liable for things you don't own when you trade real assets instead of derivatives. Forex is technically a futures product or commodity market but usually exists as a contract for difference, a cut and dry derivative. There is no theoretical zero (before calculating broker entanglement), so you are exposed to unlimited risk on both sides of any trade, which is the first reason why VaR may not be useful.
The second is due to the continuous rollover component of currency exchange combined with the above. Once the biggest trading orders are filled, there may be substantial jumps in price to find the next area of demand on the market profile. Orders that were placed but not filled weeks or months ago. In other words, under special circumstances, the nearest next area of demand could be extremely distant. This occurs during interest rate decisions or major estimation errors, where price will jump 5-6-7 standard deviations away from the safety area of the normal distribution, far more than any other major asset class. It's like using VaR to manage risk on a penny stock.
"But a POINT OH OH OH OH OH ONE chance of something happening is irrelevant.."
Now imagine trading 6 hours a day for 30 years as a career. A normal distribution is like a hill, in forex, the actual distribution is more like a hill with pillars on both ends, it doesn't fit the formal logic that stats require of it to be conventionally useful. Most investors plan for 2nd or 3nd deviation movements at best, 6 or 7 would require unreasonably exponential increases in account size (billions or trillions of dollars). VaR is often derived from historical models. In other words, all previous market data. Now, I recommended utilizing historical models in prior articles, but only as a component of /EX/ in support of /CPG/. You need a more expanded interpretation to manage those 'pillars.' That's what I introduced with the /EX/ technicals and their dependence on fundamental approaches. Keep in mind that what VaR does, what it really does, is demonstrate the fallibility of all portfolios or firms as a numerical figure. It proves that they can lose. And lose big. Therein lies its more useful function. Nothing is fully risk-free. You either learn this now, or you learn it the hard way.
I have several 'delta-neutral' cross market strategies that exploit FCF theories to result in outcomes that seem broken, overpowered, or even unethical, but even they are at risk to tax changes, stagflation, and politics. Ultimately, adaptability is the only investment product that always wins.
7. Fibonacci.. As a friend of Fibonacci, it pains me to pan this popular tool. It can help, on higher time frames with clear highs and lows or with a daily calculation, but generally you are just mistaking the 61 or the 50 for the VWAP or Major Moving Average /CPG/. Fibonacci in basic support of other indicators is the only viable use. It's often a redundant tool.
8. Tick volumes.. Technically these are "volumes," though they are not real in the sense they do not capture open interest behavior in the same way volume from a centralized exchange would (one with little counter-party risk). It's not necessary to get too deep into this, just assume your tick volume is broker siloed and not necessarily a proper estimation of the broader population of forex transations.
I could continue here with an iterative approach and probably hit 20 or 30 points, but this covers many of the biggest villains. The rest can be clustered as /EX/ problems.
Part 4: Implicate to Explicate?
/EX/ fitness is a potentially catastrophic problem that undercurrents most of the remaining subprime technicals.
While technicals for finding /EX/ from my designated list can be effective intra-daily or within a week at least, most others will not. And the best tools for extremes will come from macro and geopolitical sentiment and events anyway. In other words, they will show if your technical /EX/ levels will hold. They will show you your turning points. Give them priority over finding the perfect /EX/ technical. Use them in conjunction with seasonality and historical models and you will have connected the past with the present, securing you the future. Doesn't guarantee edge, we haven't gotten that far yet, but it does protect your downside.
Finding all this data is no easy task though, and will usually come at the cost of your R&D budget. In other words, be prepared to fork out a few monthly subscriptions to get it. The vast majority of traders that made it for a living had to spend some to get some.
'The past writes the rules, the present tries to break them' is a good thought framework to understanding /EX/.
Speaking of rules.
Part 5: ONE, NOTHING WRONG WITH ME
Also, one of my prior articles on fundamentals (Happening Default Swaps) was censored by the jannies for very hurt feelings. Amongst all that is woeful in this world, the Tragedy of the Jannie remains indestructible.
I will set up a contingency so new readers can see all articles in a clear and organized fashion.
Let's wrap this up Normans.
Part 6: Real Magic
Money is the real magic in this world. At least, for the most part. If you have learned anything in this series, it's that the conventional system of trading (the charts, indicators, buttons, and lights) are a small part of the game. That the 'indicators' exist all around us, as symbols, as people, as words, as ideas. Transmuting or translating all of these lines and angles and feelings and geometries is your chief effort before dipping your hand into the flow of wealth and energy we call a market. This means you are a researcher first and foremost. A philosopher. A critic. A survivor. And especially, a competitor.
"But instragram trader BigBooba69 dropped out of community college, and has a lambo, and has great PSD thumbnails; he's the last person I would consider a researcher.."
You aren't trying to solve the mysteries of the world, you're just trying to solve the mysteries of your shrinking networth. Comparatively speaking, your research project is easy. But it's still research, and curiosity and experimentation, nevertheless.
You didn't think it was all towers and textbooks?
Part 7: The Plane of Materialism
Price is a type of spell, drawn by the alchemists of materialism, to summon your 'energy and nutrient flows' into a pattern of behavior that has some kind of effect on or in the greater ecosystem. Which is why, in the words of Buffet, "You are what you eat" or actually it was: "price is what you pay, and value is what you get." Be careful of the price you pay, it is often too high; and sometimes, suspiciously too low.
The 'great work' of risk management is an ongoing process, it unfortunately means you part with your money at a time and place of choosing.
Make sure its (you) making the choice.
------------------------------------------------------
This is repost of the technical list from the last article, but without the editing issues. In addition, at the bottom, I have some forward guidance provided for the articles yet to come.
Part 9: Technical List
Major Round Numbers /CPG+EX/: A big psychological supplement, measured in increments of 100 pips. Important that the round level has a 25+/- Pip attractor, so keep that in mind when adding round numbers to your measurement. It is easier to remember round numbers and they are more often repeated/identified in financial news (bloomberg feeds and reuters feeds, etc) from sources used by commercial/institutions/major funds. As far as this numerology is concerned, always remember to checkem.
Random Walk /FLOW/: A major identifier of pattern flow. This indicator is the purest example that the market is, in fact, very inefficient for meaningful periods of time. It's inefficient because it should remain near or at the /CPG/.
Historical Models/Seasonality /CPG+EX+SEA/: VaR limitations considered, I recommend using historical models loosely, simply because they offer some predictive explanation and a visual guide. They should not be used or expected to measure or anticipate black swans. Many of these are paywalled, but you can find free services via google. Since it is a major source of seasonality assessment, this is strongly recommended. Most give a daily open or close level, and a minimum and maximum price level for the day. These models are not useful for intra-day trading, but become more useful the longer-term your position is planned to be... keep that in mind. If you have a programming/statistics background, there is significant opportunity in developing historical models for retail and NNW clients (non-rich people). The granularity of historical models tends to be limited, like that of seasonal values (which tend to be multi-daily at best, but usually weekly or monthly). Find a way to make it intra-daily or even per session and you could print some serious money. How do I know this? Because it would be my money paying you.
Major Moving Averages /CPG/: The most important indicator for determining /CPG/ due to the 'market players making markets' rule. HAS TO BE THESE VALUES: 50/100/200 at 1h, the 50/100/200 at 4h, and the 50 or 55/100/200 at D; those are the most important that every trader should use. These are integral to determining /CPG/, mainly because of their psychological value and relevancy, and when combined with round numbers, offer the strongest psychological technical representation in the market outside of seasonality and COT sentiment. They are usually insufficient for /FLOW/ since they are lagging (from high periods), but serve as gravitational levels individually, and also when viewed compositionally. That is, the full range between the highest and lowest can offer a likely zone for current /CPG/. You can refine that zone further with round numbers, VWAP, a regression, and so on.
ADR/ATR /EX/: The most important indicator for determining extremes; it is loosely derived from VaR and historical modelling ideals; but exists in many different forms and is often graphed to the daily timeframe. It is additionally powerful in a session format, that is, as an NYC session ADR/ATR and so on. You should at least be using ATR to calculate daily extremes (ADR), weekly extremes, and monthly extremes. These levels effectively represent the pip range possibility of any pair. Conversely it demonstrates the total range a pair can move based on the traditional influence of market supply and demand. It's like knowing 'how much' money is flowing through your pair, which is important because there is a limited amount of money available and willing to be used for trading, thus implying a degree of certainty in the limit of price action (its range). You can think of this cash like energy/nutrient flows; there is a limited amount contained within an ecosystem (sans supply from the Sun) so you know that the ecosystem can only grow so large based on the limited supply of energy available for transfer. ATR+ADR is one of the best measures of volatility. It's the closest thing to true VOLUME you will get without getting privileged access to prime brokers or settlements providers like the CLS Group. What this range measurement enables is a PREDICTION with DECENT CERTAINTY of how far the price could move within a day, within a week, and within a month. Remember, artifacts of certainty are highly desirable in risk management because so much of trading is based on delusion. It is an approximation of total influence on the market that an event can cause.
Regression /CPG+EX+FLOW/: This is more effective than a basic channel. Use this for additional visualization guidance; can help determine the angular change in price, a useful measure for detecting the development of new patterns, similar to VWAP. (especially if you have many iterations of regressions running, visualizing shifts in 'angular frequency')
VWAP /CPG+FLOW/: A resource heavy computation, look for weekly and daily VWAPs.. we will talk more about vwaps in the intra-day section, because they have important overlap with session psychology due to institution order implementation strategies. This is one of the most powerful /CPG/ measuring tools to reach a precise price value, though it is detached from the psychological influences more common to major moving averages or round numbers. You should generally be wary of a precise /CPG/ value, like 133.845 and instead look for a range: 133.80-134.00.
Market Profile /CPG+EX/: Similar to the other tools, but can be structured to view just the prior day, current day, prior week, etc; it's really just another visualization tool for VaR, which can help you pinpoint likely order areas. That said, it's okay to swipe left on this one.
Pivots /CPG+EX/: Pivot points are technically ATR related but the visualization can help. The opening level of the day/week/month in particular; they can be used to find opening zones which often act as return targets across uncertain sessions. You need to use common calculation with pivots for psychological value. No Waddah Attar Pivots, unfortunately, because institutions aren't looking at those.
Lageurre/Sine /CPG+FLOW/: This is not an indicator in itself, but a way for other indicators to calculate or process some market information, a filter. Technically also an Elhers invention. If you have the option to use Lageurre /CPG/ or Sine /FLOW/ based filters/calculations, then I strongly recommend it. The Lageurre method fits the ecosystem approach by modeling the market center of price gravity (what they call attraction zones) with a root-finding algorithm (at least when represented by a single indicator). I have found through substantial live & backtesting that Lageurre is one of the most accurate filters in forex for /CPG/. Sine is cycle based. You can find sine based indicators on TV. Turns out it's not hip to be square.
Ehlers Cycle Capture /FLOW/: This includes a basket of indicators. Somewhat similar in concept to Boyd and Shewhart cycle theories, which we will discuss in the intra-day article; both inspired by radio science and physics. Ehlers has a complicated explanation on his reasoning behind its technical utility, involving what he calls Maximum Entropy Spectral Analysis. While I am no expert on wave equation science or radio engineering (not enough money in it), rest assured, his MESA theory is nearly synonymous with the concept of /FLOW/ that I explained earlier. It covers most of /FLOW/, unlike /CPG/, which needs many indicators unfortunately. You might think of this as the ultimate trend following tool. But remember, the /FLOW/ is 'a pattern of patterns.' In some cases, the trend may be very disjointed, a series of HHs and LLs could constitute a trend of 'increasing momentum and volatility.' You will need Random Walk and a Regression to smooth those issues over.
Currency Correlation & Strength /CPG/EX/FLOW/: Very comprehensive, but can be hard to read. I will talk more about this for the intra-day article. Suffice to say, instead of comparing EUR pairs to AUD pairs, you should compare AUD pairs to the smoothed average AUD position (looking for an AUD pair that is operating well outside the average behavior zone for other AUD pairs at the time); this helps you identify events through what a normie trader would call arbitrage. Especially useful for taking profit. There are many indicators that can do this. Be warned though, sometimes these events are just the initial move inspired by a major sentiment shift in fundamental or geopolitical event volatility.
This risk can be overcome with currency options, which are as underrated as carry conditions. I will also talk about them in one of the last articles.
Bollinger /CPG/EX/: It is very important that you only recognize the utility of bollinger on WEEKLY and DAILY period charts and at a 20 period calculation. If price action breaks the bands on the daily period, you will want to wait for the start of the next week to consider that /EX/ event valid. That is, valid for entering a position or closing a position. This is the most useful setup for bollinger. The weekly period bollinger allows you to see the long-term /CPG/ bias. Is it shifting up or down? Though major moving averages should be your first preference to check.
On-Balance Volume /EX/: Useful for finding 'fake' tops and bottoms. Though I generally do not advocate double-top or double-bot style trading, it can help show exhaustion and the likely shift of /FLOW/ from accumulation momentum into a distribution regime. You will want to use this measurement on intra-day extremes. That is, comparing two moves that happened within the same day, otherwise it will not work correctly. Do not compare two extremes within the same week or across multiple days with this tool. You can only use OBV otherwise on assets with real volume available.
------------------------------------------------------
Forward guidance:
This should put you in a better place to construct an orderly chart to find that resilient value, one of the goals identified back in article 3. You will be better able to manage risk in real-time from a visual standpoint by creating these '2D battlefields.' That said, the primary article on calculating risk is yet to come and while the sum of all prior articles will generate edge for your trading outcomes (compared to your prior performance), you still do not have the sufficient conditions to become a professional trader (someone that can live off market earnings consistently year over year).
The last three or four articles are more challenging than their predecessors. We are switching into "metacognative" thinking, "self-regulated learning." We will move from looking at the market from a homogeneous 'science' and 'convention' standpoint and into a heterogenetic 'survival' and 'competition' concept. One of the ironies and difficulties in defense and security theories is the tragic distinction between survival and competition. Survival is the just act of one agent in a punishingly scarce environment, while the unjust acts of competition automatically emerge from many agents trying to survive in that same environment. There is no pre-existing order or rulebook, it's whatever is written by the agents themselves. This is the "history is written by the winners" meme. You write the story and the delusion becomes the convention, and sometimes even the science itself. It's a self-replicating, self-fulfilling, and self-evolving prophecy.
As I said in article one, the market is whatever the 'big' money wants it to be. And yet, sometimes the little guy manages to pull off the big win. The odds aren't in your favor, which is why I saved it for the later part of the series, but why do the odds even exist in the first place? What's the underlying logic that supports 'upsets' in the market competition? Is there something the market secretly recognizes as more valuable than money itself? If you have a little money but a lot of that could you beat someone who only has a lot of money?
So we will look at how competition throughout history inspired a science of survival that applies to business, markets, and just about everything.