MarketBreakdown | EURCHF, WTI CRUDE OIL, GBPNZD, DXY
Here are the updates & outlook for multiple instruments in my watch list.
1️⃣ #EURCHF daily time frame 🇪🇺🇨🇭
The market is testing a strong supply area
based on a solid falling trend line and a horizontal resistance.
Probabilities will be high that the price will retrace from that.
2️⃣ CRUDE OIL #WTI daily time frame 🛢️
The price is very close to a significant demand zone
based on a horizontal support cluster and a rising trend line.
I will expect a bullish reaction to that.
3️⃣ #GBPJPY daily time frame 🇬🇧🇳🇿
The market is trading within a contracting triangle.
The price nicely respected its support line and goes up steadily.
I think that bullish momentum will remain strong and the market
will go up to the resistance line of a triangle.
4️⃣ DOLLAR INDEX #DXY daily time frame 💵
The market is consolidating on a key daily support cluster.
Probabilities will be high that the price will bounce from that.
Today's fundamental news can be a trigger.
Do you agree with my market breakdown?
❤️Please, support my work with like, thank you!❤️
I am part of Trade Nation's Influencer program and receive a monthly fee for using their TradingView charts in my analysis.
Vasilytrader
GOLD (XAUUSD): Detailed Support & Resistance Analysis
Here is my fresh support & resistance analysis for Gold.
Vertical Structures
Vertical Resistance 1: Rising trend line
Horizontal Structures
Support 1: 3327 - 3344 area
Support 2: 3246 - 3275 area
Resistance 1: 3431 - 3451 area
The price is currently coiling on a trend line.
Your next bullish confirmation will be its breakout.
❤️Please, support my work with like, thank you!❤️
I am part of Trade Nation's Influencer program and receive a monthly fee for using their TradingView charts in my analysis.
CADJPY: Bearish Move From Resistance 🇨🇦🇯🇵
There is a high chance that CADJPY will drop
from a key daily resistance cluster.
As a confirmation, I see a triple top pattern
on an hourly time frame and a violation of its neckline.
Goal - 106.9
❤️Please, support my work with like, thank you!❤️
I am part of Trade Nation's Influencer program and receive a monthly fee for using their TradingView charts in my analysis.
GBPJPY: More Growth is Coming! 🇬🇧🇯🇵
GBPJPY will likely bounce from a key daily support,
following a formation of a double bottom pattern
on an hourly time frame.
I think that the price will reach 196.7 level soon.
❤️Please, support my work with like, thank you!❤️
I am part of Trade Nation's Influencer program and receive a monthly fee for using their TradingView charts in my analysis.
EURUSD: Pullback From Resistance 🇪🇺🇺🇸
EURUSD strongly reacted to the underlined intraday
resistance area after the market opening.
I see a tine double top pattern on that and a formation
of a bearish engulfing candle.
I expect a retracement to 1.154 level.
❤️Please, support my work with like, thank you!❤️
EURUSD: Support & Resistance Analysis For Next Week 🇪🇺🇺🇸
Here is my latest structure analysis and important
supports & resistances for EURUSD for next week.
Consider these structures for pullback/breakout trading.
❤️Please, support my work with like, thank you!❤️
I am part of Trade Nation's Influencer program and receive a monthly fee for using their TradingView charts in my analysis.
SILVER (XAGUSD): More Growth Ahead
It looks like Silver is going to continue growing next week,
following a strong bullish reaction to a key daily horizontal support.
The next strong resistance is 3748.
It will be the next goal for the buyers.
❤️Please, support my work with like, thank you!❤️
I am part of Trade Nation's Influencer program and receive a monthly fee for using their TradingView charts in my analysis.
CADCHF: Bullish Move After the Trap 🇨🇦🇨🇭
There is a high chance that CADCHF will go up today.
After a test of a key horizontal support, the price formed
a liquidity grab with a consequent bullish imbalance.
We can expect growth to 0.5887
❤️Please, support my work with like, thank you!❤️
I am part of Trade Nation's Influencer program and receive a monthly fee for using their TradingView charts in my analysis.
GBPJPY: Pullback From Resistance 🇬🇧🇯🇵
I think that GBPJPY will pull back from a wide
intraday supply area.
As a confirmation, I see a bearish imbalance candle that
is formed after its test.
Goal - 198.51
❤️Please, support my work with like, thank you!❤️
I am part of Trade Nation's Influencer program and receive a monthly fee for using their TradingView charts in my analysis.
GOLD (XAUUSD): Bearish Continuation Ahead?!
Gold retested a recently broken significant liquidity cluster.
I see a clear sign of strength of the sellers after its test
with multiple intraday confirmation.
I think that the price will retrace to day to 3276 level.
❤️Please, support my work with like, thank you!❤️
I am part of Trade Nation's Influencer program and receive a monthly fee for using their TradingView charts in my analysis.
GBPUSD: Strong Trend-Following Pattern 🇬🇧🇺🇸
GBPUSD is going to drop lower.
The market has completed a correctional movement within
a bearish flag.
Its support violation provides a strong bearish confirmation.
I expect a drop to 1.3202 level.
❤️Please, support my work with like, thank you!❤️
I am part of Trade Nation's Influencer program and receive a monthly fee for using their TradingView charts in my analysis.
BINANCE COIN (BNBUSD): Bullish Continuation Ahead
BNB is going to resume growth after a retest of a recently broken structure.
A bullish breakout of a resistance line of a bullish flag provides a strong bullish confirmation.
I think that the price will go up to 844 level.
❤️Please, support my work with like, thank you!❤️
GBPJPY: Important Demand Zone 🇬🇧🇯🇵
GBPJPY is trading within an important demand zone that
is based on a rising trend line and a horizontal support.
We see a false violation of that and a bear trap, followed
by a bullish imbalance candle.
I think that the pair may go up and reach at least 198.08 level.
❤️Please, support my work with like, thank you!❤️
I am part of Trade Nation's Influencer program and receive a monthly fee for using their TradingView charts in my analysis.
AUDCAD: Bullish Move From Trend Line 🇦🇺🇨🇦
AUDCAD may bounce from a solid rising trend line on a 4H.
The price started to consolidate on that after its test.
A breakout of a minor horizontal resistance is a strong bullish confirmation.
Goal - 0.8999
❤️Please, support my work with like, thank you!❤️
I am part of Trade Nation's Influencer program and receive a monthly fee for using their TradingView charts in my analysis.
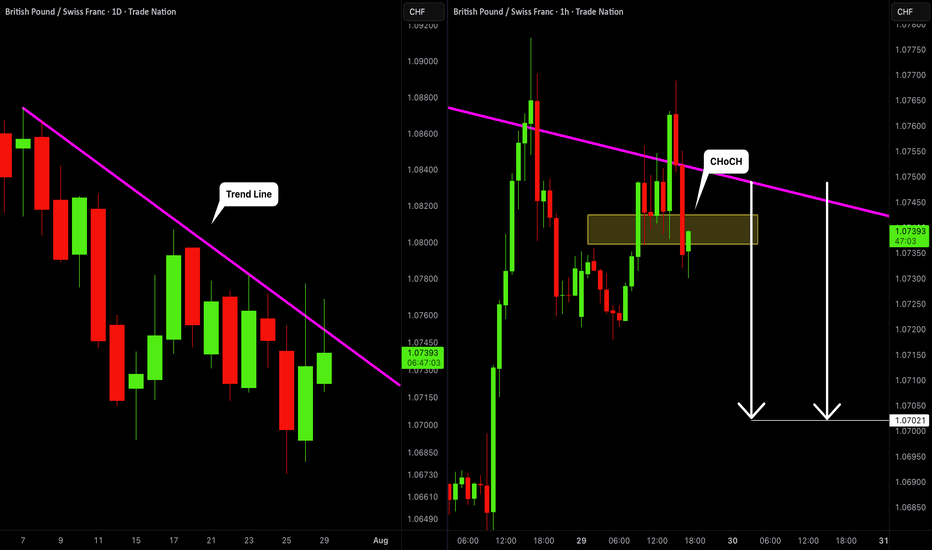
GBPCHF: Bearish Movement Confirmed 🇬🇧🇨🇭
GBPCHF looks bearish after the news today.
The price tested a solid rising trend line on a daily
and formed a confirmed bearish Change of Character
on an hourly time frame.
I think that the price will continue falling and reach 1.0702 level.
❤️Please, support my work with like, thank you!❤️
I am part of Trade Nation's Influencer program and receive a monthly fee for using their TradingView charts in my analysis.
GBPNZD: Time to Sell 🇬🇧🇳🇿
I see a nice short trade on GBPNZD.
The price formed a double top pattern after a test of a key daily/intraday resistance.
We see a breakout of its neckline at the moment.
With a high probability, the price will drop to 2.103 level.
❤️Please, support my work with like, thank you!❤️
AUDUSD: Top-Down Analysis & Bearish Outlook 🇦🇺🇺🇸
AUDUSD reached a solid daily resistance.
After a test of the underlined blue area, the pair started to consolidate within
a horizontal range on an hourly time frame.
Its support violation is a change of character and signifies a highly probable
local dominance of sellers.
I expect a bearish movement to 0.648
❤️Please, support my work with like, thank you!❤️
UNDERSTAND CURRENCY CORRELATION Understanding price relationships between various currency pairs allows you to get a more in-depth look at how to develop high-probability Forex trading strategies. Awareness of currency correlation can help to reduce risk, improve hedging, and diversify trading instruments. In this article, we will introduce you to Forex trading using intermarket correlations.
Meaning of currency pairs correlation in Forex
Correlation is a statistical measure of the relationship between two trading assets. Currency correlation shows the extent to which two currency pairs have moved in the same, opposite, or completely random directions within a particular period.
Analysis of two asset relationships using past statistical data has predictive value. By utilising the correlation coefficient, we can understand the relationship between two values and help manage risk.
Impact of currency correlations on Forex trading
They can form a basis of a statistically high probability Forex trading strategy.
They can illustrate the amount of risk you are exposed to within your Forex trading account. For example, if you have bought several currency pairs with a strong positive correlation, then you are exposed to higher directional risk.
You can avoid positions that effectively cancel each other out. EUR/USD and USD/CHF have a powerful negative correlation. If you have a directional bias, buying both EUR/USD and USD/CHF will counteract the moves in each pair.
Understanding correlations can allow you to hedge or diversify your exposure to the Forex market.
If you have a directional bias for a given currency, you can spread your risk using two strongly positive correlated pairs, in terms of diversification.
If you are looking to hedge a position (holding it with low risk of losses) you can take a position in a negatively correlated pair. If you were to initiate a ‘long buy’ for EUR/USD, and it begins to move in an unfavourable direction, you can then hedge your position by purchasing a currency pair that has a negative correlation to EUR/USD, like USD/CHF.
Currency correlations change in Forex
Be aware that currency correlations are continually changing over time due to various economic and political factors. These often include diverging monetary policies, commodity prices, changes in central banks’ policies, and more. Given that strong correlations can change over time, it highlights the importance of staying up to date in shifting currency relationships. We recommend checking long-term correlations to acquire a more in-depth perspective.
All in all, currency correlations could be a powerful tool you can use to develop high-probability trading strategies. You'll also be aided in risk management, mainly if you track the correlation coefficients over daily, weekly, monthly and yearly timeframes.
US OIL BULLISHUsing Trend lines and due to the low confidence index today which caused the fall of stock I feel that there is going to be a short bullish move for the OIL
My analysis came from Fundamental impact and technical moves.
What's your take on the oil
Let me know in the comment section below


