XAUUSD (GOLD)Gold approached its ALL TIME HIGH, with a good little rejection via an engulfing candlestick bar there gives signs of reversal, looking at also the addition of the recent reduction in impulsive behaviour, good corrections of price or market ranges and also the key zone being a selling zone where price rapidly moved away from last, could this give us confidence in a possible reversal?
Or based off fundamentals and recent impulsive behaviour of strong bulls, we could see GOLD break it's ALL TIME HIGH, therefore creating new highs, what's your take?
Volatility

Boyd Group Services Inc. (TSX: BYD) - Swing Trade 2025-12-12💰 BYD.TO — Mean Reversion Swing Setup (RSI(2) + 50-SMA)
Boyd Group Services Inc. (TSX: BYD) continues to behave like a textbook institutional swing name. Despite premium valuation, price action remains highly technical, with repeated respect of the 50-day SMA and strong mean-reversion responses following short-term oversold conditions.
This setup aligns cleanly with a Connors-style RSI(2) pullback within a primary uptrend.
📈 Technical Context
BYD remains in a confirmed long-term uptrend, with price holding above the 200-day SMA and repeatedly finding buyers near the 50-day SMA. The recent pullback brought RSI(2) into deeply oversold territory (<10) — a level that historically precedes short-term bounces in this name.
Volume has contracted on the pullback, suggesting selling pressure is corrective rather than distributive.
Structure remains intact as long as price holds above the 50-SMA zone.
📊 Key Levels
Current Price: ~221.8
50-SMA: ~221–222 (primary dynamic support)
200-SMA: ~210 (trend floor)
Support Zone: 218–222
Resistance Zone: 235–240
This area has acted as a high-probability demand zone multiple times over the past year.
🎯 Trade Thesis (Swing)
Bias: Bullish mean-reversion
Setup Type: RSI(2) pullback within established uptrend
Entry:
Looking for long exposure near the 50-SMA (220–223) following oversold RSI(2) conditions.
Stop:
Below structure and ATR — 213–215 area.
Target:
Prior supply and range highs at 235–240.
Risk/Reward:
Approximately 2.5R, acceptable for a swing trade in a premium-valued name.
⚠️ Risks to Watch
Loss of the 50-SMA on a high-volume close
Broader consumer discretionary weakness
Rate-sensitivity given leverage on the balance sheet
A clean break below the 50-SMA would invalidate the mean-reversion thesis.
🧠 Final Take
BYD isn’t cheap — but price pays. As long as the 50-SMA holds, this remains a repeatable swing structure rather than a long-term valuation play. I favor controlled long exposure here, targeting a rotation back toward the upper range.

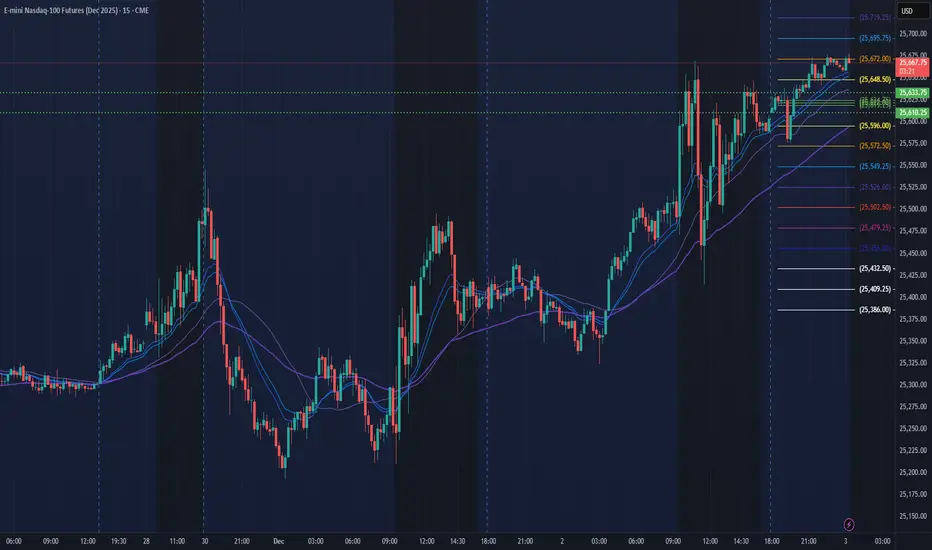
NQ Power Range Report with FIB Ext - 12/12/2025 SessionCME_MINI:NQZ2025
- PR High: 25733.25
- PR Low: 25648.75
- NZ Spread: 189.5
No key scheduled economic events
Session gap -0.42%, open above 25833
Session Open Stats (As of 12:45 AM)
- Session Open ATR: 404.03
- Volume: 27K
- Open Int: 295K
- Trend Grade: Long
- From BA ATH: -2.6% (Rounded)
Key Levels (Rounded - Think of these as ranges)
- Long: 26521
- Mid: 25264
- Short: 24008
Keep in mind this is not speculation or a prediction. Only a report of the Power Range with Fib extensions for target hunting. Do your DD! You determine your risk tolerance. You are fully capable of making your own decisions.
BA: Back Adjusted
BuZ/BeZ: Bull Zone / Bear Zone
NZ: Neutral Zone

ASM/USD - Assemble AI - 12-11-2025This is a good chart to trade!
Look at the high volatility with massive % moves!
RSI over sold, with the Vix fix bottom finder showing a bottom!
This is overdue for a little pop, like +350% lol
The big pop is like +1000% :)
I got in 12-09-2025 a couple days ago!
I thought I should share this chart!
Be careful, I don't know how low this can go!

Canadian Utilities (CU.TO) - Swing Trade💰 CU.TO — Swing Trade Breakdown (TradingView Idea Version)
🏢 Company Snapshot
Canadian Utilities (CU.TO) is one of Canada’s largest regulated utility providers, operating electricity and natural gas transmission and distribution networks. The stock normally trades with low volatility, but a sharp pullback into the rising 50-day SMA has created a textbook mean-reversion opportunity. The November breakout remains intact, and buyers are watching for continuation toward the 42.50–43.00 zone.
📊 Fundamental Overview
CU trades at roughly 15× earnings, slightly below the typical 16–18× range for regulated utilities. Price-to-book is around 1.8×, which is fair for a steady, capital-intensive utility with predictable cash flows.
Debt-to-equity sits near 1.35, which is standard for the sector — utilities tend to run with higher leverage because of regulated, stable income streams.
Return on equity is healthy at ~10.5%, above average for Canadian utilities, showing solid profitability.
The dividend yield is ~5.5%, one of the main reasons long-term investors hold CU. Free cash flow sits around the $800–900M range, enough to support ongoing capex and maintain the dividend without excessive strain. Cash reserves (~$600M) provide decent near-term stability.
Overall: A stable, moderately valued defensive name with strong cash flow, predictable earnings, and a high, secure dividend.
📈 Trends & Catalysts
Revenue growth is running in the low-single-digit range — exactly what you expect from a regulated utility. EPS continues a slow upward trend as cost efficiency improves and rate-base expansion contributes. Cash flow is stabilizing as large capital projects wind down.
Balance sheet leverage remains elevated but normal for the sector; refinancing risk is manageable given CU’s long-duration debt structure.
Catalysts:
• Rotation back into defensive sectors
• Dividend demand during market volatility
• Upcoming regulatory decisions
• Interest-rate easing narrative benefiting utilities
• November breakout still structurally intact
Risks:
• Sensitivity to rate hikes
• Lower relative upside vs cyclical or growth sectors
• Utilities still lagging broader TSX performance over 12 months
🪙 Utilities Sector Overview
The sector is slightly red on the weekly timeframe (down ~1%), reflecting short-term hesitation. However, monthly performance has turned positive with a small uptrend as capital rotates into defensive names. Over 12 months, utilities remain an underperformer due to the interest-rate shock, but sentiment has stabilized significantly.
This backdrop is supportive for a swing setup — not aggressively bullish, but conducive to clean technical mean-reversion trades.
📐 Technical Breakdown
Price is currently around 41.13, sitting directly on top of the rising 50-day SMA (~41.10) — a level CU has respected repeatedly throughout the year. The long-term trend remains intact with the 200-day SMA around 40.20, well below current price.
RSI(2) is deeply oversold at ~5–7, which is exactly the condition that triggers high-probability RSI2 swing setups. The pullback resembles previous successful mean-reversion entries (June, November), both of which snapped back quickly into resistance.
Support sits at 40.60–41.00, with strong buyers previously stepping in at the same zone.
Resistance is 42.30–42.90, followed by a secondary level at 43.50.
Volume is stable — no signs of distribution or panic selling, indicating this is a controlled pullback into trend.
🎯 Trade Plan
Entry Zone: 41.00–41.25
Price is already in the ideal region — a clean tag of the 50-SMA with RSI2 oversold.
Stop Loss: 40.60–40.70
Placed below trendline support and the recent swing low.
Target: 42.50–42.90
A return to the prior resistance zone, consistent with past RSI2 snapbacks.
Risk/Reward: Approximately 2.0× to 2.3×
Meets the minimum threshold for a high-quality swing trade.
Alternate Setup:
If CU breaks above 42.30 with momentum, an add-on or breakout continuation toward 43.50 becomes viable.
🧠 My Take
This is a classic RSI2 SMA50 mean-reversion setup — oversold conditions, trend intact, and price sitting directly on the moving average it respects most. With utilities stabilizing and the dividend reducing downside risk, CU offers a clean, low-volatility swing back into the 42.50–43.00 area. As long as 40.70 holds, the structure remains firmly bullish.
A high-probability defensive swing with favorable risk-to-reward.

Stripe Latest Move Signals a New Phase in Its Crypto AmbitionsStripe continues to push deeper into digital assets as the company acquires the Valora team, marking a decisive step in its broader global vision. This move gives Stripe stronger technical muscle and sharper product experience as it builds out services connected to blockchain payments. The self-custody Valora wallet will still operate under cLabs, but the talent behind it now strengthens Stripe’s growing crypto direction. This shift reflects Stripe’s steady push toward a stronger and more versatile it crypto expansion strategy.
Crypto adoption grows rapidly across global markets, and Stripe wants a larger share of this evolving space. The company sees new opportunities across borderless payments, stablecoin settlements, and wallet-based commerce. The addition of the Valora team brings product intuition and deep mobile wallet expertise that aligns with Stripe’s long-term roadmap. Brands, creators, and users want faster and cheaper payment options, and Stripe plans to meet this demand through smart innovation and a focused crypto payment strategy.
With digital asset-based transactions increasing worldwide, Stripe positions itself for the next phase of financial technology. Developers demand more tools, consumers expect frictionless experiences, and businesses want secure global payment rails. Stripe responds to these expectations by strengthening its technical base and integrating teams that deeply understand crypto usability. The Valora acquisition gives it an edge as it builds a resilient and modern payment ecosystem built for global scale.
How the Valora Team Strengthens Crypto Ambitions
Stripe gains a talented team with strong expertise in mobile-first crypto experiences. Valora builds user-friendly tools that make blockchain payments simple and intuitive. This fits directly into it stated goal to make cryptocurrencies useful in daily transactions. The Valora acquisition also offers it valuable experience in scaling consumer-facing digital asset products.
The team adds years of technical understanding that supports Stripe crypto expansion plans. It wants to create seamless systems that handle stablecoin payments, cross-border flows, and merchant integrations. Valora’s experience helps Stripe design better products that reduce friction for users and businesses. These improvements support the company’s broader crypto payment strategy that reaches global merchants and fintech developers.
Why Stripe Keeps Expanding Its Presence in Crypto
Stripe sees rising global demand for fast and low-cost payment systems. Stablecoins and blockchain networks allow near-instant settlement without traditional friction. Stripe wants to support businesses that serve cross-border markets, and crypto offers an efficient solution. Developers also want easy tools that integrate modern payment features with minimal complexity.
Stripe’s cryptocurrency expansion plans are more about providing value than excitement. By using digital currencies, Stripe strives to establish a way of paying with stablecoins; create ways to convert into and back out from cryptocurrency; introduce tools for businesses to easily enter into/leave from the world of digital finance; and create better methods for individuals and businesses to gain access to all these different types of financial instruments.
The latest piece of this strategy builds off of the company’s re-establishment of cryptocurrency Payment Services into Stripe earlier this year. Stripe’s vision is to enable merchants around the world to connect to their customers through simple, reliable blockchain-based payment workflows.
Stripe’s Long-Term Vision for a Smarter Crypto Future
Stripe aims to shape the future of cross-border payments with a modern approach. The company believes that digital assets offer practical solutions to long-standing financial hurdles. The crypto expansion strategy blends deep engineering talent with a focus on real-world utility. The Valora acquisition strengthens this mission and prepares it for the next stage of global payment innovation.
Stripe plans to support stablecoin growth, simplify global payouts, and power new economic connections. The company now holds stronger expertise to design modern tools for millions of users and businesses. This shift signals a new era for Stripe and a more connected financial ecosystem.

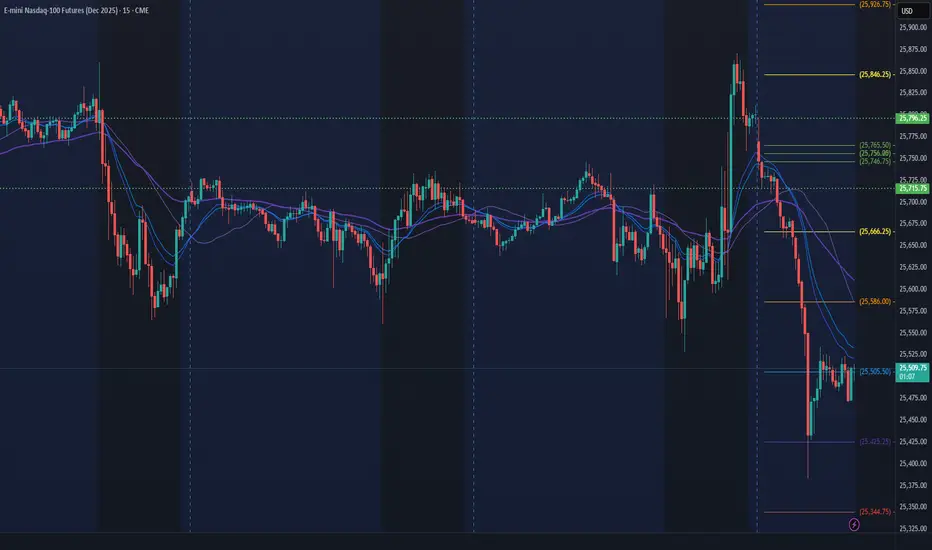
NQ Power Range Report with FIB Ext - 12/11/2025 SessionCME_MINI:NQZ2025
- PR High: 25796.00
- PR Low: 25715.75
- NZ Spread: 179.25
Key scheduled economic events:
08:30 | Initial Jobless Claims
12:00 | 30-Year Bond Auction
Session Open Stats (As of 12:35 AM).
- Session Open ATR: 415.83
- Volume: 55K
- Open Int: 311K
- Trend Grade: Long
- From BA ATH: -3.4% (Rounded)
Key Levels (Rounded - Think of these as ranges)
- Long: 26521
- Mid: 25264
- Short: 24008
Keep in mind this is not speculation or a prediction. Only a report of the Power Range with Fib extensions for target hunting. Do your DD! You determine your risk tolerance. You are fully capable of making your own decisions.
BA: Back Adjusted
BuZ/BeZ: Bull Zone / Bear Zone
NZ: Neutral Zone
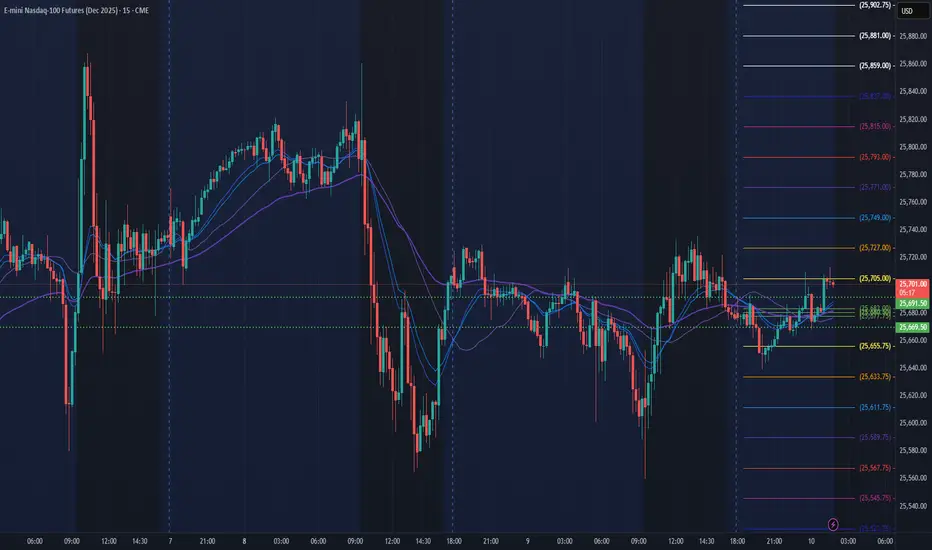
NQ Power Range Report with FIB Ext - 12/10/2025 SessionCME_MINI:NQZ2025
- PR High: 25691.50
- PR Low: 25669.50
- NZ Spread: 49.0
Key scheduled economic events:
14:00 | FOMC Economic Projections
- FOMC Statement
- Fed Interest Rate Decision
14:30 | FOMC Press Conference
Session Open Stats (As of 12:25 AM).
- Session Open ATR: 396.33
- Volume: 19K
- Open Int: 313K
- Trend Grade: Long
- From BA ATH: -2.7% (Rounded)
Key Levels (Rounded - Think of these as ranges)
- Long: 26521
- Mid: 25264
- Short: 24008
Keep in mind this is not speculation or a prediction. Only a report of the Power Range with Fib extensions for target hunting. Do your DD! You determine your risk tolerance. You are fully capable of making your own decisions.
BA: Back Adjusted
BuZ/BeZ: Bull Zone / Bear Zone
NZ: Neutral Zone
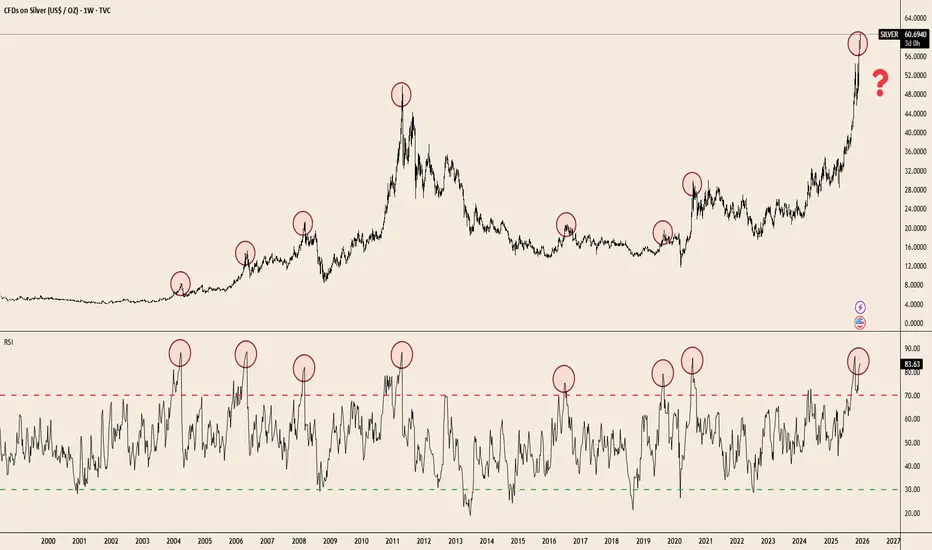
Silver at Extremes: RSI Signals Haven’t Missed in 20 YearsTVC:SILVER has delivered a massive breakout — up +109.9% YTD — but the weekly RSI is now pushing into one of the most extreme zones seen in two decades. Historically, every major spike into the 80–85 RSI band has preceded cooling periods, consolidations, or full reversals.
The chart makes the pattern clear:
• Each parabolic advance since 2004 ended with RSI extremes similar to today.
• Price is testing the same overextension zone seen at the 2011 blow-off top and the 2020 surge.
• Weekly RSI rarely stays above 80 for long — momentum tends to reset before the next leg can form.
This doesn’t guarantee a top.
But when a commodity doubles in a single year and hits long-term RSI ceilings simultaneously, risk/reward becomes asymmetric.
Silver’s trend remains powerful — the question now is how sustainable the slope is.
BTC Bear Market Buys 2026-2027These are my predicted bear market buys for 2026 and potentially Q1 2027.
These buys range from -50% from ATH to -75% from ATH.
I expect the market to bottom around -70% to -75%.

NQ Power Range Report with FIB Ext - 12/9/2025 SessionCME_MINI:NQZ2025
- PR High: 25728.50
- PR Low: 25692.00
- NZ Spread: 81.5
Key scheduled economic events:
10:00 | JOLTs Job Openings
13:00 | 10-Year Note Auction
Session Open Stats (As of 12:25 AM).
- Session Open ATR: 413.46
- Volume: 23K
- Open Int: 310K
- Trend Grade: Long
- From BA ATH: -2.7% (Rounded)
Key Levels (Rounded - Think of these as ranges)
- Long: 26521
- Mid: 25264
- Short: 24008
Keep in mind this is not speculation or a prediction. Only a report of the Power Range with Fib extensions for target hunting. Do your DD! You determine your risk tolerance. You are fully capable of making your own decisions.
BA: Back Adjusted
BuZ/BeZ: Bull Zone / Bear Zone
NZ: Neutral Zone

APP | New ALL TIME HIGHS Incoming | LONGAppLovin Corp. engages in the development and operation of a mobile marketing platform. It offers AppDiscovery, MAX, Adjust, and SparkLabs. Its software-based platform caters to mobile application developers to improve the marketing and monetization of applications. The company was founded by Andrew Karam, John Krystynak, and Adam Foroughi in 2011 and is headquartered in Palo Alto, CA.t represents results from other non-reportable segments and corporate-related charges. The company was founded by Robert Norton Noyce and Gordon Earle Moore on July 18, 1968 and is headquartered in Santa Clara, CA.

$IWM — The Rate-Cut Leverage PlayLast week delivered one of those classic market paradoxes where everything that should be bearish suddenly became bullish:
layoffs → bullish
weak labor data → bullish
flat inflation → bullish
Why?
Because the market has now fully locked its focus on one thing only:
a Federal Reserve rate cut.
Volatility was sharp, price action even sharper, and the headlines kept flipping faster than most traders could adjust.
Let’s break down what actually happened — and what matters for the week ahead.
IWM GEX for 01/16/2025 expiration using TanukiTrade Options Overlay GRID System and the GEX Profile indicator
If the Fed cuts, small caps win the most — and last week proved it again.
IWM broke above the 250 call gamma level
Short-term gamma squeeze potential
Closed at new all-time highs
This is where rate-cut optimism expresses itself with maximum torque.
If the Fed turns dove on Wednesday → IWM can easily extend.

AUDUSD – Can the Winning Streak Continue?AUDUSD has been a star performer in the G10 FX space over the last 2 weeks as it rides the wave of shifting market interest rate expectations for the Reserve Bank of Australia (RBA) and the Federal Reserve moving into early 2026. This has seen it trade from a low of 0.6421 on November 21st up to close the first week of December at 0.6639, a 2-month high and a mere 1% away from its 2025 peak of 0.6710 seen on September 17th.
Looking forward, 2 events in the week ahead are likely to stress test these interest rate outlooks of the market and could generate extra volatility for the AUDUSD currency pair moving into Friday’s close. The first event is the RBA interest rate decision which is released tomorrow at 0330 GMT, with the press conference starting at 0430 GMT. The Australian central bank is expected to keep interest rates on hold, so potentially no surprises there, however FX traders may be focused on how hawkish Governor Bullock’s comments are in the press conference, with recent stronger wage growth and spending data seeing the market start to consider a rate hike being the RBA’s next move at some stage in 2026.
Then on Wednesday the focus shifts to the interest rate decision from the Federal Reserve which is released at 1900 GMT. They are fully expected to cut interest rates 25bps (0.25%), so if this wasn’t to happen it would be a big shock. If the Fed do cut interest rates, then the next big challenge for traders is to digest the tone of comments made by Chairman Powell in the press conference which starts at 1930 GMT. Traders will be listening to see if he sticks to a more hawkish script, emphasising upside inflation risks in 2026, a potential positive for the US dollar (AUDUSD lower) or now that his term as Chairman is due to end in February, he bows to political pressure and is more dovish, highlighting the possibility for further rate cuts moving forward in order to support a slowing US labour market, a move which could lead to a weaker US dollar (AUDUSD higher).
With so much for AUDUSD traders to navigate this week, assessing the technical outlook and identifying some potential support and resistance levels to monitor should prices start to move more aggressively could be useful.
Technical Update: Can the 11 Day Winning Streak Continue?
The latest activity in AUDUSD has seen a fresh bout of AUD support and outperformance aligning with a period of USD selling pressure. This has resulted in a phase of AUDUSD price strength since the November 21st session low, leading to an advance of more than 3.5%.
As the chart below shows, the latest price strength has seen successful closing breaks above resistance at 0.6628 materialise, a level which was equal to the September 24th high. This could be viewed by some as an indication of the strength of buying support for AUDUSD at present and the potential for moves to higher levels in future sessions.
However, look at the chart again and you will also notice that since the November 21st low, each session has managed to close above its daily opening price, meaning there have been 11 consecutive ‘green’ or positive daily candles posted, possibly even 12 if the latest candle sees a close on Monday above the day’s opening price. From our analysis of historical data, this is unprecedented within AUDUSD and may introduce a note of caution regarding whether over-extended upside price conditions are evident and if price gains are going to be able to extend further.
Just because a currency pair has seen such an extended advance doesn’t guarantee the direction of the next move, be it to the up or the downside. Therefore, a closer focus on identifying support and resistance levels to monitor may be required this week to help gauge the next directional themes for AUDUSD.
Potential Resistance Levels: .
The latest closing break above the September 24th high at 0.6628 saw a new upside extreme posted on Friday at 0.6649, and having encountered sellers at this level before, they may be found there once more. As such, this 0.6649 peak might prove to be the first resistance focus in the week ahead.
If successful closing breaks above the 0.6649 level were to materialise, it is possible the current phase of strength can extend further. This could lead traders to then focus on the September 17th high at 0.6710 as the next resistance point.
Potential Support Levels:
It remains to be seen if the current 11-day period of positive candles since the November 21st low can continue or not, but if breaks of support levels were to materialise, it might lead to concerns of a phase of price weakness developing.
Having seen such a strong rally emerge from Friday’s 0.6605 low, it is possible this could prove to be the first support level to monitor for the coming week.
Much will continue to depend on market sentiment and price trends but closes below the 0.6605 support may lead to a phase of price weakness. This could open the possibility to test 0.6562, which is the 38.2% Fibonacci retracement level, possibly even lower.
The material provided here has not been prepared accordance with legal requirements designed to promote the independence of investment research and as such is considered to be a marketing communication. Whilst it is not subject to any prohibition on dealing ahead of the dissemination of investment research, we will not seek to take any advantage before providing it to our clients.
Pepperstone doesn’t represent that the material provided here is accurate, current or complete, and therefore shouldn’t be relied upon as such. The information, whether from a third party or not, isn’t to be considered as a recommendation; or an offer to buy or sell; or the solicitation of an offer to buy or sell any security, financial product or instrument; or to participate in any particular trading strategy. It does not take into account readers’ financial situation or investment objectives. We advise any readers of this content to seek their own advice. Without the approval of Pepperstone, reproduction or redistribution of this information isn’t permitted.

December 8 - December 12 2025: Disappointment ImminentThe market has not changed too much since last week, where my assessment that the market was in a neutral state turned out to be mostly accurate. I’m continuing to refine my analysis so I have changed some things heading into this week which should help provide even clearer signals. With the rate decision in focus, it will be important to consider the implications that a cut (which I am biased towards) vs unchanged rates will have on these indicators, as it will likely make the difference between the market continuing its bullish trend to end the year or if equities will continue to feel pressure from high interest rates and a slowing economy.
1. Macro
Here we are seeing low demand for treasuries TVC:US10 and the dollar TVC:DXY while bond and equity put hedging has been unwinding. I think the current state of the market provides a clear signal of why the Fed needs to cut interest rates this month - dumping bonds while growth stagnates will make real yields surge and could cause the market to retreat from US assets altogether, which would be a worst-case scenario. I think the Fed has no choice but to keep cutting rates in order to keep yields down. Since the breakeven rate FRED:T5YIE was rising at the end of last week, a drop in the nominal yield TVC:US05Y now would send the real yield to lower lows.
2. FX
Since the dollar can service as a funding or carry currency, I am comparing US rates to “carry” countries and the dollar index to other carry currencies in order to determine whether investors in this yield-seeking regime would be interested in dollars. Here you can see that compared to yields in Great Britain, Canada, New Zealand, and Australia (not shown), US yields are underperforming, and as a result, the dollar is weakening against the respective currency indices TVC:AXY , TVC:CXY , TVC:ZXY
This is my new indicator that normalizes carry country yields (GB, CA, SE, NZ, AU) vs safe haven yields (JP, CH, EU, & US), shown on the dashed line, and respective currency pairs on the dotted line in order to detect the risk regime. Here we are seeing that carry yields are elevated and the market is still chasing after them compared to rushing to funding currencies for yield or safety.
Here is a comparison of funding countries. My expectation for this week is that
1. The market will still be seeking yield (risk-on)
2. If US yields & USD fall, it will lift carry trades vs USD (such as FX_IDC:CADUSD & OANDA:AUDUSD )
3. Risk-on regime continues, which will boost US equities
Of course, the opposite will play out if the Fed keeps rates high, however they need to keep foreign investors buying US debt in order to sustain our unsustainable debt for a little while longer. Leaving rates unchanged will spook investors about the trajectory of monetary policy and lead to higher yields. This is why I am quite confident we will see a rate cut and am explaining this scenario in more detail.
3. Risk
Credit fear continues to ease, while risk-on tech bets AMEX:XLK recover against safety in consumer staples AMEX:XLP
4. Equity Comparison
Tech is still battered compared to other sectors. A sign of tension will emerge if tech continues to underperform the market while the Fed is signaling continued monetary easing. This would point to a true change in sentiment in which the market may be bearish on Tech. If this were to happen, a major market correction could be on the horizon.
5. Bias
I’ve changed a few things on this layout and moved the CVD indicators to my QQQ chart since they react better to regular market hours order flow. Here I have a Z-score indicator of CME_MINI:ES1! - CBOE:VX1! which shows that the equity regime for September so far is bullish. ADL is flattening out but is not giving a useful signal yet. I also changed the linear Historical Volatility indicator to a Z-score oscillator which shows HV is declining and moving back to its floor, which can also be seen on VIX. Since we are guaranteed to see a major volatility spike after the rate announcement, I think VIX may be choppy until then.
What’s worth noting is that with HV (non-directional) at its floor (sensitive to any Vol spikes) and VIX back to its floor ahead of the rate announcement, this signals to me that equities may have more sensitivity to a downside movement.
+-+-+-+-+-+-+-+-+-+-+-+-+-+-+-+-+-+-+-+-+-+-+-+-+-+-+-+-+-+-+-+-+-+-+-+-+
When viewed together, I think all of this sends an interesting message that points to divergence between Macro/FX and US equities. With the Fed cutting rates into slower growth and Tech underperforming, low HV/VIX makes equities vulnerable to a reduction in risk exposure. I think this is what we will see if rates are cut under the current regime.
1. Yields will fall, but TVC:DXY may hold steady if there is equity pressure in the US.
2. Risk-on yield-seeking trades in FX will continue. Dollar may hold up against other funding currencies but will fall against higher-yielding currencies
3. Tech will underperform
4. VIX catching a bid will correspond with US indices falling
5. Since global environment will still be risk-on, volatility will be limited to the US and may be less intense
As always, the reason I post my analysis is to provide a reference point as the week unfolds, and to backtest my strategies for improvement. For now, my bias is low volatility until FOMC (likely sideways or upside drift) followed by downside later in the week.

NQ Power Range Report with FIB Ext - 12/8/2025 SessionCME_MINI:NQZ2025
- PR High: 25770.00
- PR Low: 25719.50
- NZ Spread: 113.0
No key scheduled economic events
Session Open Stats (As of 12:15 AM).
- Session Open ATR: 426.48
- Volume: 21K
- Open Int: 307K
- Trend Grade: Long
- From BA ATH: -2.2% (Rounded)
Key Levels (Rounded - Think of these as ranges)
- Long: 26521
- Mid: 25264
- Short: 24008
Keep in mind this is not speculation or a prediction. Only a report of the Power Range with Fib extensions for target hunting. Do your DD! You determine your risk tolerance. You are fully capable of making your own decisions.
BA: Back Adjusted
BuZ/BeZ: Bull Zone / Bear Zone
NZ: Neutral Zone

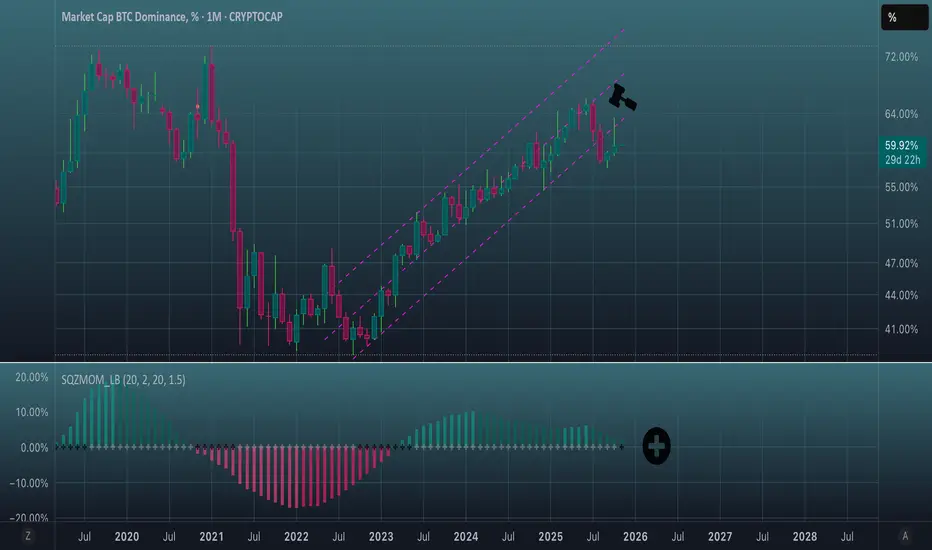
A beautiful picture.The channel breakout was completed.
An aggressive retest of the channel was completed.
SQZMOM implemented a black cross, indicating that a bearish squeeze has begun.
Now it's been months.

FTSE This chart shows a clear change.
The upside swing has lost the 90 degree angle.
The bearish swing was volatile.
The bullish swing was, until it wasnt.
Clear 4hr change in delivery.
Momentum lost .

NQ Power Range Report with FIB Ext - 12/5/2025 SessionCME_MINI:NQZ2025
- PR High: 25648.75
- PR Low: 25608.50
- NZ Spread: 90.0
Key scheduled economic events:
10:00 | Core PCE Price Index (MoM|YoY)
Session Open Stats (As of 12:55 AM)
- Session Open ATR: 438.85
- Volume: 21K
- Open Int: 306K
- Trend Grade: Long
- From BA ATH: -2.5% (Rounded)
Key Levels (Rounded - Think of these as ranges)
- Long: 26636
- Mid: 25410
- Short: 23426
Keep in mind this is not speculation or a prediction. Only a report of the Power Range with Fib extensions for target hunting. Do your DD! You determine your risk tolerance. You are fully capable of making your own decisions.
BA: Back Adjusted
BuZ/BeZ: Bull Zone / Bear Zone
NZ: Neutral Zone
NQ Power Range Report with FIB Ext - 12/4/2025 SessionCME_MINI:NQZ2025
- PR High: 25658.75
- PR Low: 25633.75
- NZ Spread: 56.0
Key scheduled economic events:
08:30 | Initial Jobless Claims
Session Open Stats (As of 12:45 AM)
- Session Open ATR: 450.27
- Volume: 19K
- Open Int: 304K
- Trend Grade: Long
- From BA ATH: -2.7% (Rounded)
Key Levels (Rounded - Think of these as ranges)
- Long: 26636
- Mid: 25410
- Short: 23426
Keep in mind this is not speculation or a prediction. Only a report of the Power Range with Fib extensions for target hunting. Do your DD! You determine your risk tolerance. You are fully capable of making your own decisions.
BA: Back Adjusted
BuZ/BeZ: Bull Zone / Bear Zone
NZ: Neutral Zone

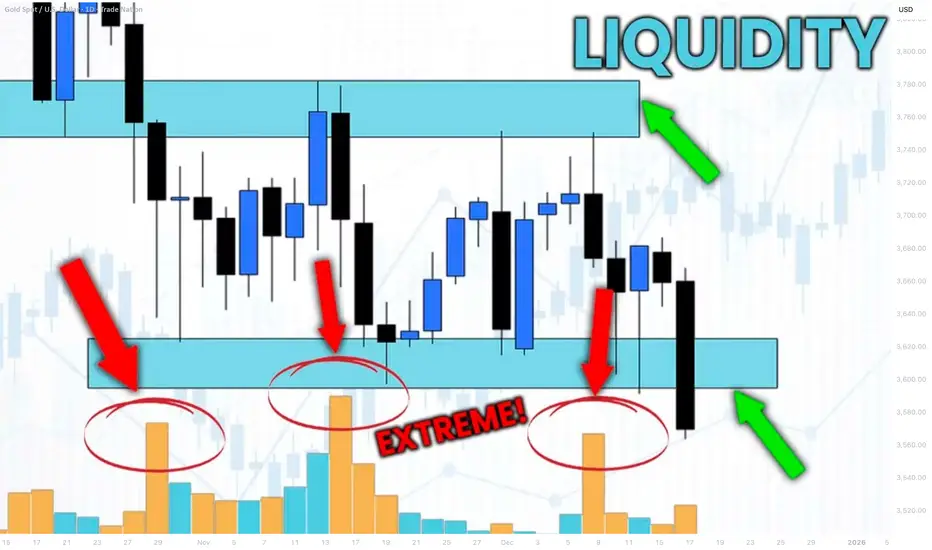
How to Identify Liquidity in Chart with VOLUME Indicator
Smart Money Concept is all about finding the liquidity .
Liquidity analysis is the essential element of profitable trading SMC.
In this article, I will teach you how to use volume indicator to identify liquidity - supply/demand clusters and hidden zones that move the market.
First, let's discuss what exactly we mean by liquidity.
Analysing any forex pair, you should know that orders of the market participants are not equally distributed among all the price levels.
While some levels and the zones will lack the interest of the market players, some will attract huge trading volumes.
We will call such zones - liquidity zones.
To find these zones, you can execute volume analysis.
By using volume indicator, we will look for volume spikes - it will indicate strong buying and selling activity.
Examine NZDUSD chart on a daily time frame with default volume indicator being added.
I highlighted a recent volume spike.
The elevated volume level confirms that there was strong institutional participation in the formation of this candle.
But you can see that this particular candle has quite a wide rage.
So how do we know where exactly and on what levels liquidity concentrates?
We will need to use another indicator to find liquidity zones - a volume profile.
Here is what this indicator does.
Think of the chart as a battlefield. The Volume Profile shows you exactly where the major fighting between buyers and sellers is taking place. It reveals the price levels where the most orders have been executed.
While a classic volume indicator shows when volume occurred, it lights up the specific price levels where the most trading activity is concentrated.
Analyzing Volume Profile on NZDUSD, we can easily find the exact zone where liquidity was concentrated.
We simply take the entire range of a high volume candle and look for a volume profile spike within.
To identify other liquidity zones, continue searching for volume spikes in Volume indicator.
By the way, adding a Simple Moving Average on your Volume indicator will help you find these spikes easier.
Here are 4 significant liquidity zones that I found using this method.
Please, note that there are 3 high volume candles that were formed within the same liquidity zone.
A combination of a classic Volume indicator and Volume Profile will help you to accurately identify the exact moments of volume increase and the price levels where this rise occurred.
That will be a reliable strategy to find important liquidity zones.
❤️Please, support my work with like, thank you!❤️
I am part of Trade Nation's Influencer program and receive a monthly fee for using their TradingView charts in my analysis.
NQ Power Range Report with FIB Ext - 12/3/2025 SessionCME_MINI:NQZ2025
- PR High: 25633.50
- PR Low: 25610.00
- NZ Spread: 52.5
Key scheduled economic events:
08:15 | ADP Nonfarm Employment Change
09:45 | S&P Global Services PMI
10:00 | ISM Non-Manufacturing PMI
- ISM Non-Manufacturing Prices
Session Open Stats (As of 12:15 AM)
- Session Open ATR: 469.32
- Volume: 24K
- Open Int: 302K
- Trend Grade: Long
- From BA ATH: -2.7% (Rounded)
Key Levels (Rounded - Think of these as ranges)
- Long: 26636
- Mid: 25410
- Short: 23426
Keep in mind this is not speculation or a prediction. Only a report of the Power Range with Fib extensions for target hunting. Do your DD! You determine your risk tolerance. You are fully capable of making your own decisions.
BA: Back Adjusted
BuZ/BeZ: Bull Zone / Bear Zone
NZ: Neutral Zone