ETHUSD Wait for BuyNow at time price retirement at 3124.91 point then its given clear Buy Conformation then I will a Buy Position .
DISCLAIMER
This is made for educational and informational purposes only.
It is not financial, investment, or trading advice.
Trading involves risk, and past performance doesn't guarantee future results.
Always do your own research or consult a licensed financial advisor
before making any trading or investment decisions.
The creator is not responsible for any profit or loss from your actions.
We don't offer paid signals or account management services.
Beware of scammers using our name - we are not connected to them.
Volumespreadanalysis

SOLUSD SELL FOR THE BUY SIDENow this time Price move 134.57 .its come down at 131.89 here hits Fibonacci golden zone ,fair-value-gap(FVG)also have Internal Liquated sweep point take Clear Conformation they goes for a BUY Entry
DISCLAIMER
This is made for educational and informational purposes only.
It is not financial, investment, or trading advice.
Trading involves risk, and past performance doesn't guarantee future results.
Always do your own research or consult a licensed financial advisor
before making any trading or investment decisions.
The creator is not responsible for any profit or loss from your actions.
We don't offer paid signals or account management services.
Beware of scammers using our name - we are not connected to them.

Gold More Chances to Buy Now at this its price on exactly on VALUE AREA LOW POINT .its more Chances to goes Bullish side at 4370.289 to 4382.893 (POC and Value Area High ) these area are Struggling for if price break that level then will be another BULLISH Move 4548.009.
let’s see how price reacts around this level
DISCLAIMER
This is made for educational and informational purposes only.
It is not financial, investment, or trading advice.
Trading involves risk, and past performance doesn't guarantee future results.
Always do your own research or consult a licensed financial advisor
before making any trading or investment decisions.
The creator is not responsible for any profit or loss from your actions.
We don't offer paid signals or account management services.
Beware of scammers using our name - we are not connected to them.

AAPL Long 1D Investment Conservative TradeConservative Trade
+ long impulse
+ 1/2 correction
+ SOS level
+ support level
+ volumed 2Sp+
? technical volume
Calculated affordable stop market
1 to 2 R/R take profit within 1D range
Monthly Trend
"+ long impulse
+ neutral zone 2
+ long volume distribution"
Yearly Trend
+ long impulse
+ neutral zone 2
- beyond rotation point
+ long volume distribution

Silver BULLISH Direction Silver Price Closed the above 75.20095 Resistance area, its Slow form to move up at 80.48488 Point if price closed above that level then price up side .
DISCLAIMER
This is made for educational and informational purposes only.
It is not financial, investment, or trading advice.
Trading involves risk, and past performance doesn't guarantee future results.
Always do your own research or consult a licensed financial advisor
before making any trading or investment decisions.
The creator is not responsible for any profit or loss from your actions.
We don't offer paid signals or account management services.
Beware of scammers using our name - we are not connected to them.

BTC Big Direction is Sell Side At Time BTC move is consolidation Not Found Clear up and Down Move ,Wait for Clear Move for BUY side in GREEN Line & SELL side for a RED Line

AAPL 1H Long Swing Conservative TradeConservative Trade
+ long balance
+weak approach
+ 1/2 correction
+ SOS test / ICE level
+ support zone
+ biggest volume 2Sp=
Calculated affordable stop market
1 to 2 R/R take profit
1D Trend
"+ long impulse
+ 1/2 correction
+ SOS level
+ support level
+ volumed 2Sp+
? technical volume
+ weak test"
1M Trend
"+ long impulse
+ neutral zone 2
+ long volume distribution
+ before rotation point"
1Y Trend
"+ long impulse
+ neutral zone 2
- beyond rotation point
+ long volume distribution"


Long 1D Investment TROW Conservative TradeConservative Trade
+ long impulse
+ 1/2 correction
+ SOS level
+ supporting zone
? ultravolume 2Sp+
= perforated T2
+ 1/2 correction
+ volumed 2Sp+
+ weak test
+ first bullish bar close entry
Calculated affordable stop limit
1 to 2 R/R take profit
- outside 1D range
+ inside 1M range
Monthly CounterTrend
"- short balance
+ expanding ICE
+ support zone
+ biggest volume 2Sp+
+ weak test
+ 1/2 correction"
Yearly Trend
"+ long impulse
+ 1/2 correction
? strong approach
+ T2 level
+ supporting zone
+ volumed interaction bar"

Long 1H Swing TROW Conservative TradeConservative Trade
+ long balance
+ 1/2 correction
+ ICE level
+ supporting zone
+ biggest volume old spread Sp
? weak test
+ first bullish bar closed entry
Calculated affordable stop limit
1 to 2 R/R take profit
- outside 1H range
+ within 1D main range
Daily Trend
"+ long impulse
+ 1/2 correction
+ SOS level
+ supporting zone
? ultravolume 2Sp+
= perforated T2
+ 1/2 correction
+ volumed 2Sp+
? weak test"
Monthly CounterTrend
"- short balance
+ expanding ICE
+ support zone
+ biggest volume 2Sp+
+ weak test
+ 1/2 correction"
Yearly Trend
"+ long impulse
+ 1/2 correction
? strong approach
+ T2 level
+ supporting zone
+ volumed interaction bar"

Long 1H Swing Conservative TradeConservative Trade
+ long balance
+ 1/2 correction
+ ICE level
+ supporting zone
+ biggest volume old spread Sp
Calculated affordable stop limit
1 to 2 R/R take profit
- outside 1H range
+ within 1D main and perforated ranges
Daily Trend
"+ long impulse
+ 1/2 correction
+ SOS level
+ supporting zone
? ultravolume 2Sp+
= perforated T2
+ 1/2 correction
+ volumed 2Sp+
? weak test"
Monthly CounterTrend
"- short balance
+ expanding ICE
+ support zone
+ biggest volume 2Sp+
+ weak test
+ 1/2 correction"
Yearly Trend
"+ long impulse
+ 1/2 correction
? strong approach
+ T2 level
+ supporting zone
+ volumed interaction bar"

TROW Long 1D Investment Conservative TradeConservative Trade
+ long impulse
+ 1/2 correction
+ SOS level
+ supporting zone
? ultravolume 2Sp+
= perforated T2
+ 1/2 correction
+ volumed 2Sp+
Calculated affordable virtual stop limit
1 to 2 R/R take profit
- outside 1D
+ inside 1M
Monthly CounterTrend
"- short balance
+ expanding ICE
+ support zone
+ biggest volume 2Sp+
+ weak test
+ 1/2 correction"
Yearly Trend
" '+ long impulse
+ T2 level
+ support zone
- deep correction
+ volumed interacting bar"

OVERVIEW BTC H1 CHART I 12/17
1. Volume Profile & Market Structure
The chart utilizes the Volume Profile to identify key liquidity zones:
POC (Point of Control) at 87,173: This is the price level with the highest traded volume. Since the current price (86,574) is trading below the POC, the bears (sellers) have a slight upper hand in the immediate short term.
VAH (Value Area High) at 88,294: This acts as a major overhead resistance. If the price reclaims the POC, this will be the next target.
VAL (Value Area Low) at 86,138: This is the crucial support zone right below the current price.
2. Trendline Analysis
Ascending Support Line: There is a clear upward trendline acting as a floor for recent pullbacks. The price is currently approaching this line (around the 86,000 - 86,200 area).
Descending Resistance: A short-term downward trendline from recent peaks is squeezing the price, forming a narrowing triangle pattern.
3. Potential Price Scenarios
BTC is currently in a sideways consolidation phase within a tight range (86,000 - 87,500).
Bullish Scenario: If the price holds above the VAL (86,138) and bounces off the support trendline, it needs a candle close above the POC (87,173) to confirm a recovery toward 88,300 and potentially retest the 90,000 psychological level.
Bearish Scenario: If an hourly candle closes below 86,100 (breaking both the VAL and the diagonal support), we could see a rapid drop to deeper support levels at 85,000 or 84,200 to seek new liquidity.
4. Summary Verdict
The price is at a critical pivot point. While there is significant buying interest visible in the 86,000 volume cluster, the selling pressure near 88,000 remains heavy.
Key Takeaway: Monitor the 86,100 level closely. It is the most important "defensive line" for the bulls right now. If this level fails, expect further downside.

MRK 1H Conservative Short SwingTradeConservative Trade
+ short impulse
+ 1/2 correction
+ BUI test level (exhaustion volume?)
+ weak approach
+ biggest volume Ut?
+ weak test
+ first bearish bar close entry
Calculated affordable virtual stop
(bought puts)
1 to 2 R/R take profit
1D Trend
"+ short impulse
+ short volume distribution
+ neutral zone 2"
1M Trend
"+ short impulse
+ 1/2 correction
+ resisting bar level
+ resistance level
- strong approach from far
+ volumed manipulation bar"
1Y CounterTrend
"+ long impulse
+ 1/2 correction"

Brian|watch reaction at POC–VAL –VAH according to Volume ProfileXAUUSD – Brian | watch reaction at POC – VAL – VAH according to Volume Profile
1. Market snapshot
Gold is entering a redistribution phase in the high price range, with fluctuations mainly revolving around large volume clusters on the Volume Profile. In this context, Brian's current priority scenario is to watch for a Sell when the price approaches the POC / VAL / VAH areas – where the market previously traded heavily.
2. Volume Profile – Notable price areas
POC – VAH area 4.217 is the price area where buyers/sellers previously "struggled" strongly, suitable for looking for sell signals if there is a rejection reaction.
VAL & the support area below around 4.134 is where short-term buying force may appear, suitable for a technical rebound buy scenario.
3. Trading plan (this week)
Scenario 1 – Sell according to Volume Profile (priority)
Sell: 4.217
SL: 4.125
TP: 4.200 – 4.182 – 4.150
Idea: wait for the price to rebound to the POC/VAH area around 4.217, observe the H1/M30 candle reaction. If a clear rejection signal appears (long upper tail, reversal candle...), the sell order can be activated according to the plan.
Scenario 2 – Short buy at VAL/support area
Buy: 4.134
SL: 4.125
TP: 4.155 – 4.180 – 4.200
Idea: if the price adjusts deeply near the VAL area and holds above 4.125, a technical rebound may occur. This is a short buy, not going too far against the trend, prioritizing partial profit-taking when the price returns to the upper POC area.
4. News to watch – Unemployment Claims
Today there are US Unemployment Claims figures, which are quite sensitive data for gold because:
The market will assess the strength/weakness of the US labor market.
Worse-than-expected figures → increase the likelihood of Fed easing → positive for gold.
Better-than-expected figures → support USD, may cause gold to face adjustment pressure.
Therefore, it is advisable to limit new orders close to the news release time, wait for the post-news candle to stabilize, and then reassess the structure.
5. Risk management (user-friendly for phone users)
Sell is the priority scenario but do not overlook SL 4.125, to avoid the case of a strong breakout above the current volume cluster.
With the Buy 4.134 scenario, it is advisable to split TP, move SL to breakeven when the price hits TP1 to reduce the pressure of having to "watch the chart" continuously on the phone.
If D1/H4 closes below the 4.125 area with large volume, Brian will consider it a signal to reduce short-term buying expectations and wait for a clearer new structure.

MGNT Short 5M Conservative CounterTrend DaytradeConservative CounterTrend trade
+ short impulse
+ resisting bar test level
+ 1/2 correction
+ weak approach
+ biggest volume 2Ut-
- manipulation signal configuration needs a test
Calculated affordable virtual stop
1 to 2 R/R take profit
1H Countertrend
"- long impulse
+ volumed TE / T1
+ weak approach
+ biggest volume 2Ut-"
1D Trend
"+ short impulse
+ BUI level
+ 1/2 correction
+ resistance level
- volumed retest"
1M
Trend
"+ short impulse
= neutral zone type 2
+ continuation of the trend"
1Y CounterTrend
"- long impulse
- T2 level
- support zone
- 1/2 correction
- biggest volume Sp?
+ model doesn't work"

KHC Short 5M Aggressive Trend DayTradeAggressive Trend Trade
- long impulse
- unvolumed T1
+ resistance zone
+ biggest volume 2Ut+
+ weak test
+ first bearish bar closed entry
Calculated affordable virtual stop loss
Bought puts
1 to 2 R/R take profit
1H Trend
"+ short impulse
+ BUI level
+ resistance zone
+ 1/2 correction
- strong approach"
1D Trend
"+ short impulse
+ BUI test / T2 level
+ resistance zone
+ volumed 2Ut+"
1M Trend
"+ short impulse
= neutral zone 2"
1Y
Trend
no context

DTM Investment 1D Conservative CounterTrend TradeConservative CounterTrend Trade
+ short impulse
- unvolumed T2 level
+ resistance level
+ 1/2 correction
+ weak approach?
+ biggest volume 2Ut-
- interaction bar bigger volume
Calculated affordable virtual stop loss
1 to 2 R/R take profit
Bough put
Monthly CounterTrend
"- long impulse
- unvolumed T1
+ resistance level
+ biggest volume 2Ut-
+ more volume on reaction bar"
Yearly CounterTrend
"- long impulse
- neutral zone 2
- continuation if the trend
+ exhaustion volume?"

IREN 5M Short Conservative Trend DayTradeConservative Trend Trade
+ short impulse
+ unvolumed T2
+ resistance zone
- before 1/2 correction
+ strong approach
+ volumed 2Ut+
+ weak test
+ first bullish bar close entry
Calculated affordable virtual stop loss
1 to 2 R/R take profit within 5M range
Bought put
1D Trend
"- short balance
+ volumed T2
+ resistance zone
+ 1/2 correction
- strong approach
+ biggest volume 2Ut-"
1M CounterTrend
"- long impulse
+ volumed T1
+ resistance zone
+ weak approach
+ biggest volume Ut
+ test"
1Y CounterTrend
"- long impulse
= neutral zone
+ exhaustion volume?"

NRG 1H Swing Short Conservative CounterTrend TradeConservative CounterTrend Trade
+ short impulse
+ resisting bar level
+ 1/2 correction
+ resistance zone
+ volume Ut?
Bought put
Calculated affordable virtual stop
1 to 2 R/R take profit before 1/2 1D
Daily CounterTrend
"- long impulse
+ volumed T1
+ resistance zone
- strong approach
+ volumed 2Ut+"
Monthly CounterTrend
"- long impulse
- unvolumed T1
+ resistance zone
+ volumed manipulation bar
- volumed reaction bar looks for break
- volume distribution is long"
Yearly CounterTrend
"- long impulse
= neutral zone"

DIA 1H Swing Short Conservative CounterTrend TradeConservative CounterTrend Trade
+ short impulse
- resisting bar level below BUI
+ resistance zone
+ 1/2 correction
+ volumed 2Ut-
Bought a put
1 to 2 R/R take profit
1D CounterTrend
"- short balance
+ biggest volume expanding CREEK
+ volumed 2Ut+
+ weak test"
1M CounterTrend
"- long impulse
- neutral zone
+ exhaustion volume?"
1Y CounterTrend
"- long impulse
+ beyond rotation point
- neutral zone"

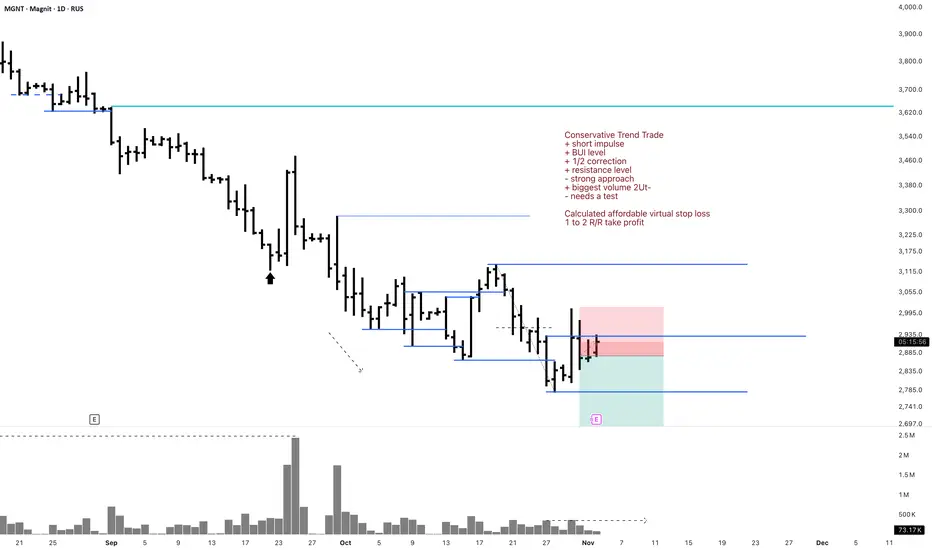
MGNT Conservative Trend TradeConservative Trend Trade
+ short impulse
+ BUI level
+ 1/2 correction
+ resistance level
- strong approach
+ biggest volume 2Ut-
- needs a test
Calculated affordable virtual stop loss
1 to 2 R/R take profit
Daily Trend
"+ short impulse
+ BUI level
+ 1/2 correction
+ resistance level
- strong approach
+ biggest volume 2Ut-
- needs a test"
Monthly Trend
"+ short impulse
= neutral zone type 2
+ continuation of the trend"
Yearly CounterTrend
"- long impulse
- T2 level
- support zone
- 1/2 correction
- biggest volume Sp?
+ long setup
+ model doesn't work"
OKE 1D Investment Short Conservative Trend TradeConservative Trend Trade
+ short impulse
+ T2 level
+ resistance zone
+ biggest volume Ut
+ weak test?
Bought a put
1 to 2 R/R ratio
1M Trend Trade
"+ short impulse
- neutral zone"
1Y CounterTrend Trade
"- long balance
+ biggest volume resistance level
+ volumed reaction bar"
