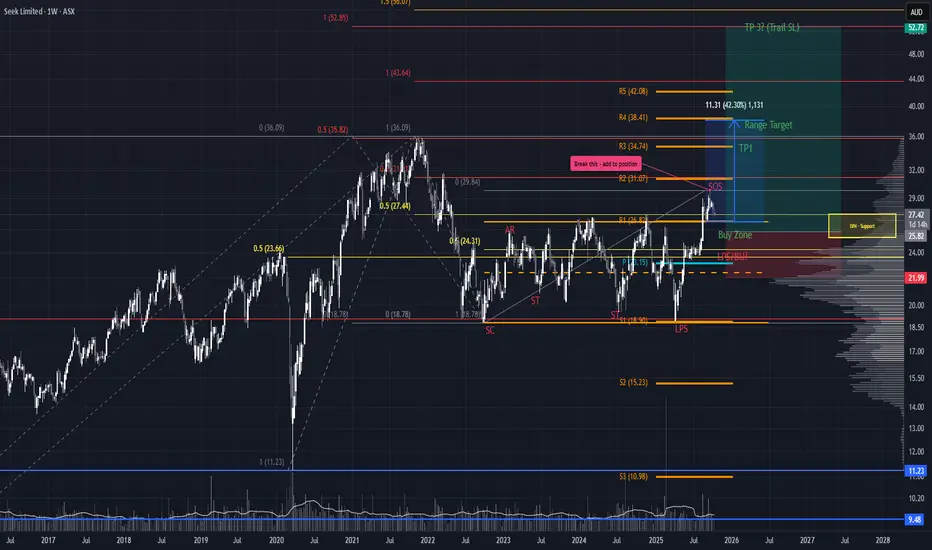
3-Year Breakout with LVN PrecisionSEEK has broken out of a multi-year range and is now testing the upper boundary to gauge buyer commitment. This is a critical zone. Price action here will reveal whether markup is ready to accelerate or pause for a reload.
Trade Scenario
Begin scaling in as price has reached the top of a Low Volume Node. This zone typically lacks price acceptance, so there is a strong chance of a brief dip before continuation. If price does pull back, monitor the buy zone for a second entry/scale in opportunity.
Risk management remains essential. Since a higher low has not yet formed, the stop loss should sit below the Last Point of Support. Once a new higher low is confirmed, the stop can be moved accordingly to lock in structure.
Targets
Initial target sits just below the all-time high
For extended upside, trail the stop loss using newly formed swing lows to capture continuation
Volume
MARA: shoulders done, now walk toward the targetOn the daily chart, MARA completed a textbook inverse Head & Shoulders reversal with a clear breakout above the descending trendline. A corrective pullback followed, and the price is now heading into the key buy zone at 15.21–15.77 - aligning with the 0.72 and 0.79 Fibonacci retracements, and the upper boundary of the broken channel. This is the area to watch for a potential continuation of the bullish impulse.
Volume on the breakout was above average, confirming strong buyer interest. The EMAs are trending below the price, supporting the upward structure. The first target is located at 21.57 (previous resistance), with a potential extension to 28.77 (Fibonacci 1.618).
Fundamentally, MARA remains highly correlated with BTC and crypto sentiment. As interest returns to crypto-related assets due to ETF flows and possible Fed easing, mining stocks like MARA gain attention. Recent reports also show improved production efficiency and lowered costs - a tailwind for bulls.
Tactically, the best setup would be a confirmed reaction from the buy zone — whether a strong candlestick formation, volume surge, or reclaim of a key level. If that happens, aiming for 21.57 and 28.77 becomes a solid plan.
The pattern played out - now it's time for the market to walk the talk.

XRPUSDT — consolidation before the next impulseOn the 1H chart, XRPUSDT is consolidating after a short pullback, forming a flag pattern above the 2.45 support area. Despite a few false breaks, buyers continue to defend the trendline, signaling demand absorption.
The 2.45–2.52 range remains pivotal. A breakout with confirmation could open the way toward 2.63 (Target 1) and 2.82 (Target 2) — the next supply zones. As long as the higher-low structure holds, the bullish scenario remains intact.
Fundamentally, XRP still shows resilience amid the broader altcoin weakness. Ripple’s ongoing expansion in cross-border payments and hopes for a clearer regulatory framework in the U.S. support investor confidence.
This is a classic accumulation phase — expectations may diverge from reality, but that’s where strong trends are born. Keep emotions aside and wait for a clean breakout signal.

How To Short Sell Using The 3-Step Rocket Booster StrategyYesternight i stood outside thinking
about the love of my life.
How she will look after my future daughter.
I thought about having a wife.How beautiful she will look,
how happy she will be looking
after me and the children
and how i will support her dreams and
the children's dreams.
Basically i was meditating man.
My thoughts lost in limbo.
That's how i like it.I want to be lost
Being lost is one of the best spiritual things
i have experienced.
Have you ever arrived home not sure
if that's your home?
Maybe i was too paranoid but that's
how i like it..
The market is full of fear, and learning how
to short sell is something not easy
But mastering how to short sell.
Has been one of the most
rewarding things ever.
Its basically the rocket booster strategy
but now in reverse.
Step 1-The price should be below the 50 EMA
Step 2 -The price should be below the 200 EMA
Step 3- The price should trend downwards.
Now the rules of short selling
are counter intuitive -- as Tim Sykes says.
This means its the reverse.
In this chart the momentum is leaning
towards a breakdown pattern.
On a bullish hammer turning
into a spinning black top
showing you that there is extreme fear on this chart
The crash of this currency is as a result
of the tarrif wars.
Also the drop in the bond yeilds.
Learning how to short
sell is the best thing ever.
Learn how to short sell
this is you test to become a professional trader.
Rocket boost this content to learn more.
Disclaimer: Trading is risky please learn risk management
and profit taking strategies.Also feel free to use
a simulation trading account before you trade with real money.
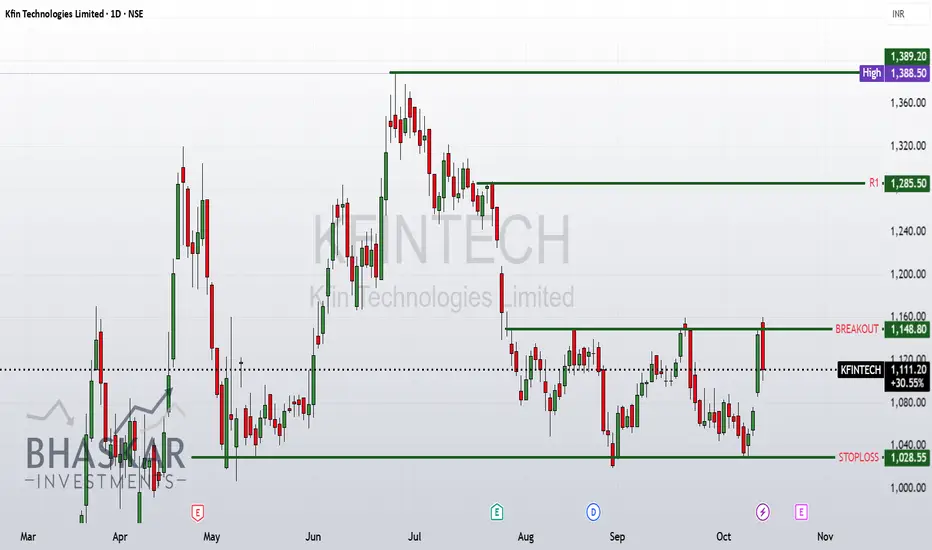
Increasing RSI with volumeKFin Technologies Limited is a leading technology-driven financial services platform. The company provides services and solutions to asset managers and corporate issuers across asset classes in India and provides several investor solutions including transaction origination and processing for mutual funds and private retirement schemes in Malaysia, the Philippines and Hong Kong.
This is purely technical based entry with support and resistance drawn on the chart.
Disclaimer:
I am NOT a SEBI registered advisor nor a financial advisor.
Any investments or trades I discuss on my blog are intended solely for educational purposes and do not represent specific financial, trading, or investment advice.
Disclosure:
I, the author of this report, and my immediate family members do not have any financial interest or beneficial ownership in the securities mentioned herein at the time of publication.
2 btc scenarios just curious. my 2 ideas of whats next on btc.
levels from volume profiles.
squiggle lines from tingling in ballsack.

Bitcoin: What's Next After Friday's Dump?Last week, Bitcoin dumped from new all time highs at $126000 down to about $102000 in a matter of hours after President Trump announced the tariffs against China. Widespread panic led to massive liquidations with some altcoins even going to 0.
So the question now is how's the chart looking? What's next?
The perspective that I'm maintaining here is that Bitcoin is still in the Value Area and continuing to range, even though it swept the lows last week. As long as this range holds, I plan to continue to trade the range.
The VAL of the range is at about $111000, which is going to be a key level for me to watch. If price begins closing below this level on the 4H timeframe, I'm then looking at $107000 as the only support level remaining before another stab at $100000. It is rather common for price to fill long liquidation wicks that are left behind, so the chances of that happening here aren't insignificant. However, I don't believe that alt-coins will make new lows unless Bitcoin goes into a full blown bear market.
Furthermore, on the Daily Timeframe, it does seem as if price just made a lower high which could point towards a further move lower and the recent bounce since Sunday being a potential dead cat bounce.
Risk management is going to be of utmost importance and crypto/Bitcoin markets are extremely volatile.

EOG Resources Breaks Down from Double Top – Bearish Outlook1. Double Top Breakdown
EOG Resources has recently broken down from a Double Top pattern .
This signals a bearish reversal after failing to sustain at higher levels.
2. Volume Surge Confirmation
The breakdown was supported by a volume surge on the 2nd last trading day .
Increased selling pressure adds conviction to the bearish move.
3. 200D SMA Rejection
The stock recently tested the 200-Day Simple Moving Average (SMA) and reversed from it .
This indicates strong resistance at that level and aligns with the bearish bias.
4. Price Target
Based on technical setup and momentum, the next downside target is projected at 114.5 .
5. Technical Confluence
Breakdown from a Double Top formation.
Strong volume surge confirming the selling pressure.
Reversal from the critical 200D SMA resistance.
All factors point toward continued downside momentum.

VISTA/USDT Daily Chart Swing Trading - Long PositionVISTA/USDT Daily Chart Swing Trading - Long Position
Enter a long position around the current price of 5.320 USDT, with a stop-loss set at 4.000 USDT.
- For the first target around 8.880 USDT: Reduce the position by half and trail the stop-loss.
- For the second target around 14.000 USDT: Reduce the position by half again and trail the stop-loss.
- For the third target around 21.350 USDT: Reduce the position by half once more and trail the stop-loss.
- For the fourth target around 45.580 USDT: Reduce the position by half further and trail the stop-loss.
Leave the remaining position untouched; continue to reduce positions and trail the stop-loss as the trade progresses.

GADT LongNot only GADT broke its all-time high but also gave a channel breakout in July 25'. However, that breakout couldn't last long and turned into fake-out.
Multiple reasons included a parabolic move, taking price action away from SMA-10, not so good result of Q4 and no dividend payout.
Now the price has re-tested its all-time high breakout level, SMA-10 is now very near and all-time high volumes in July signal entry of some player.
The next target will be channel top of 410, then recent high of 569, followed by all-time high breakout target of 600 and then ABCD pattern target of 750.
This is my own opinion and not a buy / sell call.

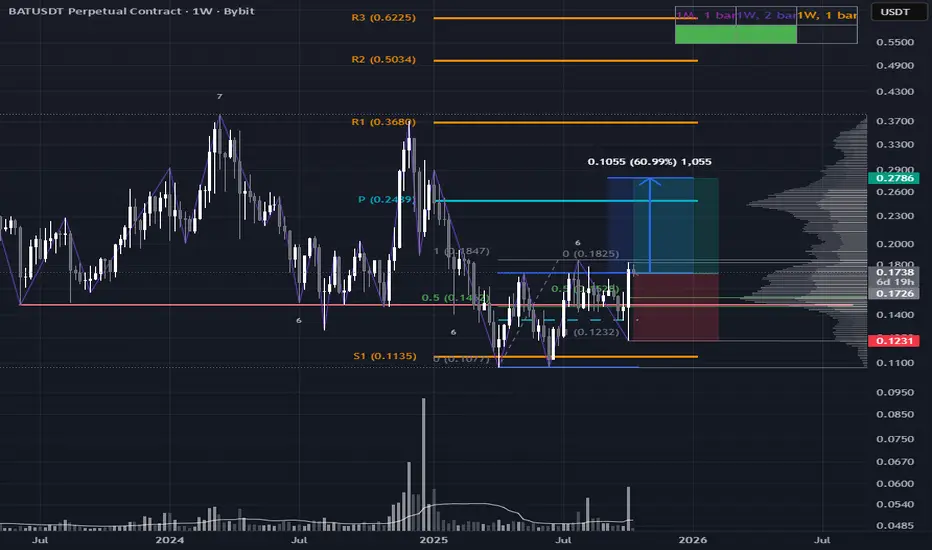
BAT Resilient Post-Liquidation: Swing Trade PotentialWhile most altcoins broke its range lows and printed fresh lows following the October 10th liquidation flush, BAT held its ground and gained! This is a very bullish signal.
The weekly candle closed strong on increased volume, signaling quiet accumulation beneath the surface. No need to overcomplicate: this setup speaks for itself.
Minimal range target: 0.2786
Stop loss options:
Simple: use the weekly swing low
Advanced: refine on the daily TF for tighter SL and improved R:R
This structure offers a clean swing setup with asymmetric potential.
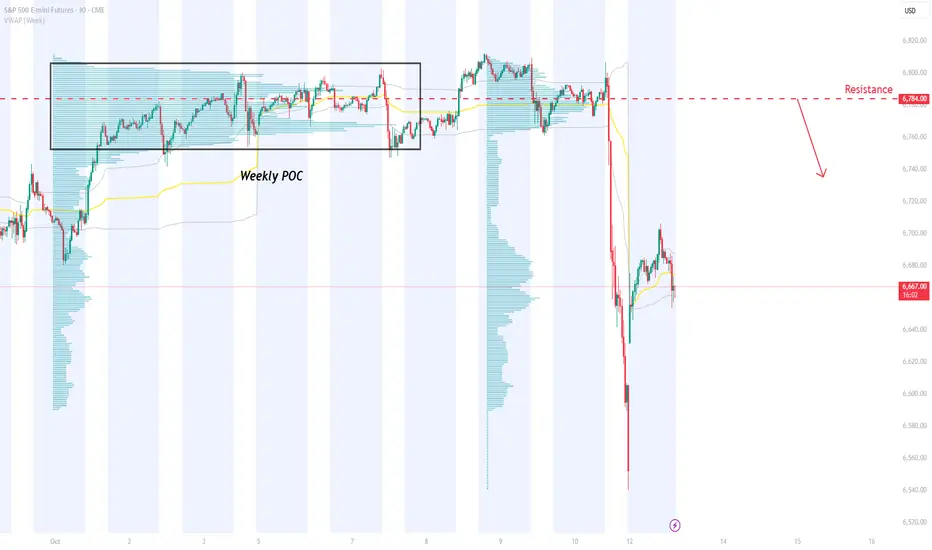
ES – Weekly POC Resistance at 6784 with Bearish Fair Value GapOn ES 30M chart, strong sellers accumulated around 6784 — the Weekly Point of Control and origin of Friday’s sharp sell-off. This heavy-volume zone marks where institutional selling began. The area also overlaps with a large bearish Fair Value Gap, reinforcing it as a key resistance. I’ll look for a pullback to this level for a short setup.
USD/CAD – Weekly POC Support at 1.3952 with Bullish FVGOn USD/CAD 30M chart, buyers built strong positions at 1.3952 — the Weekly Point of Control and origin of a bullish move. This area also aligns with a Fair Value Gap, making it a key support for a long entry on pullback.

USD/CHF – Heavy Volume Zone Meets Bearish Fair Value GapOn USD/CHF 30M chart, strong sellers built positions around 0.85051 — a heavy-volume zone followed by a sell-off. This area also aligns with a bearish Fair Value Gap, making it a key resistance. I’ll look for a pullback to this zone for a short entry.

Start of Altseason and Ethereum's RiseHello friends 👋
I've posted my Ethereum analysis for you ✍️. Given the oversold zone on the RSI 📉 and Ethereum's past history 📜, I predict we will see a significant surge in the next two months 🚀—around 130% 💹, reaching a price of $8,000 USDT for Ethereum 💎.
Furthermore, the altcoin season is also expected to happen during this period 🌕.
I hope you'll also share your own thoughts about the market in the comments section 💬.
📢 Important Note: This is solely an analysis/prediction, and the responsibility for any trading or investment decisions is entirely your own! ⚠️

October 13 - October 17 2025I decided to go through and consolidate my charts this week to make for easier decision making. Friday’s sell off was a sign of weakness in a market that was already showing strain. While the drop on resumed trade war threats was swift, the rest of the market had a muted response. Heading into this week, we should see another big move and I will try to be open to trading either side depending on how this develops.
1. Macro
Gold is still in its uptrend and that is unlikely to change anytime soon. I don’t have it charted here, but Gold’s volatility index CBOE:GVZ spiked during Friday’s session, however buyers seemed to be absorbing the volatility since it still closed up over 1%. Gold has already made a new ATH today and I do not expect to see the trend change this week.
The dollar TVC:DXY seems to be near the top of its deviation from the flat EMA. I think we will see the dollar move lower which could boost Gold, Stocks, or both. Next, we saw TVC:US03MY remain relatively flat during Friday’s sell off while TVC:US10Y moved sharply lower during the session, making the TVC:US10Y -US03MY spread very tight once again. Since real yields are still edging up and the 3M bond stayed flat during the panic, that leads me to believe the bond market volatility was contained and may not be indicative of a true risk-off reaction.
One reason why US Treasuries will continue to catch a bid is that as forward inflation expectations continue to slide (bottom left chart), the real return is still attractive compared to bonds from other major countries. We’ll see if the renewed trade sparring will change the forward inflation exceptions trend since the data from TIPS is delayed, however for now I’ll continue to base my perception on what I’m currently seeing on the chart.
Lastly, Oil is continuing to see an average decline. Hopefully middle eastern peace efforts are successful, which could keep the price subdued. On the bottom chart I have combined the average of MCX:COPPER1! and Corn CBOT:ZC1! into a single line compared to TVC:DXY , which aims to show real demand (and/or inflation) pressure against the Dollar’s relative strength. Here we can see commodities took a hit on Friday but the trend is still very strong to the upside. Since forward inflation expectations are down and the dollar is flat, this may be pointing to the presence of real demand, which should be bullish for equities.
2. Risk
Even when looking at the past six months on a line chart, the pullback, Friday’s drop was significant. As I mentioned last week, there are important risk-health items to watch for here. I’m now just charting the High Yield OAS - Investment Grade OAS spread, which was already starting to move up before Friday’s sell off. This data is only reported once per day for the previous session, so the impact on corporate bond yields is not yet known. This will be very important to pay attention to, as it could signal true aversion to risk.
Next, the $ES1!/GOLD spread is declining and should continue until Gold enters a re-accumulation phase. Anyone’s guess when that will be so for now I think it’s safe to assume that Stocks will continue to underperform Gold, and if Friday’s drop was any indication of which side is in control, it serves as confirmation that stocks are sensitive to bad news. Buyers seem to be the ones getting absorbed.
The third chart on the top shows that although CME_MINI:NQ1! has been outperforming CBOT_MINI:YM1! since the market bottomed, the momentum seems to be stalling out. I’ll be looking at the sectors to find any further signs of sustained rotation.
3. Sector Analysis
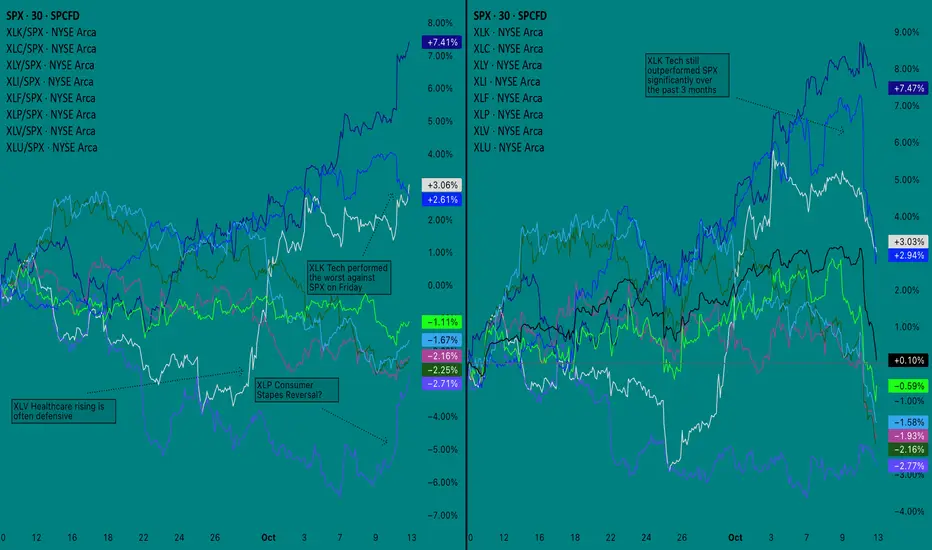
My notes are best explained in the screenshot but my comment is that most of the decline on Friday came from AMEX:XLK (Tech sector) selling off. Other sectors performed better against SPX, with AMEX:XLP (Consumer Staples) seemingly breaking out of a decline, however as you can see from the chart on the right, it has still been the worst performer against the other indices over the past three months.
One session is not enough to change the trend, however it will be important to watch for continued rotation out of tech and into other sectors. This could cause CME_MINI:NQ1! to decline against CBOT_MINI:YM1! as I suggested earlier, and would signal the market is positioning for a more sustained downturn - likely caused by disappointing growth.
4. Bias
This is the chart I have tried to condense the most. I have switched to just using Line Break as my main chart for ES, which I found performed better than Renko when combined with my other indicators. On the lefthand side, I am using Session CVD but got rid of my other indicators and made a CVD Momentum indicator, which tracks the momentum of CVD rising or falling over an anchor period (1 week). I’m still using a range chart calculation for this chart, currently set to 20R.
On the right, I am using what I’ll call my Volatility Dashboard, however it does not start producing a useful signal until premarket. Based on Volatility, it can be said with certainty that dealers went long on puts right before the sell-off began.
From a technical standpoint, the price was in a rising wedge and dumped after it made a higher high that did not reach the upper trend line. Rising channels are generally bullish, however the extent of Friday’s free fall could mean that even if the price quickly recovers, it may be forming a top similar to what we saw last December. This is why risk indicators like corporate bond spreads, sector performance, and changes to the macro structure will be important to monitor over the coming days.
—
Conclusion
For this week, all I can say with certainty is that I think there will be some good opportunities. Here is what I believe can be safely assessed from this analysis:
1. Stocks remain under pressure, however “smart money” will require more time to rotate out of tech, leading to repeated retests of the top of the range.
2. Tailwinds for stocks are potential real demand in agriculture and industrial material that is not impacting the market’s forward inflation expectation.
3. “Smart Money” will sell volatility (puts) into pullbacks if the price is set to be driven higher, or will do the opposite, buying volatility (puts) and selling calls on low volume rips
This is why I will be looking for more confirmation before taking a side, as the market’s goal now is to clear out liquidity. When it comes to the larger trend, I tend to think that stocks do not seem to be showing strength over the larger macro structure, however that does not necessarily dictate that the index will come down another 8%. Instead, I think at the very least we will stay in a flat range for the time being.
I do not think the market is ready to go on a bull run, nor do I think the environment is showing a risk-off bias that is strong enough to warrant stocks going straight down. If we meet resistance near the top of the range, I’ll look at volatility positioning and CVD for the signal to go short. Conversely, if we make a higher low I will go long on calls to the top of the range.
Good luck to all and thanks for reading!
Manuka Resources (ASX: MKR) – Australia’s only near-term silver Manuka Resources is positioning itself as the only near-term silver producer on the ASX. The company’s Wonawinta Mine in New South Wales is fully permitted and infrastructure-ready, with a confirmed 10-year mine life and planned output of 13.2 Moz silver.
At current silver prices above A$70/oz, and an AISC of around A$31/oz, the project has one of the highest operating margins in the sector. Metallurgical issues from previous operations have been resolved through a new log washer, clearing the way for restart.
Manuka recently restructured its debt, replacing a Hong Kong lender with a consortium of existing shareholders — significantly improving financial flexibility. A binding term sheet with non-bank lenders is now in place to fund the restart, targeting first production and cashflow in Q1 2026.
Additional leverage comes from the Mount Boppy gold project (feed-ready ore) and the large-scale Taranaki vanadium–titanium–iron sands project in New Zealand, which could become a future growth pillar.
With financing near completion and silver momentum building, Manuka stands as a high-leverage, near-term play on rising silver prices.
Please, do your own research!

Fear-Fueled Shakeout Sets the StageMassive liquidation shook the crypto space on Friday, October 10th with nearly $20B flushed out. But while the masses panicked, the charts show smart money buying.
LINK printed a textbook high-volume spring out of the range, signaling smart money absorption amid capitulation. The weekly candle closed deep into the range, reinforcing the idea that this wasn’t random volatility, it was structured accumulation and shakeout.
Volume on the Spring exceeded that of the Selling Climax (SC), which sets the stage for a potential retest. But don’t anchor to the $7.64 wick, that’s an anomaly. Instead, watch for price to revisit the EQ of that wick zone to form a higher low (HL) and validate the test.
This setup offers a compelling Risk-to-Reward profile. If the structure holds, a minimal very simple range target sits around ~$66. from here price could go much higher but one step at a time.

gravestone after a strong uptrend gravestone in past week, as long as its below past week high, a shortsell candidate with that stop into consideration.

Pair: EUR/USD Date: 12 October 2025Market Context:
After a long period of consolidation, price broke to the downside aggressively, reaching the next daily support area. A small corrective move followed.
Possible Scenarios:
1. Bearish continuation:
Price may continue lower toward the next sell-side liquidity or retest the previous consolidation zone.
2. Retracement possibility:
The previous imbalance (IMB) might be filled before the market resumes its move toward the same support level.
Outlook:
Overall bias remains bearish as long as price trades below the consolidation range

Pair: XAU/USD Date: 12 October 2025Market Context:
Price moved down for the second time from the same resistance zone around 4050.00, reaching 3950.00, and then reversed upward. This indicates the formation of a new trading range between these levels.
Possible Scenarios:
1. Bearish scenario:
If price rejects the HVA–VP (High Volume Area / Volume Profile level), it could turn bearish again and retest the 3950.00 support zone.
2. Bullish scenario:
If buyers maintain control, price may continue upward toward the 4050.00 resistance for another potential retest.
Outlook:
Currently, market structure shows range-bound behavior between 3950.00 and 4050.00. A clear breakout beyond this range will define the next directional move

Pair: GBP/USD Date: 12 October 2025Market Context:
Price rejected a strong daily support zone, then broke the previous 4H high and started to consolidate around that area.
Possible Scenarios:
1. Bearish scenario:
Price may drop again toward the same daily support, especially if consolidation fails to break higher.
2. Bullish scenario:
Price could continue upward to sweep the last inducement within the current range before showing a potential reaction.
Outlook:
Market currently shows indecision / accumulation behavior around the recent breakout level. Traders should watch for liquidity grab confirmation or clear displacement to confirm the next directional bias

Welcome to the altcoin rally!Now that the long-awaited “re-test” has happened, are you ready for a short but highly impactful altcoin rally?
