Volume

How to find potential strength ; )DISCLAIMER: Trading Forex/Cryptocurrency involves risk and you may lose more money than you started with! These posts are not to be taken as financial advice and I offer NO guarantee that any of these ideas will result in profit. Also, trade ideas may change, depending on ever-changing market conditions. You are trading at your own risk and past performance is NOT indicative of future results. Please, know how much you are willing to risk on EVERY trade that you take and be SMART!
Simplify your trading. Always measure your risk and be okay with being wrong ; ) Wait patiently and get the price that you want. Use the market. Don't let the market use you!

Simple Renko Trading Explained - Pt. 1DISCLAIMER: Trading Forex/Cryptocurrency involves risk and you may lose more money than you started with! These posts are not to be taken as financial advice and I offer NO guarantee that any of these ideas will result in profit. Also, trade ideas may change, depending on ever-changing market conditions. You are trading at your own risk and past performance is NOT indicative of future results. Please, know how much you are willing to risk on EVERY trade that you take and be SMART!
Simplify your trading. Always measure your risk and be okay with being wrong ; ) Wait patiently and get the price that you want. Use the market. Don't let the market use you!

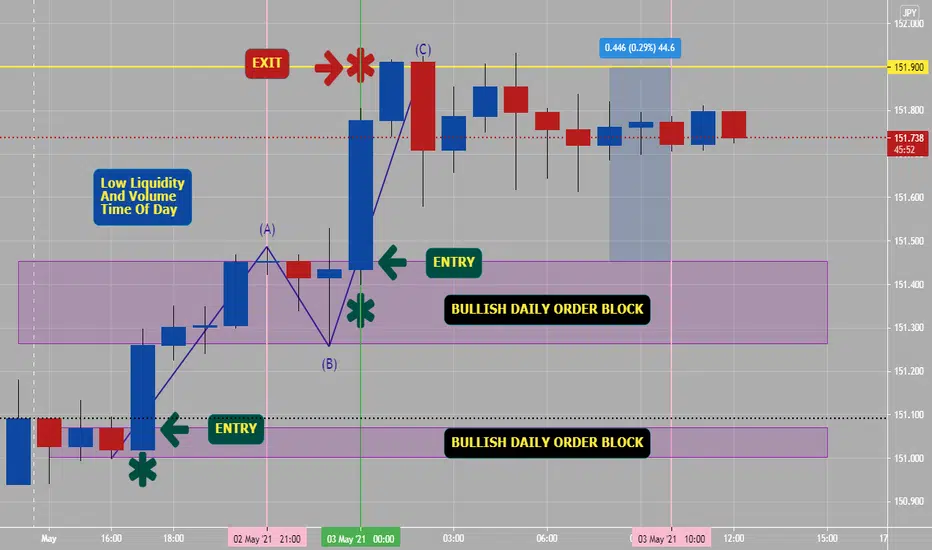
Trade: No, Maybe or Yes!!There are 6 (six) boxes of 4 hour (candlesticks) per day- best times to trade our at end of Tokyo to end of London- related to liquidity and volume.
Please look at hourly chart for more details- convert times to your location.

Money Flow Index: MFI analyses tutorial with 4H candlesticksMFI or Money Flow Index as a strategy is quite similar to RSI or Relative Strength Index. The key differentiator for MFI is the consideration of volume.
Money Flow Index oscillator:
MFI uses both price and volume to measure buying and selling pressure.
MFI oscillates between 0 to 100.
Intuitively, the volume-weighted feature makes MFI a comparatively better 'Lead' indicator than the RSI.
Most reversals can be identified and acted upon best through the Money Flow Index oscillator.
MFI above 80 indicates Overbought territory. It suggests that the underlying asset is driven by a buying pressure.
MFI below 20 indicates Oversold territory. It indicates a selling pressure.
MFI crossing over 20 gives a BUY signal.
MFI crossing down the 80 mark gives a SELL signal.
Stop loss should be used as a precautionary measure.
Trailing stop loss can be used to let the profits ride, while ensuring safety in case of trend reversals.
--------------------------------------------------------------------------------
Comments and feedback would push me to come out with better analyses. Thank you!

Sessions & Overlapping TimesVisualizing the different sessions (Sydney, Tokyo, London & New York) on a chart is easier, then just reading about them. Best times to trade are both the Tokyo/London overlap (purple area) and London/New York overlap (purple area). Price action and risk management is key to profitable FX trading.
Remember Four Things When Making Any New Trades:
1) Pair Traded
2) Price Traded
3) Session Traded
4) Time Traded
All of the above four things equal liquidity and volume when you are trading, best of both is at Tokyo end to London end session.
The chart times are PST/USA times- please convert to your local times, if you would like too.

Do You Day Trade? (Part 2/2)You need to know that during the 3rd/4 hr candle or from 10:00 pm to 2:00 am (PST/USA)- please convert to your time zone, that most of the time the L.O.D. (low of day) or H.O.D. (high of day) is made, within that 4 hr candle. If you get that right, you can profit with right risk management.
There is a high correlation that 11:00 pm to 2:00 am PST/USA that the High or Low being established for the daily session, in the majority of the cases.
Attached chart example of GBPJPY 1 hour chart of Thursday, making a H.O.D. during this 3rd/4 hour candle of session, then price action dropping 80 pips.
This is why I use Daily, 4 hour and 1 hour mostly when scalping and day trading.
Do not fight big banks, if you are scalping or day trading- just jump on their train and go with it for success.

Do You Day Trade? (Part 1/2)You need to know that during the 3rd/4 hr candle or from 10:00 pm to 2:00 am (PST/USA)- please convert to your time zone, that most of the time the L.O.D. (low of day) or H.O.D. (high of day) is made, within that 4 hr candle. If you get that right, you can profit with right risk management.
There is a high correlation that 11:00 pm to 2:00 am PST/USA that the High or Low being established for the daily session, in the majority of the cases.
Attached chart example of GBPJPY 1 hour chart of Friday, making a L.O.D. during this 3rd/4 hour candle of session, then price action going 50 pips up. This is why I use Daily, 4 hour and 1 hour mostly when scalping and day trading.
Do not fight big banks, if you are scalping or day trading- just jump on their train and go with it for success.

Seting up Volume Indicators on Trading View ChartThis is basic video will show you how to set up volume indicator on a Trading View chart.

Forex Session Tendencies Tokyo Session:
Liquidity begins coming in from Wellington, New Zealand. The Tokyo session has a higher tendency for ranges to hold- support and resistance to be respected.
London Session:
Liquidity being furnished throughout Europe. The London session has a proclivity for fat, active moves.
New York Session:
Can exhibit behaviors from both London or Tokyo sessions. The Overlap is often considered "The most liquid period" of the day.
Other useful information:
The New York Forex session is one of the most liquid Forex trading sessions. When the US session overlaps with the London Forex market session it is considered to be the most liquid period of the day.The beginning of the New York session is normally more volatile than later in the day. There are different methods traders can use to trade differing levels of volatility.
WHAT TIME DOES THE NEW YORK FOREX SESSION OPEN?
The New York Forex session opens at 8:00 AM ET and closes at 5:00 PM ET. The ‘overlap’ occurs when the US Forex session overlaps with the London Forex market session. The London Forex market session opens at 3:00 AM ET and closes at 12:00 PM ET, so the overlap occurs between 8:00 AM ET and 12:00 PM ET.

Break Out Range (Entry Pattern 1/5)One of my favorite day time or scalping entry patterns is the breakout of range pattern on hourly time frame. The best times for any entry patterns occur is in between (end of Tokyo) 10 p.m. to 6 a.m (start of New York) PST/CA times- why? high liquidity and volume.
This pattern on attached hourly chart, happened end of Tokyo and start of London a prime time to entry a new trade. This set up could have been from a 1:4 or 2:4 set up of risk reward, depending on your plan and strategy and risk management.
BTC/USD ( May Sideways Ranging PA?)I think that Btc/Usd will be in a sideways range in the month of May, in between 55000.0 to 60000.0 ($5000.0) unless some world CraCra event happens.
On weekly and monthly Btc/Usd charts- most of the price action has been in between this range, with one spike to $65000.0 last month.
Btc/Usd sellers won last month with price action making a long legged red doji candle (undecided) on April chart and most of the strength, I believe still in sell side. Last couple of years price action has been going almost straight up or 90 degrees, this year (2021) will mostly be a consolation one or sideways so their is some kind of balance placed in Btc/Usd market.
Note: I do not trade Btc/Usd, but if you do---- good luck!!!

GbpAud London/NY session order blocks (examples)Example of both a bearish and bullish order block that would have helped you day trading the Gbp/Aud pair on 15 minute time frame. This is a very both a high liquidity and volume four hours of day (last four hours before London session closes).
Noted on attached chart is following:
1) 1:3 risk/reward set up on a bearish and bullish trade. If you would have utilized a 12.5 pip stop loss vs possible target of 36+ target. These trades would have lasted around a hour in real time to hit targets.
2) Note: Fib retracement indicator on chart, with a reversal in golden zone of 38% to 62% areas. They can/should be used for both trades for entry areas.
3) Price action on 2nd trade had support right above white line or S1 pivot line, which is another confirming indicator.

Sessions (Best Times To Day trade)Visual chart of different daily session: Sydney, Tokyo, London & New York is easier to understand then just read on website. When sessions overlap and when both highest liquidity and highest volume happens per day.
If you day trade & keep price action number one and trade during highest liquidity and volume hours area per day, which is the (12 hrs) in between the end of Tokyo session and end of London session, you will keep trading Forex as simple as possible. Use risk management and stop losses always when trading.
Please convert noted PST/USA chart times to your time zone.

Per Day 12 Hours Of High Liquidity & Volume Forex is open 24 hours a day, but first 8 hours of new session has slow and low liquidity and volume and last 4 hour of session has slow and low liquidity and volume. Why is first 8 hours mostly ranging and sideways price action, related to Sydney and Tokyo sessions are only ones open for trading and last 4 hours of session is because only session is open is New York, after London has closed for session. * You generally should not trade these times unless you are scalping trades for low pips.
Best times (you can convert to your time zone) is from 10 p.m. to 6 a.m. P.S.T/USA- or end of Tokyo session to end of London session. This is where most of the 6 trillion dollars of Forex buying and selling takes place and has highest liquidity and volume every day. Please put a simple volume on any Forex hourly or four hour chart and you will see when high volume is trading (London and NY session, especially overlap 4 hr period before London closes).
On noted 4 hour attached chart: You see possible day trading done on 4 hour charts during high liquidity and volume times of day, these trades mostly are reversal back into daily trends from liquidity within the last 8 hours of Tokyo session before London. You can set an sell limit or buy limit trade expecting next 4 hour (10 p.m. to 2 a.m.) candle to reverse back into major trend of week or day. Best day trading is during 12 hours of high liquidity and high volume period.
The Forex markets want to get retailers going wrong direction, let price action come to you on either 4 hour or daily time frames- then trade in that trend direction you will profit more and have less stress. Good Luck and Good Trading.
Always, use stop losses and risk management when trading Forex.

a Tip about reading VolumeHow to read volume in your stock:
General concept:
- You want to see volume increase on impulses and volume decrease on corrections
Volume analysis:
A:
Price is moving up, volume is increasing - as should be.
B:
Price is correcting, volume is decreasing - as should be.
C:
Price is moving up, volume is increasing - as should be, BUT the large volume is not pushing forward and the price is starting to correct - Red flag.
D:
Price is correcting, volume is decreasing - as should be.
E:
Price is keeping correcting further, volume is increasing on deep correction after breaking local low!!! (not as should be) + HUGE amount of volume greater than volume peaks 1 and 2 =====>>>> we are about to go into a large correction!
Large correction = deep or lengthy... but it doesn't tell you which one... maybe both, it is just telling you correction about to happen...
F:
Large correction is happening, volume is decreasing.
EXTRA ANALYSIS:
Remember that the market is fractal, so this pattern repeats itself on different structures.
- From point A to E you have an impulse on increasing volume. From point E to F you have a correction on decreasing volume (Bigger time frame).
- From point A to 1 to B there is an impulse and correction volume pattern, as stated above on the lower time frame:
A is an impulse with increasing volume
1 is like point E - volume on the RED day is greater than the Green day or any previous days on the rise.
B is a correction on decreasing volume
The whole concept of volume analysis is to help the trader be more in tune with the market cycle... So you will know when you are in a correction, and when you are in impulse.
Knowing this will help you HOLD ON, when you need to, or TAKE PROFIT when you have signs that correction is happening.
If you like it, follow and like this idea so it will save on your saved ideas for future reference.

Should You Use Sessions Indicator?If you are new to trading Forex, should you have sessions indicator on your charts? Yes, 100%. Why, most of the liquidity and volume happens at end of Tokyo session to end of London session. This involved Tokyo/London overlapping one hour and London/New York overlapping four hours.
You need to understand that price action during Tokyo session mostly ranges or goes sideways.
You need to understand that price action during London session will mostly do a fakey or false move in wrong direction, then start trending.
You need to understand that price action during New York session will mostly continue same direction of London session and/or reverse trend.
You need to understand that price action after London session closes, will decrease with both liquidity and volume dropping suddenly for rest of session.
Note: You need to know that 1st hour of any new sessions have the highest spreads and are not for trading, but for setting up future possible trades.
Finally, from 10 p.m. to 2 a.m. PST/USA- either high or low of day will be made, 80% of time- then you can trade in trend direction of day.
Sessions Indicator will keep you trading the right pair, at the right price, at the right time of day and during the right sessions. Why, trade AUDJPY during New York Session when both Sydney and Tokyo sessions are closed? Commonsense and keeping trading simple will help your bottom line, in Forex. The sessions indicator will work with any time-frame under 4 hours and keep a visual reminder of what session is open and closed - F.Y.I.

Use of Volume At PriceThis video shows how you can use Volume At Price data using two indicators for Visible Range and Fixed Range.

Pair? Price? Time? & Session?- Before Entering A New Trade.Before Taking Any New Trades, Ask Yourself These Questions:
What pair? Is base currency in current session.
What price? Is current price action around round numbers? double zeros or higher are psychological numbers of banks and retailers.
*On chart I use .500, .750, .000 & .250 ending numbers which on GBP pairs are quarter levels (or 12.5 pips) zones. Total ADR on this chart is 75 pips.
What is current time? Beginning of a session (higher volume & liquidity) during London and New York sessions.
What session is set up pattern to enter a new trade? Sydney, Tokyo, London or New York session.
Higher volume? Beginning of sessions are a great time to initiate new trades, in direction of momentum and trend. Highest volume and liquidity is between London open to London close time, which is around 12 hours per day. *London overlaps Tokyo and London overlaps New York session.
High liquidity? Overlapping sessions (best) and where two major sessions are working, so double liquidity and volume at play.
Refer to noted possible five trades that could have been taken on noted 1 hour chart of GBPAUD during Fridays session. A lot of possible profit pips with the right stop losses and risk management- please trade according to your plan and strategy. For entries I use fractals, trends, momentum, volume, liquidity, fib ret reversal levels of (50% to 61.8%-golden zone), engulfing, harami and pin bar candlestick setups to enter with right pair, right price, right time and during right session. Good Luck.

MID-DAY Video {Chef Bubbles} How to use it Please refer to the linked video from before to match it with the indicators and formulate the thought process of the Bubbles strategy!
thank you for watching!!

April 1, 2021 - Opening Range-Initial Balance Trading the NQIn this video I will show you how I took a very common setup with the OR/IB indicators. The setup is to fade the first touch of the IB range, after the range has been set. As you can see, price rejected at the IB high and came down to tag the Overnight High (the magenta line).
This trade netted about 50 points on the NQ.

How I used my Opening Range / Initial Balance indicatorIn this video I will demonstrate how to use my Opening Range / Initial Balance indicator to take profits on March 31, 2021.
Please watch and LIKE if you find it useful.
Thanks!

Volume and Open interest of some CME contractsLooking at the numbers helps us figure out what goals to other market participants have? Do they rollover their positions alot? How far do they project themselves?
Do they hold for months of exit after just a few days?
We can see the volume of Oil popping off when the expiry is close as traders, for example terrible ETFS, close and re-open the next month and I am suspecting much of this volume are front running algos taking advantage of these rollovers.
The S&P is looking more like a casino of short term gamblers than ever.
And the EURUSD sees much holding relative to trading, there are no day traders in FX which echoes with the BIS report showing trader's timeframe (almost all retail investors day gamble or "swing" gamble < 7 days but they represent only 5% of the FX market maybe even less).
Other notable futures: Gold with a volume of 185 thousand contracts this Monday, and open interest of 472 thousand split almost evenly between the "front" month (in practice the April contract) and June one.
10 year T Notes have an open interest of 3,780,235 contracts (378 billion usd) I think this is the second highest one.
10 year T Notes options also have an open interest of over 3.5 million.
The total volume is close to 2 million for futures & 500k for options. So about 250 billion USD.
I think the third biggest contract in usd terms is the e-mini S&P 500, with a daily volume typically around 3-3.5 million (> 500 billion usd). The contact volume is about the same it has been for years but the usd value has almost doubled from when the S&P was lurking in the depth at close to 2000 points.
Open interest for the S&P is at 3 million for futures + 500k for options, it's sitting at around the same value as the ADV.
This is the era of day traders...
The largest contract is not even close. Seriously these numbers make my head turn.
It's the Eurodollar (the future that represents the London interbank rate).
The daily volume hoovers around 2 - 2.5 million contracts (I'm guessing around 700 billion usd).
The open interest is eye popping at 25-35 million contracts (Friday it was at 11.8 million futures & 20.9 million options), it's half the GDP of China.
