Google at record highs but Wave 3 cluster/RSI screams pullback!Alphabet is leading the Magnificent Seven, hitting record highs near $330, while most AI and growth stocks, including Nvidia, have stalled. Since launching Gemini 3 in mid-November and with news of a $4.9 billion Berkshire stake, Alphabet has rallied more than 135% off its April low, outperforming all Big Tech peers in 2025.
But Alphabet is at the 161.8% Fibonacci extension of its long-term move and long-to-medium-term move, which matches a textbook Elliott Wave 3 cluster completion. RSI is at an extreme 83 on the weekly, hinting a Wave 4 pullback to $288 could be next, even as the macro backdrop (Gemini 3 AI buzz, Fed rate cut hopes, and demand for Google’s AI chips from Meta) stays strong. Ultimately, a final Wave 5 could extend up to $380-$400.
Key drivers:
Gemini 3 launch positions Alphabet as an AI leader, topping major multimodal benchmarks.
$4.9B Berkshire stake signals major institutional confidence.
Meta seeks Google’s TPU chips, boosting Alphabet’s AI hardware story while pressuring Nvidia.
Fed rate cut odds above 80% further support growth stocks.
Elliott Wave/technical structure aligns with a potential $288 pullback before any push to $380.
Will Alphabet finally pause after eight explosive months, or does the rally have further to run?
Let us know your view and Elliott Wave count in the comments, and follow for more big-picture, technical-plus-macro trade ideas!
This content is not directed to residents of the EU or UK. Any opinions, news, research, analyses, prices or other information contained on this website is provided as general market commentary and does not constitute investment advice. ThinkMarkets will not accept liability for any loss or damage including, without limitation, to any loss of profit which may arise directly or indirectly from use of or reliance on such information.
Wave3extension

Gold breaks records and tops out: Where next?Gold achieved a historic breakthrough to $3,759 per ounce, potentially driven by an unusual "barbell strategy" where investors simultaneously bought risk assets while hedging against systemic risks.
On the one hand, continued expectations for two additional rate cuts by year-end supported non-yielding assets. On the other hand, political uncertainty increases as Trump prepares to meet with lawmakers on funding proposals. The probability of a Gov shutdown approaches 70% by October 1st, which would force the FOMC into a 'blind' meeting in October.
Technicals
The short-term setup shows a double top formation at $3,759, suggesting potential consolidation rather than immediate continuation.
Resistance Levels : $3,800 is a critical resistance, both a Fibonacci extension cluster and a psychological level
Support Levels :
Immediate support at $3,740 (breakout confirmation level)
Secondary support at $3,700-$3,730 (previous consolidation zone)
Deeper pullback potential to $3,673 (61.8% Fibonacci retracement)
Wave Structure : Elliott waves suggest completion of a potential Wave 3, with consolidation expected before a possible fifth wave extension toward $3,785-$3,800
Forward Outlook
The setup favours consolidation over the remainder of the week, with key events including Fed Chair Powell's speech and Friday's PCE inflation data serving as potential catalysts for the next directional move.
The momentum divergences suggest limited downside risk from current levels, making any pullback toward $3,700-$3,740 a potential buying opportunity for the anticipated final leg higher toward the $3,800 resistance zone.
Risk management remains crucial given the proximity to potential reversal levels and the unusual nature of gold's correlation with equity strength.
This content is not directed to residents of the EU or UK. Any opinions, news, research, analyses, prices or other information contained on this website is provided as general market commentary and does not constitute investment advice. ThinkMarkets will not accept liability for any loss or damage including, without limitation, to any loss of profit which may arise directly or indirectly from use of or reliance on such information.

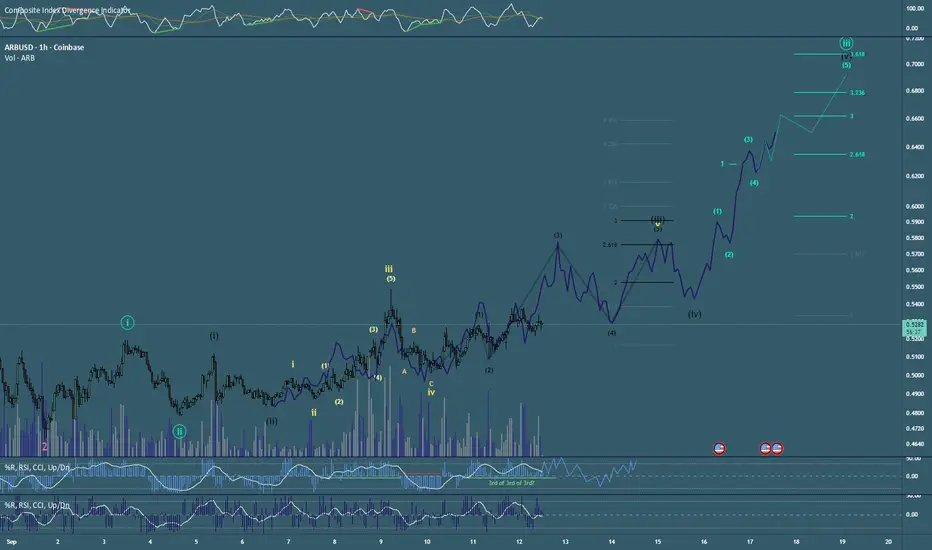
Arbitrum wave 3 Extension could play out like this past fractal.COINBASE:ARBUSD looks ready to charge ahead with this wave 3 extension. I have plotted a bar pattern of a fractal that played out similar to this structure. Yellow wave 5 must show a significant extension in one of its waves (3 or 5) in order to reach beyond the price extreme of its wave 3 (wave 1 already finished). Several alts seem to be following a similar fractal from their historical price action. This is a continuation of a past idea, just with more information. In reality this extension i have plotted is the 3rd of the 3rd wave for the macro impulse in red. oof my head hurts xD. Happy Trading
Multiple Nested Wave 3s on Arbitrum! Super Bullish!!🧙♂️I have an Elliott Wave count to share with you showing a super bullish Triple 1,2 in the 3rd wave of the Red impulse playing out. Meanwhile, we are currently in the third wave of the 5th wave of the Blue impulse, which contains in itself more nested waves in the form of a triple 1,2. Chart is shown on the 15 min TF, but I included a pic for viewing the LTF subwaves on the 3 min TF. Not financial advice as I am still a student of the wave principle. Happy trading! 🌊🏄♂️

Titan has formed a trendline breakoutTitan NSE:TITAN has formed a trendline breakout. Wave 3 is getting formed and you can buy above 3625 and Target would be 3960. This is a Very short target as Wave has already gine 1.618% and so we shoud expect only 1.00%

Look Out Below Market Trends Up This WeekWorking on very preliminary theories of where we could be based on the movement so far. Check out my last analysis from a month ago to see why I thought we were due a major market correction.
Theory has us in:
Supercycle 2, Cycle wave 1, Primary wave 1, Intermediate wave 2.
Assuming we are in the very early stages of a large macro level wave 1 down (Cycle 1), we are likely inside the first wave (Primary 1) of that movement. We may have just completed Intermediate wave 1 down, however, the pace was so fast it may still be early in Intermediate wave 1.
The wave 3 reversal indicators signaled much more than normal which means they all called the end of the impulse waves correctly, or the first group in the currently marked Minor wave 1 was inaccurate. As it is laid out now, Minor wave 2 retraced around 50% of wave 1's drop. Wave 3 extended nearly 161% of wave 1's movement. Wave 4 retraced nearly all of wave 2's movement and wave 5 extended nearly 261% of wave 3's movement. These are all close to Fibonacci movements commonly used for identifying reversals. Although Minor wave 3 as marked is short at just 12 bars long, wave 5 was 11 bars long (as marked) maintaining a wave principle on 3's length. There is enough here to consider Intermediate wave 1's movement complete. Confirmation of this theory should occur if Intermediate wave 2 sees general upward movement over the next week. Intermediate wave 1 currently measures 82 bars. 38.2% of this length is 31.324 bars, so I have rounded up to 32 bars for a premature potential length of Intermediate wave 2.
As far as real world catalysts, the primary earth mover is likely in the Middle East. The world is bracing for a coordinated Iranian strike against Israel. A few articles today mentioned the Tisha B'Av which takes place on August 12-13 as a potential retaliation date. This would begin around bar 33 for Intermediate wave 2.
IF we truly are in the early stages of a wave 2, a third wave with a simple common wave extension of 161.8% would place a low at 4731.93. The next normal wave 3 retracement at 261.8% would put a low at 4150. IF we are truly in a longer term major bearish cycle, 4150-4731 is a normal move here. A catalyst to get the market there could be significant unrest in the Middle East capable of not only disrupting energy supply, but shipping, manufacturing, and elevated geopolitical tensions.


Ripple (XRP) Analysis: Understanding the Potential MovesRipple (XRP) has acquired significant attention from traders and investors recently, and it currently sits at a crucial point in its price action. I will analyze Ripple's recent performance and potential future scenarios from an Elliott Wave perspective. Additionally, I will discuss some of the factors that may influence Ripple's price, as well as its relationship with Bitcoin Dominance.
Recent Price Action and Elliott Wave Analysis
Ripple has experienced a strong move up to the resistance level of 56 cents, reminiscent of the spike in September 2022. This time, however, Ripple has managed to push slightly higher, reaching a current high of 58 cents. From an Elliott Wave perspective, it appears that we have completed a wave 3 at this high.
Extended Wave 3 and Potential Short-term Targets
There is a degree of likelihood that Ripple will surpass its current high of 58 cents in the near future if the market decides that breaking the 56-cent resistance (the September 2022 high) is worth pursuing further. This would indicate that we are in an extended wave 3 move, with short-term targets at 70 cents.
Wave 4 Cool Down and Retracement
If Ripple reaches the 70-cent mark, we can expect a cool-down period of at least a few weeks as the market enters wave 4. During this period, Ripple is likely to retrace back to around 60 cents before resuming its upward trajectory.
Bitcoin Dominance and Optimistic Scenario
The associated chart displayed in this analysis presents the most optimistic scenario for Ripple's price, assuming that Bitcoin Dominance behaves as expected when it reaches 50%. In this case, Ripple could experience significant growth throughout 2023.
Upper Limit for XRP in 2023
However, it's essential to exercise caution when holding XRP at higher price levels. If Ripple reaches 85 cents or higher, it may be wise to reevaluate your positions, as the top for 2023 could potentially be between 85 and 88 cents. Keep in mind that this is the most optimistic scenario, and it's crucial not to become overly attached to a specific price target.

JASMY DOUBLE HARMONIC ,WYCKOFF ACCUMULATION. WAVE 3 BEGINS!Jasmy looks like is completing a double harmonic pattern. A harmonic within a harmonic. We may be in the mist of a VERY large move on Jasmy. We shall see!

SAM: Boston Beer CompanyLooking to follow his family’s passion for brewing, Jim brewed the recipe in his kitchen with the hopes of challenging the status quo in the American beer industry. He started by introducing American drinkers to craft-brewed beers that were full-flavored, balanced, and complex, and brewed with quality ingredients. Pleased with his brew, Jim started The Boston Beer Company with his co-founder and first employee, Rhonda Kallman. In those first months, Jim walked bar-to-bar with a briefcase full of beer that he called Samuel Adams Boston Lager, in recognition of one of our nation's great founding fathers, a revolutionary man of independent mind and spirit. Boston Lager soon became a catalyst of the American craft beer revolution, making its public debut in Boston on Patriot's Day in April 1985. Six weeks after its introduction, Boston Lager was selected as "The Best Beer in America" in The Great American Beer Festival's Consumer Preference Poll, which became an award Samuel Adams Boston Lager went on to win an unprecedented four times.
If you're unfamiliar as to what beverages are made by SAM, think Samuel Adams (of course), Angry Orchard, Twisted Tea, Truly (seltzer) among others. While you may not be hip to 'Boston Brewing Company', if you enjoy alcoholic beverages, chances are you've indulged in at least one of their products.
More fascinating to me than the number of household brands this company supports is the wave structure of its all-time price action. If one didn't believe in the power of an extended 3rd wave before now, feast your eyes on its magically vertical increase in price, practically since inception! For what its worth, I have no stock or positions with SAM however, as an Elliott Wave fanatic, I'm excited to show the power of such a move.
To get ahead of the wave and find potential moves like these (or avoid the downfall that comes after a completed wave cycle), join us on the waves.

BTC WAVE 3 !!! INCOMING !!!This count is based on my assumptions so anything can happen not a trading or financial advice kindly do your own ta thanks trade with care good luck.

POLKADOT - ROAD TO $200Good morning traders.
DOT/USDT the pair for today, lets begin.
In light of the recent Bitcoin dump, a lot of alts have found themselves at strong support, some below it and stables depegging from the dollar.
Question is, are we at the bottom now?
While i may not be able to clarify if we are at the bottom or not, it doesn't feel like it, I can however say this is a very good buying opportunity for many alts.
From the chart above we have the DOT price back at July 2021 levels, very strong support area. It could however make it's way down to our worst case scenario region which is also in line with the 1.236 fib support level dependng on Bitcoin's price action.
So far we have a Regular flat formed on the chart which in theory has it's C wave to be 61.8%-123.6% of wave AB.
Whether or not this is the bottom it is still a very good buying opportunity (but don't take my word for it).
If the Elliott wave theory is correct (and has been so far), targets for our wave 3 range from $175-$240 dollars(red zone) depending on where the bottom will be.
In the blue zone we have our Take profit region just to ensure we take some of the table in the case of exhaustion.
I expect this to fulfil over a lengthy timeframe given the state of the market but, you never know.
If you agree with this Idea pls like, share and comment your thoughts below.
As always feedback is appreciated!

MANA - Wave 3 underway?Elliot Wave Theory playing out well so far.
Looks like we have confirmed the Wave 3 breakout.
Typical Wave 3 target (1.272 fib ext) takes us back to ATHs.

Fibonacci projection possibilities for wave 3Graphical representation for possible wave 3 projections under ideal conditions.
100% of wave 1 is the minimum projection limit for wave 3 with no limitation for its further projection

EURUSD - Elliott wave – subminuette wave iii of (iii) unfoldingSubminuette wave iii extension of (iii) unfolding.
FIB ext: 1.2271 - 1.2312
ALT: diagonal minuette wave (v) of minute vawe ((c))
critical price area
previus daily close 1.2213
PP 1.2205
FIB: 1.2271 - 1.2312
static S/R 1.2243 – 1.2284 – 1.2205
volatility D 1.2208 - 1.2312

UKOIL - Possible Wave CountCurrently in the move of Wave 3 , creating an extension of wave 3 .
Possible target of 2.618 times @ 114 levels .
With a possible retracement to 0.5/1.618 levels @ 85 - 90 Levels
For a final target of 150 levels for wave 5
I am not entirely sure on this count . If anyone has any suggestions it would be greatly appreciated

Facebook Bullish IdeaThe analysis is as follows
It appears that we are in wave 5 of a greater trend move.
This is confirmed by the fact that we have just broken out of a triangle, and according to Elliott wave principles, the triangle always and only precedes the last move of the greater trend.
In addition to being the wave 5 of the greater trend, within the wave 5 we are in wave 3, of 3, of the wave 5. As a result, I expect to see facebook go up much higher in the near future.
I believe we are in the wave 3 of 3, since the recent move from march 25th to april 8th was a clear impulsive move. In addition to this, the wave before that was also a clear impulse. The reason I am not labeling this as 1-2-3, is because the wave 3 would be incredibly short in time and price. I highly doubt this is the case, since if it were, the wave 5 would have to be ending very soon, and for the wave 5 to end with such little price moves and so quickly, it just isn't realistic.
Since both of these moves are contained within parallel lines, I am looking for a big move up, to breakout, and confirm that we are in the wave 3 of 3.
I would be concerned about my wavecount, if the price continued to fall below 298.
Target for the wave 3 of 3 is the 1.65 which is around 345-350.
The next target is the 2.00 which happens to be the 1.65 projection off of the greater wave 1.
I am anticipating that his move will be made very swiftly since it is a wave 3 of 3.
