BankNifty Multi Time frame AnalysisWave 0 = 40295
Wave 1 = 39051
Wave 2 = 39719
Wave 3 = 36682
Wave 4 = 37845
Wave 5 Possibility = 36075
Reasoning,
Wave 4 has retraced to 0.382 levels on the Fib
I personally feel Wave 4 would be flatter than Wave 2 due to the law to alternation
For a short term entry ,
37406 is a strong support being another Fib drawn from from 19th April 2021 low to ATH meet
furthermore,
Its safer to initiate an entry after it has broken 37298 as there has been a cluster of candles prior creating a strong resistance/support
Immediate targets would be T1 = 37138
T2 = 36696
The range between T1 and T2 is a strong pivotal range which can be seen on the daily chart and 22nd Nov low and 23rd Nov low meet there
On the long term trend Wave 5 is to end at 36075 ,
At this point The fib retracement drawn from 19th April 2021 and 0.618 Fib Extension meet , furthermore the next pivotal range also starts there
These congruence of numbers make a support or resistance more strong
Wave5

Super DOT positionVery good position DOT
This painting is really beautiful, everything is ready for the upward trend, enjoy

Are you ready for 3 small and 5 big waves?According to my wave count, we are in Elliott 3 small and 5 big wave, according to #xrp fundamental news, it is possible, enjoy

This is why XAUUSD (Gold) is heading towards new ATH's - 2300+Hey trader,
See above my current idea on XAUUSD (Gold). This idea relates to the longterm scenario based on Elliot Waves knowledge.
See below for further informations.
This is no financial advice.
RL from RT_Trading

Bitcoin | Where Is The Bull Market Top Anticipated?Hello, everyone!
Last time when I made the BTC analysis, I spotted that now the price is in the local Wave 3 of the Global Wave 5, last wave of the current bull market.
Today I am going to assume where the market top can be for the current Bitcoin market.
The market clearly formed the 5-wave Elliott structure. According to Trading Chaos methodology, we should calculate the price distance between the Wave 1 start and Wave 3 end, measure this value from Wave 4 bottom – this is the higher of the Wave 5 target zone. The lower band is 62% of this distance. Thus the target zone for this bull market top is the range between $68000 and $90000.
You can be scared that the lower band have been already reached, but as I revealed in the previous analysis the local waves structure have not ended yet. I am waiting the BTC price much higher than the current ATH.
Moreover, we should see the fractal at the Wave 5 peak and the decreasing momentum on Profitunity MACD. I will tell you when the bull market top will be in my opinion. Now I am still holding altcoins and waiting the altseason.
DISCLAMER: Information is provided only for educational purposes. Do your own study before taking any actions or decisions at the real market.

eurusd paths this week i look buy position on eurusd with that paths on chart
i think at the end of last week eurusd was on the wave 4 so wave 5 is the next move and i think wave 4 is end too soon
so im on buy eurusd
wish u a profitable week

BTC ready for last wave up? Wait for the dip to enterSo BTC has been performing very well and remained strong last week despite stock market downside. Currently BTC invalidated dead cat bounce theory and the higher probability is now running to ATHs. So far the price range is a bit extended, it would be ideal scenario to wait for the dip into 50-45k with invalidation close below 45k for better risk reward scenario. In trending markets usually its hard to get a perfect dip or position so the buy area is a bit wider than usual because of expected frontrun. At this moment funding rates are rising, meaning people coming back to aping into leverage trading therefore we could see some leverage flushes again so be careful using leverage.

$ADA $ADAUSD looks like it can double from ~$2.2All sorts of cool DeFi stuff just on the verge to rolling out for ADA such as SundaeSwap etc. now that Alonzo full smart contracts has rolled out.
In reality ADA has the potential to much more than double.

SXP shortThe chart is completing wave D:4.
After completing the triangle correction it will descend to the next support which is 2.229.

BTC WILL REACH 59600As the present wave is either '4/B' or 5th wave begining, the confirmation will be known when BTC broke the ''X'' wave resistance @ 59600,before this month end(29th sep21), until then Enjoy BULLS!!


BTC Final Intermediate Fifth Wave In PlayA shallow pull back to the 0.38 level. Wave 2 of the final intermediate fifth? An impulsive recovery will further validate the count.
Disclaimer
This is not trading advice. All content/ information shared in this idea is purely educational in nature and is expected to be used for informational purposes only and should not in any way come across as a recommendation to buy or sell in these assets.
You should do your own research and analysis before making any investment decisions. Do not trade or speculate based on the information provided in this idea.
Trust your own analysis.
BeyondEdge

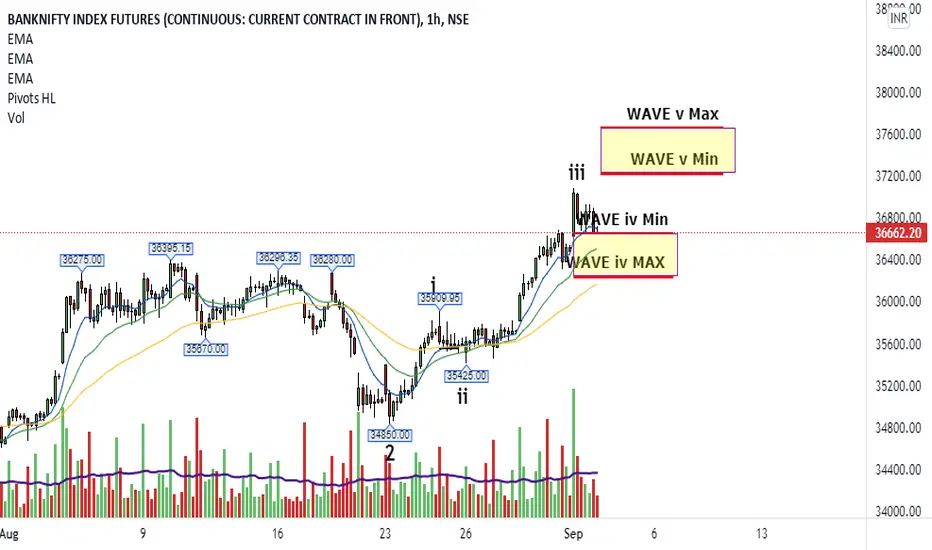
Bank Nifty - 1 Hour Wave CountAs seen on chart Wave 2 is taken from 34850 showing the beginning of Wave 3
Assuming Wave 3 is being extended its final 1.618 target is 38603
Sub Wave iii is currently over @ 37085
As shown Wave iv could be over @ a 0.236 retrace where Wave v would finish at 0.618 @ 37650
If Wave iv continues its max retrace is at 0.5 levels @ 36240 levels making wave v min target at 0.618x @ 37230
AMD bullish falling wedgeamd looks bullish here ready to start wave 5, nvda also looks bullish and ready to rip

BTCUSD - Elliott wave – update - minute wave ((C)) close to end
minute wave ((C)) close to end
subminuette wave v of minute wave ((c)) unfolding
microwave 4 is running - invalidation fib 0.382 - 46440 area

BTCUSD - Elliott wave – update - monitoring wave5 down
wave 4 over - motive wave down in 5 waves should follow to wave 5
motive wave ((1)) ended at 28800 area
corrective wave ((2)) unfolding in a zigzag - target 36630/38730 area
ALT: wave 4 is not over
monitoring price evolution
critical price area
previus daily close 33509
PP 32570 up

USOIL - Elliott wave – update – minor wave 5 ended
minor wave 5 ended
minute motive wave ((a)) of ((a))((b))((c)) corrective movement should follow to minor wave 4 – zigzag/flat
ALT: minute wave ((4)) of ending diagonal minor wave C is unfolding

TQQQ Wave 5 Up (3 Cycles) - Not US10Y CorrelatedOn the long timeline TQQQ is in a wave 5 up, and could have another 2 months upward.
We're roughly 49 days into a 120 day period.
Wave lengths aren't constant but do seem to run 3-4 months up, then 2-3 months correcting, before ultimately heading upward again.
With a 50.8% Average Return Rate over the past 10 years even with the pandemic mess. I'm long TQQQ.
I was long for 5+ years prior to the Sept 4, 2020 drop, went to cash, and now regret it.
Pundits on the news keep trying to blame pullbacks in tech on interest rates.
Comparing them shows it to be untrue. There are times TQQQ goes up or down in synch with US10Y and times they don't.
* NOT FINANCIAL ADVICE * NOT A FINANCIAL ADVISOR *

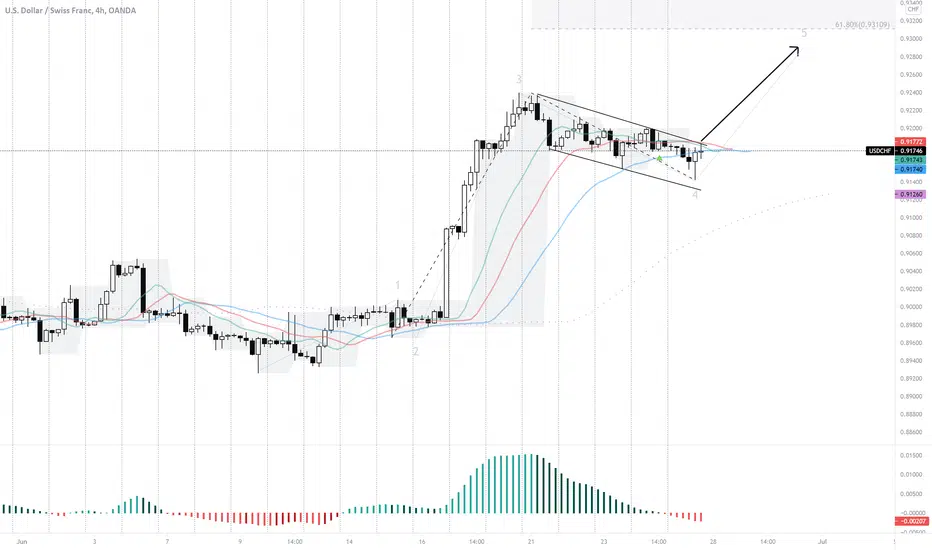
Chance of a Wave 5 on Swissy? - Breakout Long? I have marked the chart with potential Elliott wave on the 4 hour chart.
We see a strong wave 3 up followed by what can be seen as a bullish flag on the D1 chart and some sort of a bear wedge on the 4 hour chart
From what I Call THE SETUP ONE concept it is a wave 4 within tight boxes. I see a 4 hour bullish candle. I am long above this
Long Entry: 0.9175
Stop Loss: 0.9135
Target 1: (Peak of Wave 3) @ 0.9233
Target 2 : This is the Target Zone 1 are 0.9295
Good luck!
Are You Buying Here or Selling More? 2 Scenarios on BitcoinFurther to my ongoing analysis and trading signals on the BTCUSD #BitCoin saga, It would appear that we are currently in situation which can be interpreted in two ways
We are either at the low of the trading range. We see a bullish reversal candle with a good tail sticking out of the trading range lows. Suggesting the bulls are probably taking over.
I can guess that the pumpers will be showing millions of worth of purchases on their tick tocks and youtube shorts etc etc.
On the other hand, we have a decent pullback (reverse) (in other words pullup) setting up. The Target for wave 5 down is still in tact.
The question is do you want to sell more shorts or join the "stay positive" buy the dip crowd? Which one are you?
I'm long and short!

LOTUS WAVE 4 PULL BACK TRADING SETUPHi Traders,
Clear motive wave pattern spotted on LOTUS daily chart.
We are looking for opportunity to trade with wave 5.
Waiting for clear buying setup for entry point.
Happy trading.

BTCUSD - elliott wave - possible head and shoulder wave 2 of (5)
possible head and shoulder in wave 2 of impulsive downtrend wave (5)
wave 3 unfoding - target 32974
ALT: wave (5) is over, a correction in three wavs should follow
PP 39970 dw

