AVAX: Wave Count Adjusted for AVAX After 20% Drop Avalanche (AVAX) has pulled back about 20% from its recent peak since our last update, prompting us to adjust our wave count. At present, we see the coin in green wave , which is subdivided into a beige (a)-(b)-(c) three-part move, with wave (c) currently in progress. Once it bottoms out, wave should also be complete. From there, we expect wave to push AVAX above the newly established resistance at $36.19.
Waveanalyses

Coca-Cola: Support BreachedAfter nearly two weeks of indecision, Coca-Cola shares have now slipped below the $66.05 support level. In the near term, we expect further declines as part of the final wave (c) of the blue three-wave pattern, which should complete the broader corrective wave X in turquoise, just above the $60.62 support. After this, we anticipate a trend reversal, with the stock advancing in the final upward leg of the large beige wave III, targeting the beige short zone between $76.58 and $81.51. The peak of this third wave is likely to be established within this range before a significant correction sets in. Alternatively, it’s possible that beige wave alt.III has already concluded (probability: 39%). This scenario would be confirmed by a break below the $60.62 level.

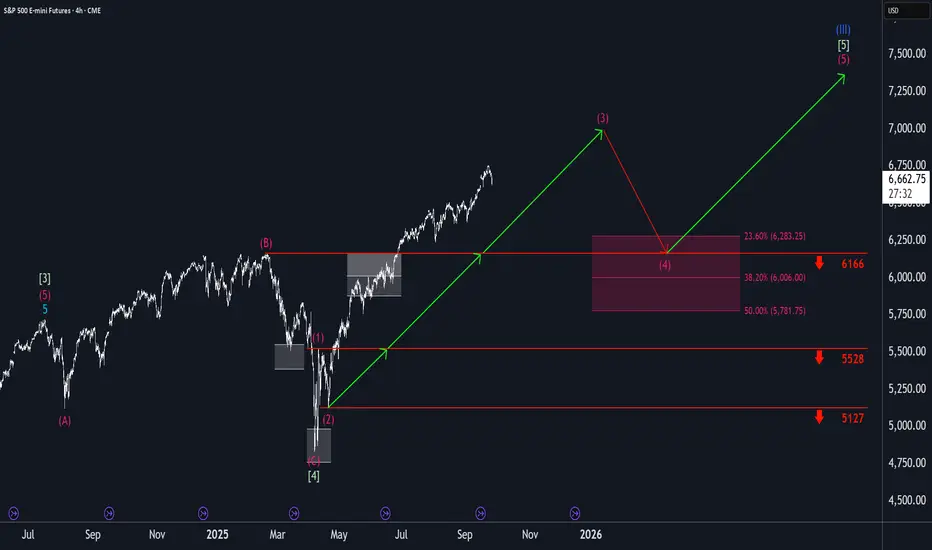
S&P500: More Upside Likely Before PullbackThe North American Mass Index kicked off the new week with some momentum, extending its climb within the ongoing magenta wave (3). For now, we anticipate this upward trend could continue before reaching a new high. Afterward, we expect a pullback as part of the subsequent wave (4), likely bringing the index into the magenta long Target Zone between 6,283 and 5,781 points. In our view, this price range offers attractive opportunities for long positions, as wave (5) is expected to follow—potentially pushing the index significantly higher and completing the larger blue wave (III). To protect newly established long positions, a stop can be set 1% below the lower boundary of the Target Zone.

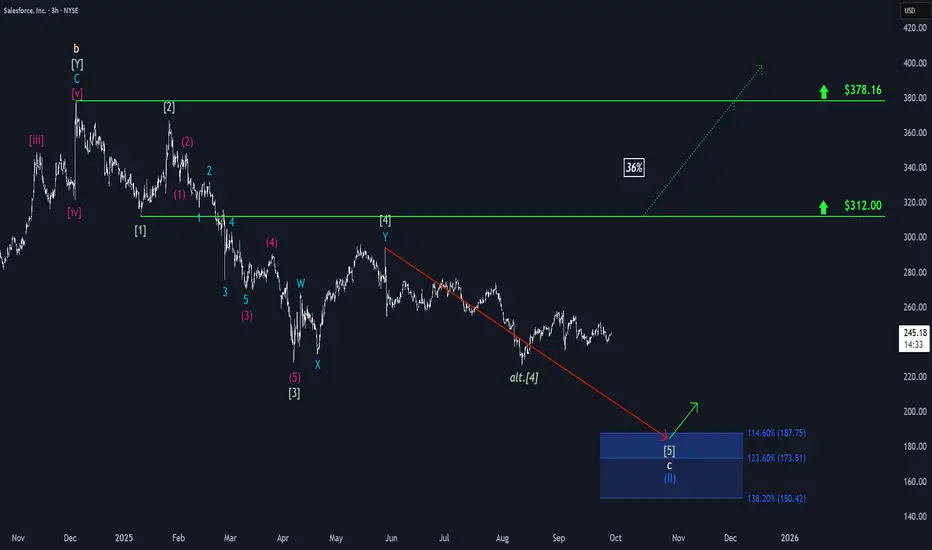
Salesforce: Trading SidewaysSalesforce has struggled to gain clear momentum in either direction over the past two weeks, which has resulted in mostly sideways trading. Looking ahead, we continue to anticipate renewed downward pressure in the near term, which could push the stock into our blue Target Zone between $187.75 and $150.42, thereby completing the broader correction of blue wave (II). After this move, we expect a new upward trend to emerge, which makes the blue zone an attractive entry point for long positions. For risk management, a stop can be placed 1% below the lower boundary of the zone. However, there remains a 36% chance that CRM will not reach our Target Zone and instead will break out directly above resistance at $312, potentially surpassing the higher $378.16 level as well. In that scenario, we would place the stock in a broader (green) upward impulse.
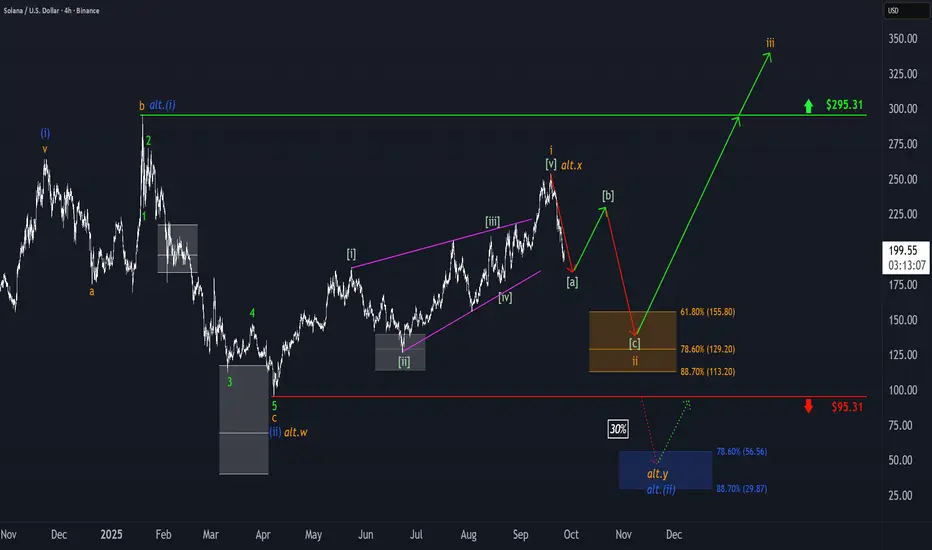
Solana: Target Zone in FocusSOL has dropped more than 20% from last Thursday’s high. In light of this, we now believe that last week’s high—reached on Thursday—marked the top of wave i in orange, and that price is currently undergoing a wave ii corrective phase. This correction should play out as a downward, three-part move labeled - - in green, ultimately targeting our orange zone between $155.80 and $113.20. We expect the low of this wave ii to occur within that Target Zone, which should set the stage for a bullish reversal. The following wave iii in orange is projected to push SOL to new all-time highs, breaking through resistance at $295.31.
S&P 500: Rally Stalls, but Further Upside LikelyMidweek, the S&P 500 struggled to find the momentum needed to extend its climb within the magenta wave (3). However, our primary outlook still calls for this wave to reach a somewhat higher high. Afterward, wave (4) of the same color is expected to take over, guiding the index into the magenta Target Zone between 6,283 and 5,781 points. In wave (5), another upward phase is anticipated, which should ultimately complete the broader uptrend of the blue wave (III) at an even higher price level.
Netflix: Trading Sideways as Correction Nears Target ZoneNetflix initially dipped slightly before settling into a sideways trading pattern. There remains a 33% probability that a new high for turquoise wave alt.3 could develop above resistance at $1,341. However, our primary outlook suggests that turquoise wave 4 will carve out its low in the turquoise Target Zone between $961.52 and $843.96, at which point it should hand off to wave 5—which should drive gains above the $1,341 level.

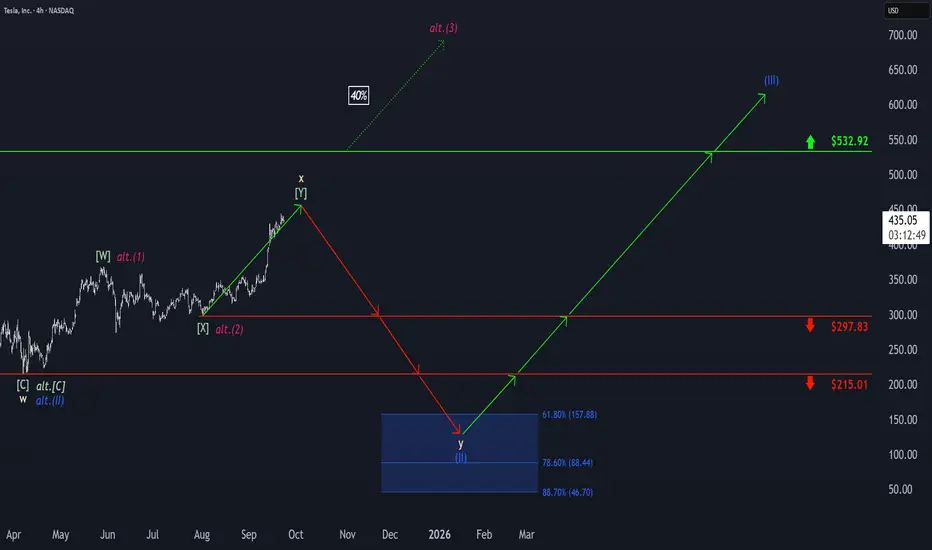
Tesla: Upward Momentum PersistsTesla’s upward momentum has persisted, with the beige wave x still having some room to run. However, we expect the corrective top to form well below resistance at $532.92, which should then trigger the final selling phase within the broader correction. Ultimately, wave y is projected to approach our blue Target Zone between $157.88 and $46.70, completing the large blue wave (II) in that range. Afterward, we anticipate a new wave (III) uptrend. That said, there remains a 40% probability that price may not reach the blue zone, as wave alt.(II) could have already completed at $215.01. In this scenario, TSLA would already be developing a magenta upward impulse and could break above the $532.92 level directly and sustainably.
Disney: Wave [iv] Still UnfoldingAfter an extended period of sideways trading, Walt Disney has come under renewed pressure, indicating that the low for magenta wave has likely not yet been reached. To better contextualize the recent price action, we have incorporated a blue WXY three-part corrective pattern within this wave, which should continue down to the support level at $108.78. Afterward, the magenta impulse wave is expected to complete turquoise wave 1 above resistance at $124.90. We then anticipate a wave 2 correction, which should bottom out within our long Target Zone between $97.18 and $85.12. On the other hand, our alternative scenario suggests that turquoise wave alt.1 may already be finished. A break below the $108.78 level would confirm this outlook and immediately shift focus to the Target Zone (probability: 40%).

TOTAL2 – Altcoin Market Cap (Weekly TF) 2025
**Summary:**
The TOTAL2 chart (crypto market cap excluding BTC) is showing a structurally bullish formation after a deep retracement and a higher low confirmation. This setup suggests a potential multi-phase rally toward 2.98T and beyond, with defined support zones and Fibonacci targets aligned with liquidity cycles. This analysis visualizes the expected roadmap based on trend-based Fibonacci extensions, retracement levels, and psychological market phases. Notably, the outlook includes the possibility of an initial correction to retest strong support zones before the market begins its ascent.
**Chart Context:**
TOTAL2 represents the aggregated market capitalization of all crypto assets excluding Bitcoin. Historically, it reflects capital rotation into altcoins, especially following BTC dominance peaks. The current chart shows strong reaccumulation above the 1T support zone, with Fibonacci confluences hinting at a sustained recovery pattern. Dotted arrows illustrate a wave-like projection of accumulation, rally, retracement, and expansion. The possibility of a near-term correction to lower support zones is also embedded in the path structure.
**Key Technical Observations: and Levels**
TP1 = 1.78T
TP2 = 2.05T
TP3 = 2.4T
TP4 = 2.85T
* **Secondary Fib Retracement :** 0% = 1.23T, 100% = 425.89B
* Key zones: 23.6% = 1.04T, 38.2% = \~840.42B, 61.8% = \~569.41B
Possible Support Levels: 1.04T, 930B, 840B, 766B, 735B,
* **Trend-Based Fib (A-B-C):** A = \~420B, B = \~1.23T, C = \~735B
* This projection aligns with TP1 at 1.78T
* **Support Area:** Around 1T psychological zone (930B)
* **Strong Support Zone:** 735 Bto775B
* **First Target Zone:** Between 1.73T and 1.89T (early resistance + Fib cluster)
**Indicators:**
* Weekly structure forming higher lows
* Long-term Fib retracements respected
* Trend-Based Extension projecting 1.618 move
* No divergence, confirming strength
**Fundamental Context:**
* Liquidity conditions are improving globally with rate cuts expected into late 2025.
* ETH and ecosystem tokens are likely to lead altcoin recovery.
* Regulatory clarity and ETF flows add legitimacy to broader crypto allocations.
* Historical alt-seasons emerge from BTC profit rotation—TOTAL2 leads that shift.
* However, several macro risks may trigger a correction before rallying:
* The Crypto Fear & Greed Index is currently high, suggesting overbought conditions.
* Macroeconomic uncertainties (e.g., inflation, rate hike fears) can suppress short-term risk appetite.
* Regulatory tightening across major jurisdictions introduces hesitation in capital deployment.
* Technical signs of a five-wave drop in BTC hint at a larger ABC correction scenario.
* DAT (Digital Asset Treasury) exposure among public firms may lead to forced liquidations during downturns.
**Philosophical or Narrative View:**
This is not just a market cycle—it's a reflection of decentralized innovation reclaiming narrative dominance. After fear-induced lows, TOTAL2's rise echoes the resilience of builders, protocols, and investor conviction. Each Fibonacci level acts like a checkpoint in the unfolding story of crypto's evolution beyond Bitcoin.
**Related Reference Charts:**
*
**Bias & Strategy Implication:**
* **Bias:** Bullish with short-term corrective risk
* **Accumulation Zone:** 1.0T–1.23T
* **Initial Risk:** Price may revisit the **Support Area (1T)** or even the **Strong Support Zone (775B–725B)** before a sustained move higher.
* **Partial TP:** 1.78T–2.05T
* **Extended TP:** 2.4T–2.98T
* Caution near TP4–Bonus zones as distribution risk increases
* Invalidated if closes below 725B (structure break)
**Notes & Disclaimers:**
This is a structural macro outlook and not financial advice. Markets are dynamic and subject to rapid shifts in sentiment, liquidity, and regulation. Always use risk management.

Texas Instruments: Rebound Underway, But Downside Still in PlayTexas Instruments initially continued its decline but has recently shown early signs of a rebound. Nonetheless, we still see greater downside potential in magenta wave (3), and expect the broader bearish magenta impulse to ultimately extend into the beige zone between $130.04 and $107.75. Should a new (corrective) high occur in green wave alt. above $221.79, it could temporarily postpone the anticipated sell-off. However, even in this 30% likely scenario, price would likely reverse no later than at the higher resistance level at $240.67.

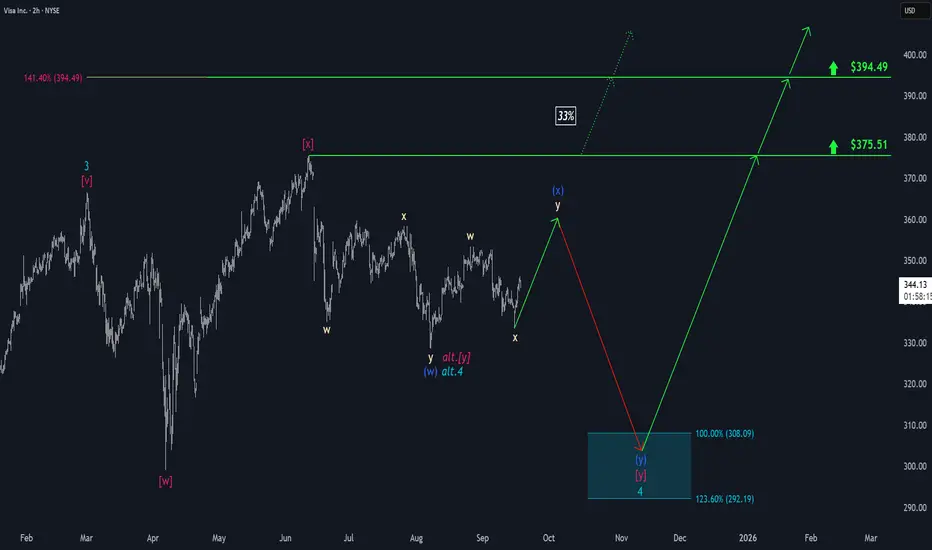
Visa: Corrective Upward MoveIn our primary scenario, we place Visa in the corrective upward move of blue wave (x). After the top, we expect the broader downward trend of turquoise wave 4 to take hold, which should push the stock into our turquoise Target Zone between $308.09 and $292.19. At that level, we anticipate a sustained reversal. From this low, a new upward impulse is likely: wave 5 should then have enough strength to lift price above the resistance levels at $375.51 and $394.49. However, an alternative scenario remains relevant: there is a 33% probability that the correction of wave alt.4 has already concluded. If so, the stock could immediately break above the resistance levels mentioned.
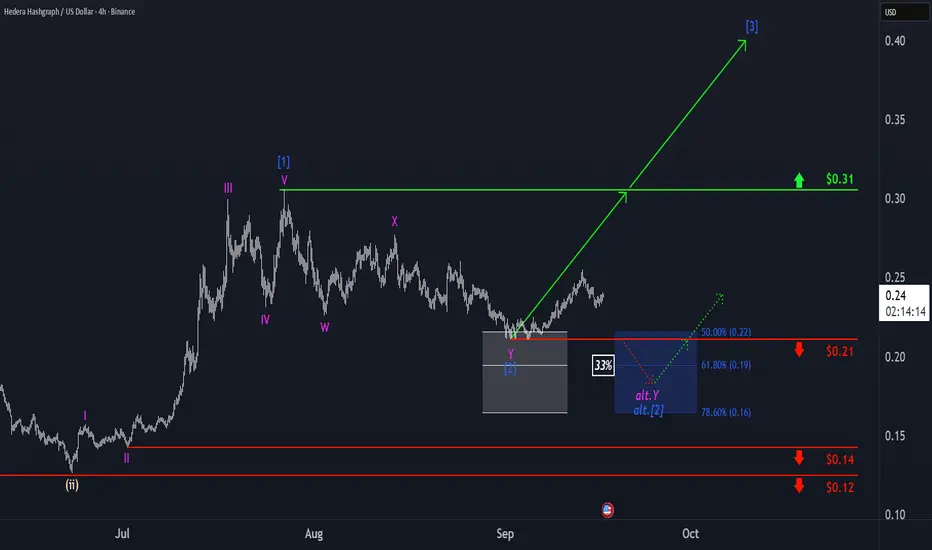
Hedera Hashgraph: Target Hit—Next Rally in SightA reversal began to emerge in the upper third of our grayed out Target Zone, prompting us to mark blue wave as complete. In the now-unfolding, same-colored wave , we anticipate gains well above resistance at $0.31. At the same time, we assign a 33% probability to a deeper low of wave alt. . In this case, however, we’d expect the reversal to happen no later than the blue (alternative) Target Zone ($0.22–$0.16), which would once again present an opportunity to initiate new long positions.
Coinbase: Breaking HigherAfter an extended period of sideways trading, Coinbase recently broke noticeably higher, prompting us to add a more detailed substructure for magenta wave . On a smaller scale, we now see prices moving in a blue three-part pattern, with wave (a) recently completed at $291.50—a level we identify as support. In the near term, wave (b) still has some room to move higher before wave (c) ultimately dips back below the $291.50 mark, at which point the previously mentioned magenta wave should be complete—well above the lower support level at $138.45. The following wave is expected to drive the next leg higher, potentially pushing the stock well above $444.65. However, we assign a 33% probability that COIN has completed magenta wave alt. at the $444.65 high and could next fall below the $138.45 support to establish a new low for turquoise wave alt.2 via wave alt. .

Polkadot: Rally Gains MomentumPolkadot’s DOT token has posted impressive gains recently. We primarily attribute this rally to wave iii in orange, which appears poised to break decisively above the $4.68 resistance level. At the same time, we see a 30% chance that a new correction low could still develop within the green alternative Target Zone between $3.22 and $2.31.

Palantir: Approaches Key Resistance Palantir has recently posted strong gains, moving closer to our magenta Target Zone between $171.80 and $184.62, which we’ve identified as the (corrective) top of magenta wave (B). In this range, we expect the stock to reverse course and head lower, continuing the broader correction—making this a favorable area for short positions. Magenta wave (C) is then projected to reach the green Target Zone between $117.42 and $95, completing the green wave . At that point, we anticipate a more substantial corrective rebound in wave . The green zone is therefore well-suited for taking profits on short trades or initiating short- to medium-term long-positions to capture the (temporary) advance of wave . For these long trades, a stop set 1% below the lower boundary of the zone can help manage risk.

FET: Eyes Further Gains as Uptrend Remains Intact FET managed to edge higher since last Thursday, further advancing orange wave b as we had primarily anticipated. We still expect its corrective high below the resistance at $1.16 before orange wave c likely triggers a decline toward support at $0.55. Above this level, we anticipate the low of blue wave (ii), which would signal a trend reversal to the upside. We currently assign a 35% probability to a somewhat deeper completion of the interim correction—in the form of wave alt.(ii) in blue—between the two support levels at $0.55 and $0.35.

Apple: Pulling Back, but Uptrend Still IntactApple has recently faced substantial downward pressure, retracing enough to erase the gains made in the first week of September. Our primary outlook is that the stock will soon rebound and, during green wave , rise toward resistance at $260.10. Following a moderate pullback in wave , shares should ultimately break through this level in wave , further advancing the broader upward trend. However, we continue to monitor our 37% likely alternative scenario. In this case, AAPL would have completed beige wave alt.b with its recent peak and could next target a new major low for blue wave alt.(IV) via wave alt.c . Here, the price would fall below support at $201.50 but ideally rebound above the lower mark at $168.

NVIDIA: Rally Stalling?After Nvidia initially drew closer to our beige Target Zone between $150.09 and $139.58, the stock was recently pushed higher once again. Therefore, we still see a 40% chance that a new high for beige wave alt.III could emerge above resistance at $184.11. However, our primary view is that price has already entered wave IV, which should extend downward into the aforementioned beige zone. Since we expect a strong rally during wave V, this price range presents an attractive entry point for long positions, with a stop that can be set 1% below the lower boundary of the zone. Looking ahead, beige wave V should extend up to the blue Target Zone between $227.38 and $260.60, where it should complete the larger waves (V) in blue and in lime green.

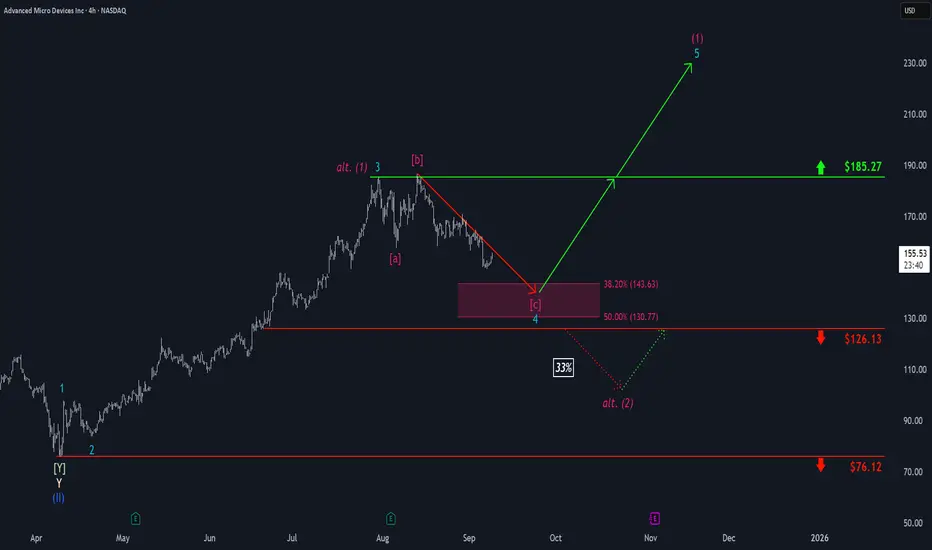
AMD: Drawing Closer...Step by step, AMD has been drawing closer to our magenta Target Zone between $143.63 and $130.77, which remains a favorable range for long entries. Prices should establish the low of turquoise wave 4 within this zone before reversing higher to resume the ongoing upward impulse—initially breaking above resistance at $185.27 and targeting the peak of magenta wave (1). However, we see a 33% chance that magenta wave alt. (1) has already completed, with a quicker low for wave alt. (2) likely to form below support at $126.13. Due to this alternative scenario, potential long trades within the magenta zone could be protected with a stop either 1% below the lower boundary of the zone or at the $126.13 level.
Tesla: New Alternative Scenario Emerges Tesla continues to face significant upward pressure, repeatedly testing resistance at $373.04. As a result, we have dropped our previous alternative scenario of an early sell-off in favor of a new upside alternative. We now see a 37% chance that the stock will break above the $373.04 resistance, forming an early top for beige wave alt.x above the next key level at $405.54. However, our primary expectation is that TSLA will first pull back into our green Target Zone between $273.11 and $231.66, where we anticipate the low of green wave . Thus, this range could present new short- to medium-term long entry opportunities to capitalize on the subsequently expected rally, which is likely to culminate in the regular wave x high above $405.54. Following this top, we expect the final sell-off phase within the broader corrective structure: wave y should drive price down into the beige Target Zone between $157.88 and $46.70, where we project the low of blue wave (II). This range could present attractive opportunities for longer-term long positions. For potential long trades—whether in the green or the beige zone—a stop set 1% below the lower boundary of the respective zone can help manage risk.

XRP: Lacks Momentum Despite Modest GainsRipple’s XRP is trading slightly higher today compared to last Monday, but it still hasn’t found real momentum. For now, it’s expected to continue moving upward toward resistance at $4.09 as part of turquoise wave B, before the correction of wave (2) is finally completed. The following magenta wave (3) should then drive gains above the $4.09 resistance level. If the altcoin manages to break directly above this level, this will suggest that wave alt.(2) has already wrapped up.

American Express: Momentum StallingAmerican Express shares recently managed to further extend green wave C before shifting into a period of sideways movement. However, the stock is expected to resume its climb toward the high of beige wave b in the near term. After that, our primary scenario calls for a sharp pullback, which would bring price down into our blue long Target Zone between $205.35 and $167.99. We anticipate this range will mark the final low of the blue corrective wave (IV). If the stock instead maintains its momentum and decisively breaks through resistance at $397.21, the bullish alternative scenario will be triggered (probability: 38%). In that case, blue wave alt.(IV) would be considered already complete.
