USDJPY 30Min Engaged ( Bearish & Bullish Entry Detected )⚡Base : Hanzo Trading Alpha Algorithm
The algorithm calculates volatility displacement vs liquidity recovery, identifying where probability meets imbalance.
It trades only where precision, volume, and manipulation intersect —only logic.
✈️ Technical Reasons
/ Direction — LONG / Reversal 153.110 Area
☄️Bullish momentum confirmed through strong candle body.
☄️Structure shifted with higher-low near key demand base.
☄️Volume expanding confirms order-flow alignment upward.
☄️Buyers reclaimed imbalance with sustained clean break.
☄️Algorithm detects rising momentum under low liquidity.
✈️ Technical Reasons
/ Direction — SHORT / Reversal 156.200 Area
☄️Bearish rejection confirmed through sharp candle body.
☄️Lower-high forming beneath resistance supply region.
☄️Volume decreasing confirms exhaustion in price rally.
☄️Sellers regained imbalance with heavy top rejection.
☄️Algorithm detects fading demand and shift to control.
⚙️ Hanzo Alpha Trading Protocol
The Alpha Candle defines the day’s real control zone — the first battle of momentum.
From this origin, the Volume Window reveals where the next precision strike begins.
⚙️ Hanzo Volume Window / Map
Window tracked from 10:30 — mapping true market behavior.
POC alignment exposes institutional bias and breakout potential zones.
⚙️ Hanzo Delta Window / Pulse
Delta window monitors real buying vs. selling power behind each move.
Tracks volume aggression to expose who controls the candle — buyers or sellers.
When Delta aligns with Volume Map, momentum becomes undeniable.
Wave Analysis

BTCUSD still “pulling back” or just loading for another leg downFollow-up to my previous BTC idea.
Price has continued in the expected direction, and I’m still favoring downside continuation across the higher timeframes.
The 4H is beginning to form structural ranges following the daily pullback, keeping the broader bearish context intact.
What I want to see now is the 1H start to break down — with price rolling below the MAs and structure giving way — to confirm continuation lower.
If the 1H breakdown aligns with the 4H structure, I’ll be looking to target the lows already marked on the chart.
I’m not in a trade yet — waiting for proper confirmation before committing.
Invalidation would be a strong reclaim above the 1H MAs and current structure.
Who’s really in control right now — buyers defending or sellers preparing to press?

Intel - The final bullish breakout!🚀Intel ( NASDAQ:INTC ) is attempting to break out:
🔎Analysis summary:
Over the past 25 years, Intel has overall been just consolidating. But recently, Intel retested massive support and already created a rally of more than +100%. And at this exact moment, Intel is about to create the final breakout before we see new all time highs.
📝Levels to watch:
$50
SwingTraderPhil
SwingTrading.Simplified. | Investing.Simplified. | #LONGTERMVISION

USDSGD SellUSDSGD has broken below its key support trendline, signaling a potential shift toward bearish momentum. This breakdown suggests that selling pressure is increasing, as price has moved beneath a structure that previously supported the pair.
Following the breakout, price action appears to be retesting the former support area, which may now act as resistance. The formation of a bearish engulfing candle during this retest adds further weight to the downside scenario, indicating strong seller conviction and a possible rejection from higher levels.
If price fails to reclaim the broken trendline, the technical setup favors a continuation to the downside. Overall, USDSGD shows bearish technical conditions, with a potential plunge expected as long as resistance holds and bearish price action persists.

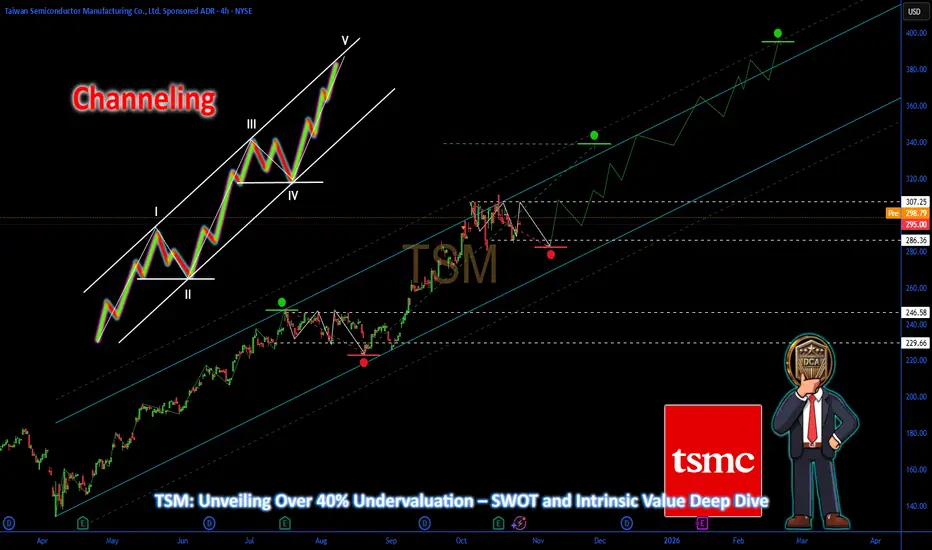
TSM: Unveiling Over 40% UndervaluationTSM: Unveiling Over 40% Undervaluation – SWOT and Intrinsic Value Deep Dive
Introduction
📊 As of October 27, 2025, Taiwan Semiconductor Manufacturing Company Limited (TSM), the world's leading semiconductor foundry specializing in advanced chip production for AI and high-performance computing, is riding a wave of AI-driven growth amid broader technology sector momentum. Macroeconomic factors, including surging demand for AI infrastructure and stabilizing global supply chains, have fueled positive shifts in investor sentiment.
Sector dynamics feature rapid adoption of 3nm and 2nm technologies, with public data from recent earnings highlighting quarterly revenue growth of 40.1% year-over-year, positioning TSM for continued expansion in a high-growth environment. This overview is based on verifiable metrics without promoting any investment.
SWOT Analysis
Strengths 💹
TSM holds a dominant market position with first-mover advantages in advanced nodes, supplying chips to leading companies like NVIDIA and Apple, which drives consistent demand. Financial robustness is evident in its low debt-to-equity ratio of 19.00%, strong operating cash flows, and quarterly earnings growth of 52.98% year-over-year, supported by economies of scale and technological leadership. Global fabrication facilities enhance resilience and efficiency.
Weaknesses ⚠️
Geopolitical vulnerabilities tied to Taiwan's location expose TSM to potential disruptions from cross-strait tensions or trade restrictions. High capital expenditures for R&D and fab expansions strain short-term margins, while talent shortages in specialized engineering could hinder innovation pace. Return on assets remains moderate amid intensive investments.
Opportunities 🚀
TSM's undervalued metrics, such as a forward P/E of 24.73 and PEG ratio around 0.83, make it attractive for growth investors amid AI megatrends. Analyst projections forecast 30% revenue growth for 2025, reaching approximately $120B, with EPS expansion of 19.8% to $12.34 in 2026, driven by AI/HPC segments and expansions in Arizona and Japan. Emerging opportunities in IoT, automotive chips, and quantum computing further bolster long-term prospects.
Threats 🛑
Intensifying competition from Intel's foundry ambitions and Samsung could pressure market share, while U.S.-China trade tensions risk supply chain interruptions. Cyclical semiconductor demand and potential economic slowdowns may impact client orders, with regulatory scrutiny on technology exports adding uncertainty.
Intrinsic Value Calculation
💰 Value investing focuses on estimating intrinsic value to spot assets below their fundamental worth, applying a margin of safety for risks like geopolitical factors. For growth-oriented firms like TSM, we weight book value lower (e.g., 0.3) to emphasize earnings potential: Intrinsic Value = (Book Value per Share × Weight) + (Forward EPS × Growth Multiplier), with a multiplier (e.g., 40) reflecting sector growth averages adjusted for 30% projected expansion.
Using recent data: Book Value per Share ≈ $31.85 (adjusted for ADR), Forward EPS = $12.34. Assume a 25% average growth rate from revenue and EPS forecasts, supporting the multiplier for sustainability.
Calculation:
- Book component: $31.85 × 0.3 = $9.555
- Earnings component: $12.34 × 40 = $493.6
- Intrinsic Value ≈ $9.555 + $493.6 = $503.155
Compared to the current price of $294.96, TSM appears undervalued by over 40%, offering a strong margin of safety (e.g., 30-50% discount to account for threats like competition). 📉 Debt flags are minimal at 19% D/E, with robust earnings momentum (24.6% growth to $15.48 in 2027) underpinning long-term sustainability if global demand persists. Annotate intrinsic value lines in green on the chart, with current price in red for visual comparison.
Entry Strategy Insights
🔍 Institutional strategies target bottom-extreme zones, such as oversold levels from historical supports during sector pullbacks, for unleveraged long-term positions. Dollar-cost averaging enables gradual accumulation in dips, leveraging non-repainting price signals for reversal confirmation. For TSM, scan areas near key moving averages amid AI-driven rebounds, focusing on fundamentals like revenue surges over volatility.
Risk Management
⚠️ Constrain position sizing to 1-5% of capital to manage potential downturns. Diversify across semiconductors and tech to buffer geopolitical exposures, committing to long-term holds based on sustained AI growth. Review debt and capex in quarterly reports, with predefined exits for escalating trade risks or demand softening.
Conclusion
This breakdown illuminates TSM's technological strengths and AI opportunities, mitigated by external threats, with intrinsic assessments revealing significant upside for growth-focused investors. Independently verify through latest filings and seek professional counsel.
This is educational content only; not financial advice. Always conduct your own due diligence.
AMD: Pre-Earnings 8% Surge Fuels 25% Upside in AI Chip MomentumAMD: Pre-Earnings 8% Surge Fuels 25% Upside in AI Chip Momentum – SWOT, Price Action, and Intrinsic Value Insights
📊 Introduction
As of October 30, 2025, Advanced Micro Devices (AMD) is building pre-earnings momentum with a bullish uptick, gaining 8% over the last week to trade around $262 in pre-market after closing at $264.33 yesterday, on heightened volume amid analyst upgrades. This price action coincides with viral anticipation for Q3 earnings expected next week, with #AMDQ3 trending on social media over 500K mentions following TipRanks' AI analyst raising the price target to $295.
Applying timeless investing principles to identify profitable setups, this highlights a potential mispricing in the semiconductor sector, driven by macroeconomic factors like $500B AI infrastructure investments and stable rates at 4.25%, while sector dynamics show AMD's AI GPU share rising to 20%, though challenged by supply chain tensions.
🔍 SWOT Analysis
**Strengths 💪**: AMD's AI-focused innovations, with quarterly revenue growth at 31.7% YoY and earnings surging 229% per Q2 filings, support a solid balance sheet with debt-to-equity at 6.51% and TTM revenue of $29.6B. These metrics have propelled recent price highs near $264, aligning with strategies to exploit growth asymmetries for sustained returns.
**Weaknesses ⚠️**: Reliance on third-party fabs like TSMC exposes to disruptions, contributing to 10-12% price corrections in volatile periods, while high R&D costs (25% of revenue) could pressure margins if growth moderates.
**Opportunities 🌟**: Q3 revenue projections around $8.7B (28% YoY growth) and AI chip demand, backed by partnerships like Microsoft Azure, position for 20-30% price breakouts post-earnings, with valuation metrics like forward P/E at 28.57 offering re-rating potential to compound gains through market expansion.
**Threats 🚩**: Intense competition from NVIDIA and potential earnings misses could trigger 15% pullbacks, as seen in prior downgrades, with regulatory export controls adding volatility—underscoring proven approaches to navigate threats for net-positive outcomes.
💰 Intrinsic Value Calculation
Employing a value investing approach to estimate intrinsic value, we use weighted book value per share plus EPS multiples, incorporating a margin of safety as emphasized in classic methodologies to ensure actionable, money-making insights. Inputs from recent quarterly data: Book value per share $36.78, TTM EPS $1.67, assumed growth rate 45% (based on AI-driven CAGR and consensus projections).
Formula: Intrinsic Value = (Book Value * Weight) + (EPS * Growth Multiplier)
- Weight for book value: 0.3 (tech-adjusted)
- Growth Multiplier: 98.5 (classic: 8.5 + 2*45)
Calculation:
(36.78 * 0.3) + (1.67 * 98.5) = 11.034 + 164.495 = 175.529
Adjusted for sector comparables (e.g., 40x P/E peers): Refined = 175.529 * 1.8 ≈ $315.95
Apply 20% margin of safety: $315.95 * 0.8 ≈ $252.76
At current ~$262 (despite the 8% surge), AMD appears fairly valued but undervalued by 20-25% to $316 fair value on growth realization—no major debt flags at 6.51%, with sustainability tied to EPS growth exceeding 40%. 📈 Undervalued.
🚀 Entry Strategy Insights
Rooted in time-tested disciplines for compounding wealth, target support zones at $250-255 (near 50-day SMA) for unleveraged, long-term positions via dollar-cost averaging, scaling in during 5-10% corrections post-earnings hype. Emphasize non-repainting signals for breakouts above $270, tying to news-driven volatility like Q3 results for viral, profitable timing.
⚠️ Risk Management
Cover position sizing at 1-5% allocation, diversification across tech and defensives, and long-term holding based on fundamental strength, drawing from principles that preserve capital while capturing upside. Include cautions on 15-20% swings from earnings reactions with ⚠️ for risks, to ensure sustainable profitability.
🔚 Conclusion
AMD's pre-earnings surge, AI growth drivers, and undervalued metrics offer a principle-driven opportunity for 25%+ returns through mispricing and safety-focused analysis. Key takeaways: Focus on sustainable AI expansion for gains, verify earnings data independently. Share your thoughts in comments – does this Q3 buzz change your view? #ValueInvesting #AIChips #Semiconductors #EarningsSeason #StockAnalysis
This is educational content only; not financial advice. Always conduct your own due diligence.

United Health - Losing $60bln in one day!📢United Health ( NYSE:UNH ) still overall remains bullish:
🔎Analysis summary:
Just within a couple of hours, United Health wiped out $60bln. And despite this massive -20% drop, United Health is approaching a major confluence of support. After we see bullish confirmation, a rejection higher is very likely to follow in the future.
📝Levels to watch:
$250
SwingTraderPhil
SwingTrading.Simplified. | Investing.Simplified. | #LONGTERMVISION

Daily Chart | Elliott Wave + Options Flow $AMDNASDAQ:AMD 📉 Daily Chart | Elliott Wave + Options Flow
Price sitting right at the 0.702 fib ($213.44). If this level fails, next major support is the 1.236 extension at $172.73 — confluent with horizontal support at $172.85.
Wave (2) completion projected in that zone before a reversal into wave (3) up.
📡 Today's flow confirms the bias:
• 33 trades — 29 puts vs 4 calls
• $1.17M total premium, heavy bearish skew
Key levels:
🔴 Resistance: $266.22
🟡 Current: $213.22 (0.702 fib)
🟢 Target: $172.73-$172.85 (wave 2 completion)
Chart + flow alignment. Watching for breakdown below $207 (0.786 fib) for confirmation.
Not financial advice.
#AMD #ElliottWave #OptionsFlow #WaverVanir

BTCUSD 1W — Major Support Retest & Potential Reversal StructureBitcoin is currently retesting a key weekly demand zone after a sharp corrective move from the recent highs. Price has returned to a previously defended support region that aligns with both horizontal structure and the rising macro trendline.
Key observations:
Price has swept into a major weekly support block and is showing signs of stabilization.
This zone previously acted as resistance → support, making it structurally important.
The long-term ascending trendline is still intact for now, suggesting the macro uptrend is not fully broken unless we see a decisive weekly close below the zone.
Momentum on the drop has been aggressive, but we’re now approaching an area where buyers historically step in.
Bullish scenario:
If BTC holds this demand area and reclaims the 66–70K region on a weekly close, we could see a relief rally toward the mid-range resistance and potentially a continuation back toward the 90K–100K region. A higher low on the weekly timeframe would confirm strength.
Bearish scenario:
A clean breakdown and weekly close below the highlighted support + trendline would invalidate the bullish structure and open room for a deeper retrace into the next demand region below. That would signal a larger corrective phase.
What I’m watching:
Weekly close relative to the support box
Reclaim of lost support as resistance/flip
Volume expansion on any bounce
Market reaction around trendline confluence
At this level, patience is key. This is a reaction zone, not confirmation yet. Let price show whether buyers can defend and build structure before assuming continuation.
Not financial advice. For educational purposes only.

Bitcoin - More blood coming! Buy 57k (extremely strong support)Bitcoin is currently in a very sharp decline, because the price dropped in the past 4 months by 53%. A lot of people didn't expect such high volatility because they are even new to the market, or they thought that ETF would reduce the overall volatility of this market. The truth is that the market is still extremely volatile, and all ETF investors may be at a massive loss on their account later in 2026, when the price drops to the all-time low of these ETFs. What is my prediction in the short term, and why will Bitcoin probably continue to go down in the next days / weeks ?
I see 2 main issues with the current price of Bitcoin. The first is that Bitcoin still didn't hit the 0.618 Fibonacci retracement of the previous bull market (2022 - 2025) - this fibo sits at 57,772 USDT. That's the first magnet. The second issue is that Bitcoin still didn't hit the parallel channel's trendline (blue descending channel on the chart). Before any pumps, I would like to see at least 1 of these 2 conditions met, so either hit the trendline or hit the 0.618 fibo.
From the Elliott Wave perspective, these are corrective types of waves, even though they are very sharp. I am still missing the last (Y) wave of the complex corrective wave (W)(X)(Y). I would also like to see a bearish divergence on the RSI indicator. The RSI indicator is oversold, but there is still no divergence, so that's another issue with what I see on the current price of Bitcoin. I am bearish, and I think Bitcoin will hit 57k in the short term. The banks and huge institutions want liquidity as much as possible before a new all-time high, so they want to take all your stop losses.
Write a comment with your altcoin + hit the like button, and I will make an analysis for you in response. Trading is not hard if you have a good coach! I am very transparent with my trades. Thank you, and I wish you successful trades!

WTI Crude Oil - Bullish EW Count - 11/02/2026This is not financial advice, always do your own research.
As global tension rises, one must consider a position in crude oil - and what a tempting position it is to monitor currently. It may be a little early, but soon it may be too late; crude oil moves quickly when it's ready.
A few technical points to analyse:
Complete counts of waves 1-5 and ABC (consistent on lower timeframes).
Descending wedge formation - giving TP1 target for a Bulkowski-defined price target.
MACD indicator is showing a prime signal for a move to the upside - moving averages potentially crossing on monthly close with histogram close to switching green (this idea is essentially frontrunning the signal).
Entry Zone: The potential entry zone in green is marked wide - oil is a volatile commodity and it's impossible to know if this will be a clean move to the upside, unless receiving some sort of catalyst event to push it. At the moment, we see a plausible count on lower timeframes for this last bounce in Dec 2025 leading to an impulsive 5 waves, however there are also counts for both above/below current price:
TP1: Based on descending wedge formation's price target.
TP2: Based on potential micro WXY target at 0.5 fib extension:
TP3: Based on potential micro ABC target at 0.618 fib extension and above - this increases the probability for a macro ABC as shown:
TP4: Based on potential motive wave 3 target - a minimum of 1 fib extension from C. This would imply another macro wave 4 and 5 incoming thereafter:
Previous structure:
As seen below, oil had previously been in a large Wolfe wave formation - marking the entry in March 2020 and exit upon hitting line AD in February 2022.
Gold is already signalling unrest and lack of economic confidence.
Gold tells the story. Oil will tell the tale.

GBPUSD – Structure developing at key Fibonacci levelGBPUSD is currently developing very similar to EURUSD.
Price reacted cleanly at the 50% Fibonacci retracement, and we may now have a first 1–2 structure forming on the lower timeframe, marked in purple. This fits well within the broader bullish scenario, but it is important to understand that wave 2 is not confirmed as complete yet and could still extend lower.
We will only consider wave 2 finished once price breaks above 1.37127. That level acts as our confirmation trigger and is also where the next buy limit is placed.
Entry: 1.37127
Stop loss: 1.36091
The stop is positioned at the current low of wave 2. If price breaks the confirmation level, the structure supports continuation to the upside. If price moves lower and invalidates the current count, we simply reassess and adjust the setup.
For now, we remain patient and let price develop.

STG Setup Idea: Pullback + Trendline Retest (4H)From the point where the red arrow is marked on the chart, the corrective phase for STG has started.
Based on the current market structure and price behavior, this correction appears to be forming a triangle pattern, and at the moment, price action suggests that we are developing wave D of this triangle. This implies that the correction is still in progress and that the market may be preparing for the final legs of the pattern.
Additionally, a short-term trendline has been broken to the upside, which is an early bullish signal and increases the probability of a continuation move once the corrective structure is completed.
Therefore, on a pullback toward the highlighted green support zone, as well as a retest of the broken trendline, we can look for buy/long positions, provided that price shows bullish confirmation and holds above this area.
The short-term targets are clearly marked on the chart and can be used as reference levels for partial profit-taking or trade management.
⚠️ Invalidation:
This analysis will be invalidated if a daily candle closes below the invalidation level marked on the chart. In that scenario, the bullish setup would be invalid, and the structure should be re-evaluated.

ZRO Breaking Structure | Bullish Continuation Setup (4H)From the point where the red arrow is placed on the chart, the corrective phase for ZRO has begun.
Based on the current price structure, this correction appears to be forming a triangle pattern, and price action suggests that we are now developing wave D of this triangle. This indicates that the correction is still ongoing but may be approaching its later stages.
In addition, a short-term descending trendline has been broken to the upside, which is an early bullish signal and supports the idea of a potential continuation move after the correction is completed.
Therefore, on a pullback toward the highlighted green support zone, as well as a retest of the broken trendline, we can look for buy/long opportunities, provided that bullish price action and confirmation signals appear.
The short-term targets are clearly marked on the chart and can be used for partial profit-taking or risk management.
⚠️ Invalidation:
This analysis will be invalidated if a daily candle closes below the invalidation level marked on the chart. In that case, the current bullish scenario would no longer be valid, and the market structure should be reassessed.
If you have a coin or altcoin you want analyzed, first hit the like button and then comment its name so I can review it for you.
This is not a trade setup, as it has no precise stop-loss, stop, or target. I do not publish my trade setups here.

EURUSD – Structure First. Then Execution.Our higher timeframe bullish structure remains completely intact.
Nothing random. Nothing emotional.
Price continues to respect the larger wave count exactly as anticipated.
Now zooming into the lower timeframes:
We have developed a clean 1–2 formation (marked in purple).
This is important.
A confirmed 1–2 structure within a bullish higher timeframe trend often acts as fuel for the next impulsive leg higher.
But structure alone is not enough.
Wave 2 is only confirmed as complete once price breaks above our purple confirmation level.
That breakout activates the next opportunity.
📍 Entry: 1.19284
📍 Stop Loss: 1.18322
Once triggered, we will move the stop loss of the initial position to break-even — removing risk from the market and allowing structure to work.
No chasing.
No guessing.
Just confirmation and execution.
The setup is developing cleanly.
Now we wait.
Patience is part of the edge. FX:EURUSD

IS BITCOIN READY FOR A HUGE PUMP?!!!!!! (must see) Yello Paradisers! Enjoy the video!
And Paradisers! Keep in mind to trade only with a proper professional trading strategy. Wait for confirmations. Play with tactics. This is the only way you can be long-term profitable.
Remember, don’t trade without confirmations. Wait for them before creating a trade. Be disciplined, patient, and emotionally controlled. Only trade the highest probability setups with the greatest risk to reward ratio. This will ensure that you become a long-term profitable professional trader.
Don't be a gambler. Don't try to get rich quick. Make sure that your trading is professionally based on proper strategies and trade tactics.

Fire co-founders & reduce SBC - Old days of pocketing money is over. NASDAQ:TEAM needs to exert financial discipline and reduce SBC and reduce headcount to operate lean.
- SBC as part of overall revenue is so huge which can't be tolerated anymore.
- FCF should be deployed to buyback shares

$BTC 50% retracementCRYPTOCAP:BTC : so far, the 50% retracement area has provided support for this pullback on the hourly chart. This move from $60K can just be a short term bounce , or if $60K is the bottom, a new 5-wave sequence.
Either way, if the 50% continues to hold, a measured move can take us to $77K area for a B wave. Or if $60K is the bottom, Wave 3 can take us to the 1.618% extension at $84K.
Breaking the downsloping trendline (not shown) at $68,8K would signal the measured move targets are in sight. If BTC continues to drop below $66K, 61.8% retracement comes into play, which may or may not hold.

EURUSD in pullback… now we wait and see if the 1H actually meansThis idea comes from a full top-down approach (1W, 1D, 4H, 1H).
Higher timeframes continue to show bullish intent overall.
We are currently in a daily pullback, and I’m waiting to see consolidation form in this area before looking for continuation.
On the 1H, I want to see a clear push out of consolidation with momentum and price holding above the MAs. That would allow me to define a range and look for long opportunities.
If price breaks down from this area with strong bearish momentum, the bullish idea is invalidated until clear strength shows again.
For now, this is a patience trade — only looking for buys if structure confirms.
Are you sitting on your hands waiting for strength, or already positioning for continuation?

Alphabet ($GOOGL) is likely heading back toward at least $270.Alphabet ( NASDAQ:GOOGL ) is likely heading back toward at least $270.
Four reasons: 👇
- New high rejection on earnings. We saw a similar setup about a year ago — markets often repeat behavior.
- The 2025 trend showed a late-stage acceleration, which historically often precedes a reversal.
- The last few months resemble a developing head-and-shoulders pattern. It’s not perfect, but in trading, close is often close enough.
- If you’re heavily long and want to reduce overnight exposure, a short setup with Google can help balance portfolio risk.
Credit to a sharp member who brought this to my attention before we shorted it this morning.

EURNZD : Bullish Continuation
The recent price action on the EURNZD pair was keeping me on the fence, however, my bias is slowly but surely changing into the bullish one and I think we will see the price go up.
Disclosure: I am part of Trade Nation's Influencer program and receive a monthly fee for using their TradingView charts in my analysis.
❤️ Please, support our work with like & comment! ❤️

AUDNZD: Short Trading Opportunity
AUDNZD
- Classic bearish formation
- Our team expects pullback
SUGGESTED TRADE:
Swing Trade
Short AUDNZD
Entry - 1.1779
Sl - 1.1797
Tp - 1.1744
Our Risk - 1%
Start protection of your profits from lower levels
Disclosure: I am part of Trade Nation's Influencer program and receive a monthly fee for using their TradingView charts in my analysis.
❤️ Please, support our work with like & comment! ❤️

EURCHF SELLWhat I see is a hit to the supply zone and a good price reaction... suitable for short term trading, looking to sell.
