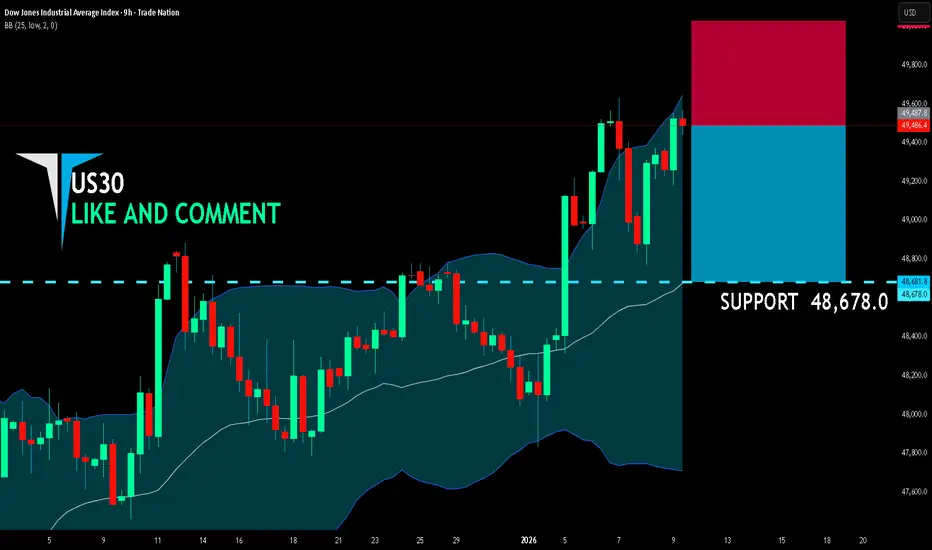
US30 BEARISH BIAS RIGHT NOW| SHORT
US30 SIGNAL
Trade Direction: short
Entry Level: 49,487.8
Target Level: 48.678.0
Stop Loss: 50,026.4
RISK PROFILE
Risk level: medium
Suggested risk: 1%
Timeframe: 9h
Disclosure: I am part of Trade Nation's Influencer program and receive a monthly fee for using their TradingView charts in my analysis.
✅LIKE AND COMMENT MY IDEAS✅
Wave Analysis
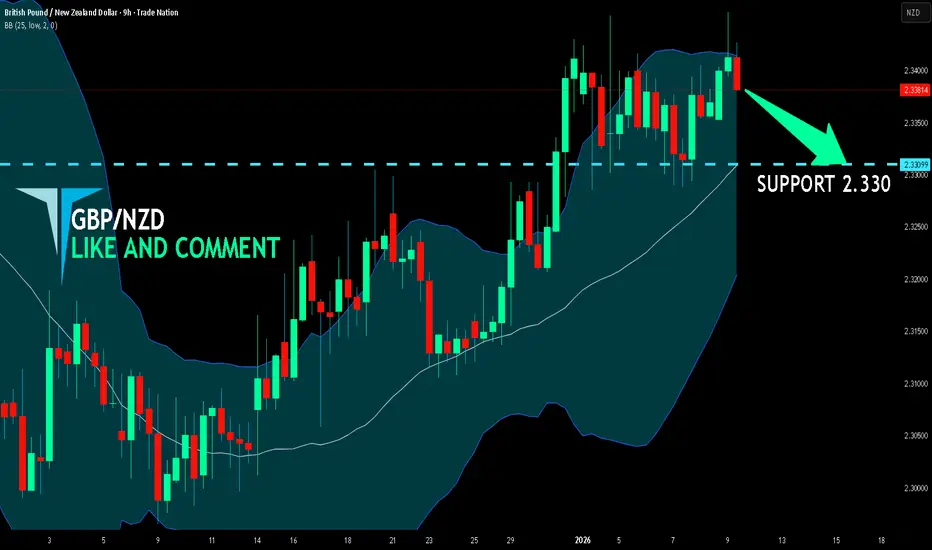
GBP/NZD BEST PLACE TO SELL FROM|SHORT
Hello, Friends!
GBP/NZD is trending down which is clear from the red colour of the previous weekly candle. However, the price has locally surged into the overbought territory. Which can be told from its proximity to the BB upper band. Which presents a great trend following opportunity for a short trade from the resistance line above towards the demand level of 2.330.
Disclosure: I am part of Trade Nation's Influencer program and receive a monthly fee for using their TradingView charts in my analysis.
✅LIKE AND COMMENT MY IDEAS✅
US30 - 48160 Dow Jones Analysis
The market failed to print a new ATH, despite bullish sentiment and upside expectations.
At the same time, there is no valid evidence for a strong bearish reversal yet.
What we do have is a clear loss of upside momentum.
On lower timeframes, price is already respecting a minor corrective geometry, with key levels at:
48722
48365
48122
Critical levels to watch:
– 49160 → bearish confirmation on lower timeframes
– 48160 → decisive level on the daily chart
Market clarity will come from reaction, not prediction.
Conclusion:
Upside is weak and capped, but downside is not confirmed yet.
A controlled pullback is the most logical path for now.
If 48160 breaks, bearish targets are already mapped and the next leg will be approached with precision.
Until then, patience > bias.

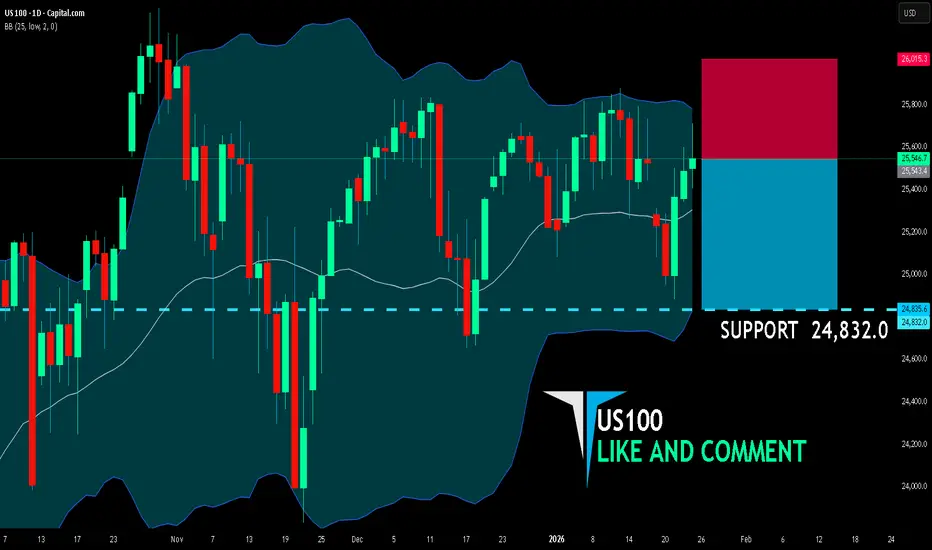
US100 BEST PLACE TO SELL FROM|SHORT
US100 SIGNAL
Trade Direction: short
Entry Level: 25,543.4
Target Level: 24,832.0
Stop Loss: 26,015.3
RISK PROFILE
Risk level: medium
Suggested risk: 1%
Timeframe: 1D
Disclosure: I am part of Trade Nation's Influencer program and receive a monthly fee for using their TradingView charts in my analysis.
✅LIKE AND COMMENT MY IDEAS✅
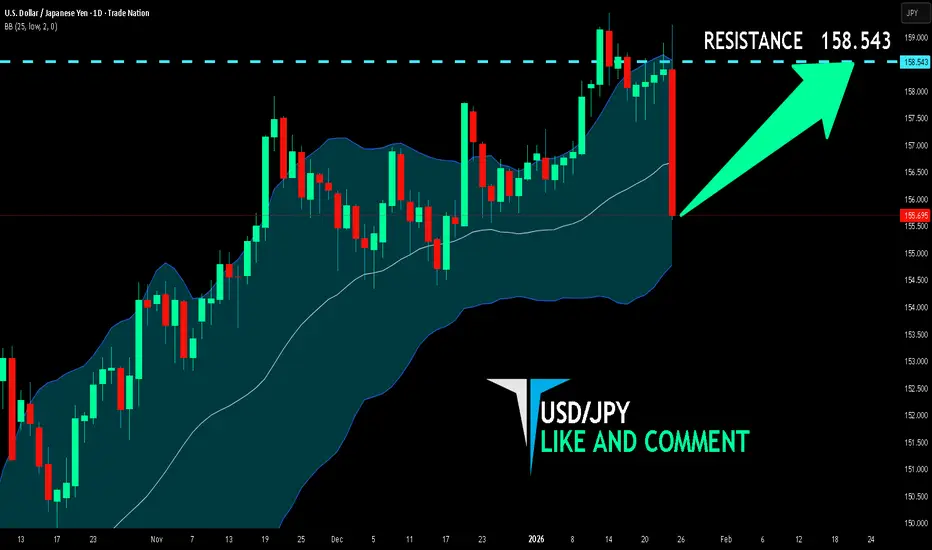
USD/JPY BULLS ARE STRONG HERE|LONG
Hello, Friends!
We are targeting the 158.543 level area with our long trade on USD/JPY which is based on the fact that the pair is oversold on the BB band scale and is also approaching a support line below thus going us a good entry option.
Disclosure: I am part of Trade Nation's Influencer program and receive a monthly fee for using their TradingView charts in my analysis.
✅LIKE AND COMMENT MY IDEAS✅
AUD/USD SHORT FROM RESISTANCE
Hello, Friends!
We are now examining the AUD/USD pair and we can see that the pair is going up locally while also being in a uptrend on the 1W TF. But there is also a powerful signal from the BB upper band being nearby, indicating that the pair is overbought so we can go short from the resistance line above and a target at 0.679 level.
Disclosure: I am part of Trade Nation's Influencer program and receive a monthly fee for using their TradingView charts in my analysis.
✅LIKE AND COMMENT MY IDEAS✅

RON: Irregular Flat (3-3-5) - The final flushIrregular Flat Correction
We are currently seeing a textbook Irregular Flat (or Expanded Flat) structure on the macro timeframe. This pattern is notorious for being a double trap , shaking out both sides of the market before the primary trend resumes with extreme violence.
Wave A & B: The move into the B wave created a bull trap by briefly exceeding previous highs.
Wave C (Current): We are currently in the final leg, a 5-wave impulsive decline. This is a liquidation move designed to hunt stops below the major support levels.
The Target:
The 1.618 Fibonacci extension of move BC lands exactly at $38.00. AND in the meantime, expect a fast and aggressive retest of the ATH once the Wave 4 pivot is broken.

How to Maximize Your Returns in the Global Market1. Understand the Global Market Landscape
The global market is made up of developed markets (such as the US, Europe, Japan), emerging markets (India, China, Brazil), and frontier markets. Each behaves differently based on economic growth, political stability, currency strength, and capital flows. Developed markets offer stability and transparency, while emerging markets provide higher growth potential but with increased volatility. Maximizing returns begins with understanding where you are investing and why that region fits your risk appetite and time horizon.
2. Diversify Across Countries and Asset Classes
One of the biggest advantages of global investing is diversification. Economic cycles do not move in sync across countries. When one economy slows, another may be accelerating. By spreading investments across regions, sectors, and asset classes—equities, bonds, commodities, ETFs, and alternative assets—you reduce dependency on a single market. True diversification is not about owning many assets, but owning assets that respond differently to global events.
3. Follow Global Macroeconomic Trends
Global returns are strongly influenced by macroeconomic factors such as interest rates, inflation, GDP growth, trade policies, and central bank decisions. For example, rising US interest rates often strengthen the dollar and pull capital away from emerging markets, while easing cycles tend to support risk assets globally. Investors who track global economic indicators can position themselves early and benefit from long-term structural trends rather than short-term noise.
4. Currency Management Is Critical
Currency movements can significantly impact global returns. Even if an overseas stock performs well, currency depreciation can reduce your gains when converted back to your home currency. Conversely, currency appreciation can boost returns. Smart investors either hedge currency risk using financial instruments or deliberately take exposure to strong currencies during favorable cycles. Understanding currency dynamics is essential for maximizing real returns in global investing.
5. Use Global ETFs and Index Funds Wisely
For most investors, global ETFs and index funds are efficient tools to gain international exposure. They offer diversification, liquidity, and lower costs compared to actively managed funds. Regional ETFs, sector-specific global ETFs (technology, energy, healthcare), and thematic ETFs (AI, clean energy, semiconductors) allow investors to capture global growth trends without needing deep knowledge of individual foreign stocks.
6. Focus on Sectors with Global Tailwinds
Certain sectors benefit from worldwide demand regardless of geography. Technology, renewable energy, healthcare, infrastructure, defense, and consumer staples often have global revenue streams. Investing in companies or funds tied to these sectors helps capture global growth drivers. The key is to identify long-term tailwinds rather than chasing short-term hype.
7. Balance Active and Passive Strategies
Passive investing works well for capturing broad global market returns, but active strategies can add value in inefficient or volatile markets. Emerging and frontier markets often present mispricing opportunities due to lower analyst coverage. Combining passive global exposure with selective active bets allows investors to enhance returns while controlling risk.
8. Manage Risk Proactively
Higher returns are always linked with higher risk. Successful global investors focus as much on risk control as on return generation. This includes position sizing, stop-loss strategies, portfolio rebalancing, and avoiding excessive leverage. Geopolitical risk, regulatory changes, and sudden policy shifts can quickly affect global markets, so flexibility and discipline are essential.
9. Adopt a Long-Term Investment Horizon
Short-term global market movements are unpredictable, often driven by news and sentiment. Long-term investors benefit from compounding, structural growth, and economic expansion across regions. Staying invested through cycles, rather than reacting emotionally to volatility, is one of the most powerful ways to maximize global returns.
10. Leverage Technology and Data
Modern investing tools provide real-time global data, research, analytics, and AI-driven insights. Investors who use global screeners, economic dashboards, and portfolio analytics can make more informed decisions. Technology reduces information gaps and allows retail investors to compete more effectively in global markets.
11. Stay Aware of Geopolitics and Regulations
Trade wars, sanctions, elections, and regulatory changes can reshape entire markets overnight. Understanding geopolitical dynamics helps investors anticipate risks and opportunities. For example, supply-chain shifts, energy policies, or defense spending can create long-term investment themes across regions.
12. Rebalance and Review Regularly
Global portfolios need regular review. Market movements can change asset allocation unintentionally, increasing risk. Periodic rebalancing ensures alignment with original goals and allows investors to book profits from outperforming regions while reallocating to undervalued ones.
Conclusion
Maximizing returns in the global market is not about predicting the next big event but about building a resilient, well-diversified strategy aligned with global economic realities. By combining diversification, macro awareness, disciplined risk management, and a long-term mindset, investors can harness global opportunities while managing uncertainty. In an interconnected world, those who understand global dynamics and stay adaptable are best positioned to achieve consistent and sustainable returns.

Global Economy Shifts1. Shift from Globalization to Regionalization
For decades, globalization dominated economic growth through free trade and global supply chains.
Recent disruptions like pandemics, wars, and trade tensions have exposed vulnerabilities.
Countries are now focusing on regional trade blocs (ASEAN, EU, USMCA) rather than global dependence.
“Near-shoring” and “friend-shoring” are replacing offshoring to distant low-cost nations.
This shift improves resilience but increases production costs and inflationary pressures.
2. Geopolitical Realignment of Economic Power
The world is moving from a unipolar to a multipolar economic structure.
The US remains dominant, but China, India, and emerging economies are gaining influence.
Economic alliances are increasingly shaped by political alignment rather than efficiency.
Sanctions, tariffs, and trade barriers are now key economic tools.
Global institutions face pressure as national interests take priority.
3. Rise of Emerging Markets
Emerging economies now contribute a majority of global growth.
Countries like India, Vietnam, Indonesia, and Brazil are becoming manufacturing and consumption hubs.
A growing middle class is driving demand for housing, healthcare, education, and technology.
Capital flows are gradually shifting toward high-growth emerging markets.
However, these economies face risks from currency volatility and capital outflows.
4. Transformation of Global Supply Chains
Just-in-time supply models are being replaced with just-in-case strategies.
Firms are diversifying suppliers to avoid over-reliance on one country.
Automation and robotics are reducing the cost advantage of low-wage economies.
Strategic industries like semiconductors and defense are being localized.
Supply chain resilience has become a core business priority.
5. Technological Disruption of Economic Systems
Artificial intelligence, automation, and digital platforms are reshaping productivity.
AI is changing labor demand, increasing efficiency while displacing routine jobs.
Digital payments, fintech, and blockchain are transforming financial systems.
Technology reduces barriers to entry but increases skill-based inequality.
Nations investing in digital infrastructure gain long-term economic advantage.
6. Shift in Labor Markets and Workforce Dynamics
Aging populations in developed countries are reducing workforce participation.
Younger populations in emerging markets offer demographic advantages.
Remote work has altered global labor distribution.
Demand for high-skill labor is rising, while low-skill jobs face automation risk.
Governments must reskill workers to avoid long-term unemployment.
7. Inflation and Interest Rate Regime Change
The low-interest-rate era has ended after years of monetary stimulus.
Inflation surged due to supply shocks, energy crises, and fiscal expansion.
Central banks are prioritizing price stability over growth.
Higher interest rates affect borrowing, asset prices, and capital flows.
This marks a structural shift in global financial conditions.
8. Energy Transition and Green Economy Shift
Fossil-fuel-based growth is being challenged by climate commitments.
Renewable energy investments are accelerating worldwide.
Carbon pricing and emission regulations are reshaping industries.
Green technologies create new economic opportunities and jobs.
Energy-importing nations aim for energy security through renewables.
9. Climate Change as an Economic Risk
Climate events disrupt agriculture, infrastructure, and supply chains.
Insurance costs and disaster recovery expenses are rising.
Countries vulnerable to climate change face slower growth.
Climate adaptation and mitigation are now economic necessities.
Investors increasingly factor climate risk into capital allocation.
10. Changing Consumer Behavior
Consumers are shifting from ownership to access-based consumption.
Demand for sustainable, ethical, and digital products is increasing.
Services are growing faster than traditional manufacturing sectors.
E-commerce and digital platforms dominate retail and services.
Consumer confidence is increasingly sensitive to inflation and job security.
11. Debt Expansion and Fiscal Stress
Global debt levels have reached historic highs.
Governments expanded borrowing to support economies during crises.
High debt limits fiscal flexibility and increases default risk.
Developing nations face challenges refinancing external debt.
Debt restructuring and fiscal discipline are becoming critical issues.
12. Financial Market Integration and Volatility
Global capital markets are deeply interconnected.
Monetary policy changes in major economies affect global asset prices.
Capital flows quickly shift based on interest rates and risk perception.
Volatility has increased due to geopolitical uncertainty.
Investors demand higher risk premiums across markets.
13. Shift in Global Trade Patterns
Trade growth is slowing compared to past decades.
Services trade and digital trade are expanding faster than goods trade.
Trade disputes and protectionism are rising.
Countries are prioritizing domestic production for strategic goods.
Trade policies now balance economic efficiency with national security.
14. Role of Central Banks and Policy Coordination
Central banks play a larger role in economic stability.
Policy coordination across countries is weakening.
Currency interventions and capital controls are increasing.
Central bank credibility is critical for investor confidence.
Monetary independence is harder in an interconnected world.
15. Inequality and Social Pressure
Income and wealth inequality are widening globally.
Technological change benefits skilled workers disproportionately.
Rising living costs increase social and political tensions.
Governments face pressure to expand welfare and social spending.
Economic inequality influences political outcomes and policy choices.
16. Shift Toward Strategic Economic Nationalism
Nations are prioritizing economic sovereignty.
Strategic industries receive government support and subsidies.
Industrial policy is making a comeback.
Competition between nations extends beyond trade into technology and finance.
Global cooperation is being tested by national interests.
17. Long-Term Structural Growth Changes
Global growth is expected to be slower but more diversified.
Productivity gains will depend on innovation and education.
Economic leadership will be shared across regions.
Sustainable growth models will replace short-term expansion strategies.
Adaptability will define economic success.
Conclusion
The global economy is in a phase of structural transformation, not a temporary cycle.
Power, production, and prosperity are being redistributed.
Nations, businesses, and investors must adapt to new realities.
Flexibility, innovation, and resilience are essential for future growth.
Understanding these shifts is critical for navigating economic uncertainty.

Short_eternalHi traders,
Currently Eternal is trading at One year low with strong rejection @ resistance in weekly timeframe.
Go short until it breaks previous market structure and target 🎯 @ 200.
Disclaimer:- only for educational purpose.

Sentiment Analysis Using AI and Big DataConcept of Sentiment Analysis
At its core, sentiment analysis aims to classify data into emotional categories such as positive, negative, or neutral. More advanced systems go beyond simple polarity and detect emotions like happiness, anger, fear, trust, or anticipation. AI-driven sentiment analysis does not just identify what people are talking about but also how they feel about it. This makes it a crucial tool for businesses, governments, financial markets, and researchers.
Role of AI in Sentiment Analysis
AI is the backbone of modern sentiment analysis. Traditional rule-based systems relied on predefined dictionaries of positive and negative words, which were limited and often inaccurate. AI, particularly Machine Learning (ML) and Deep Learning (DL), has transformed this field by enabling models to learn patterns directly from data.
Natural Language Processing (NLP), a branch of AI, allows machines to understand human language. Techniques such as tokenization, part-of-speech tagging, named entity recognition, and semantic analysis help models interpret context, sarcasm, slang, and linguistic variations. Advanced models like transformers and large language models can understand sentiment even when it is implicit or context-dependent.
AI also supports multilingual sentiment analysis, enabling global organizations to analyze sentiments across different languages and cultures without manual translation.
Big Data as the Foundation
Big Data refers to datasets characterized by high volume, velocity, and variety. Sentiment analysis depends heavily on Big Data because emotions and opinions are scattered across millions of data points. Social media platforms, e-commerce websites, financial news feeds, and IoT-generated data continuously stream information that must be captured, stored, and processed in real time.
Big Data technologies such as distributed databases, cloud storage, and parallel processing frameworks allow sentiment analysis systems to scale efficiently. They make it possible to analyze historical data for long-term trends as well as real-time data for immediate insights.
Integration of AI and Big Data
The real power of sentiment analysis emerges when AI and Big Data work together. Big Data provides the raw material—massive, diverse datasets—while AI provides the intelligence to interpret them. AI models are trained on large datasets to improve accuracy, adapt to changing language patterns, and reduce bias.
For example, in real-time sentiment analysis, streaming data pipelines ingest live tweets or news updates, while AI models instantly analyze sentiment and generate insights. This integration is especially valuable in fast-moving domains like financial markets or crisis management.
Applications of Sentiment Analysis
Business and Marketing
Companies use sentiment analysis to understand customer opinions about products, services, and brands. By analyzing reviews, social media comments, and feedback surveys, businesses can identify strengths, weaknesses, and emerging issues. This helps in product development, brand reputation management, and personalized marketing strategies.
Financial Markets
In trading and investment, sentiment analysis plays a critical role. AI systems analyze news articles, earnings reports, social media chatter, and analyst opinions to gauge market sentiment. Positive or negative sentiment often influences stock prices, volatility, and trading volumes. Hedge funds and algorithmic traders increasingly rely on sentiment-driven signals to gain an edge.
Politics and Public Policy
Governments and political organizations use sentiment analysis to understand public opinion on policies, elections, and social issues. By analyzing speeches, media coverage, and social platforms, policymakers can assess public response and adjust communication strategies accordingly.
Customer Support and Service
Sentiment analysis helps organizations monitor customer emotions during interactions such as emails, chats, and call transcripts. AI systems can flag highly negative sentiments in real time, allowing human agents to intervene and improve customer satisfaction.
Healthcare and Social Research
In healthcare, sentiment analysis is used to study patient feedback, mental health indicators, and public responses to health campaigns. Researchers analyze online discussions to understand stress levels, emotional well-being, and societal trends.
Advanced Sentiment Analysis Techniques
Modern sentiment analysis goes beyond basic classification. Aspect-based sentiment analysis identifies sentiment toward specific features, such as battery life or customer service. Emotion detection recognizes nuanced feelings rather than simple polarity. Multimodal sentiment analysis combines text, audio, and visual data to provide deeper emotional insights, such as analyzing facial expressions alongside spoken words.
AI models continuously improve through reinforcement learning and feedback loops, adapting to new slang, cultural shifts, and evolving language usage.
Challenges and Limitations
Despite its advancements, sentiment analysis faces several challenges. Sarcasm, irony, and ambiguous language can mislead AI models. Cultural and regional differences affect how emotions are expressed, making global sentiment analysis complex. Data quality and bias are also major concerns, as models trained on biased datasets can produce skewed results.
Privacy and ethical considerations are increasingly important. Organizations must ensure responsible data usage, transparency, and compliance with data protection regulations when analyzing user-generated content.
Future of Sentiment Analysis
The future of sentiment analysis lies in deeper contextual understanding and real-time intelligence. As AI models become more sophisticated and Big Data infrastructure more powerful, sentiment analysis will move from descriptive insights to predictive and prescriptive intelligence. Systems will not only detect sentiment but also forecast emotional trends and recommend actions.
Integration with generative AI, voice analysis, and emotional AI will further expand its scope, enabling machines to understand human emotions more naturally and accurately.
Conclusion
Sentiment analysis using AI and Big Data has become an essential tool in the modern data-driven world. By combining massive datasets with intelligent algorithms, organizations can decode human emotions at scale and transform raw opinions into actionable insights. While challenges remain, continuous advancements in AI, Big Data, and ethical frameworks are shaping sentiment analysis into a more accurate, responsible, and impactful technology for the future.

Lower Lows For ONDOONDO Potentially printing sub-wave 5 of an extended 3rd wave of one higher degree. This suggests lower lows for ONDO. This also hints that the 5th impulsive wave of an even higher degree is not in yet. Key take away: Price is still impulsive to the downside.
This Publish Is Intended For Educational Purposes Only

IREN | DailyNASDAQ:IREN — Quantum Model Projection
Bullish Alternative 📈
IREN has appreciated ~70% since mid-December, launched decisively from the support
Q-Structure λₛ confluence.
This advance is projected as the initial phase of Intermediate Wave (5) within Primary Wave ⓷, potentially unfolding as an extension, with a Fib-extension target ➤ $431 🎯 (beyond the scope of the daily frame).
🔖 This bullish alternative structurally aligns with early Primary Wave ⓹ within Wave III of BTC ’s second Cycle.
🔖 This outlook is derived from insights within my Quantum Models framework. Within this methodology, Q-Targets represent high-probability scenarios generated by the confluence of equivalence lines. These Quantum Structures also serve as structural anchors, shaping the model's internal geometry and guiding the evolution of alternative paths as price action unfolds.

MSFT - Target 408-426 in last half of Apr 2026
MSFT good target price to load for long term is at support zone level 408-425 where there are huge volumes traded. I think it may reach that somewhere late Apr 2026 before its next earnings that time (sideway down a huge bull flag). This zone level is also right at the 200EMA of the weekly chart.

$LAC Lithium Americas Corporation resembling Livermore's ChartNYSE:LAC looks identical to Livermore's speculative chart. Next up: the explosive phase wave 8 & 9

btc 1min shortthe 1m chart has confirmed the short. price rallied to the supply zone as expected. i expect price to target 86k
A move up, above $90500 will invalidate this trade

Dow Jones (US30) Surges on Diplomatic BreakthroughThe Dow Jones index (US30) is displaying impressive buying strength. Market sentiment is driven by a major geopolitical shift: the cancellation of Trump’s tariffs on Europe in exchange for strategic agreements (Greenland). This diplomatic easing is unlocking massive growth potential for American companies.
📈 My Trading Plan:
Bias: Resolutely Bullish.
Buy Zone: Identified on the chart, where liquidity is maximized for a potential breakout.
Stop Loss (SL): H4 candle close below the zone. Discipline is key: if the zone breaks on a closing basis, the scenario is invalidated.
Take Profit (TP): Aiming for the all-time highs marked on the chart.
Key to Success: Patience and Discipline. We don't anticipate the move; we follow the structure.

Elise |XAUUSD | 30M – Bullish Continuation After Demand ReactionOANDA:XAUUSD
After a healthy pullback into demand, price printed a strong bullish reaction and resumed upside momentum. This move suggests continuation rather than exhaustion. As long as price holds above the demand zone, upside liquidity remains the preferred path.
Key Scenarios
✅ Bullish Case 🚀 → Continuation above demand can drive price toward external highs.
🎯 Target 1: 5000
🎯 Target 2: 5050
❌ Bearish Case 📉 → A sustained break and close below the demand zone would invalidate the bullish continuation and signal deeper correction.
Current Levels to Watch
Resistance 🔴: 5000 – 5050
Support 🟢: 4900 – 4860
⚠️ Disclaimer: This analysis is for educational purposes only. It is not financial advice. Please do your own research before trading.

WTI H4As anticipated in my previous analyses, WTI (Crude Oil) confirms its bullish momentum. The price structure validates buyer strength, supported by a tense geopolitical and energy landscape at the start of 2026.
📌 Key Analysis Points:
Bias Confirmation: The long-term vision remains intact. Price is respecting its supports and heading toward the major resistance levels identified on the chart.
Catalysts: Recent disruptions to energy infrastructure and rising global demand are pushing the barrel toward new highs.
Targets: Take Profit (TP) targets are clearly mapped on the chart. We are aiming for an extension of the current trend to sweep liquidity at the highs.
🛡️ Strategy: Patience has paid off. For those looking for entry points, watch for retests of Demand Zones on lower timeframes.
Golden Rule: Follow the plan, manage your risk, and let profits run toward the target zones.

SILVER $400 - UNIQUE OPPORTUNITY📣 Hello everyone!
Here is the global chart of XAG/USD and directly my long-term trading idea, time frame 1 month. Here is the story from 1802, but in fact this is not even a complete timeline.
I believe we are “close” to completing the Elliott Global Five on the silver chart. The first primary impulse wave, in my opinion, ended in 1864, the second corrective primary wave ended in 1932. From 1932 to 1980, the most powerful third Elliott wave of the primary level was formed - in 48 years, silver increased in price by 170 times. Then from 1980 to 1991 there was a bear market in the correctional wave-4 of the primary level. Further, from 1991 to the present day, the global impulse wave 5 of the primary level of the cycle has been developing.
Within the framework of my Elliott idea, we should expect that wave-5 of the primary level will be fully formed within 45-74 years, that is, from 2036 to 2065. Taking into account the dollar charts, US inflation, government bond yields and other important macroeconomic data, I am more inclined to believe that the cycle will end in 2036. Therefore, my goal is $400 per ounce of silver by 2036. This is an increase of approximately 18 times from the current price. This is great news for long-term investors.
As for this relatively short-term outlook for Silver, in the first half of 2024 there is still a chance, within the bullish flag, to descend to the zone of 14-16 dollars per ounce. Either way, I believe that in the longer term, silver is already incredibly close to breaking through its twelve-year downtrend resistance. As soon as the bullish flag and, accordingly, trend resistance are broken upward, then after a long period of consolidation, vigorous growth will begin and silver will quickly return to the highs of 2011. Be prepared for this.
❌ It is also necessary to understand that according to my current wave marking, under no circumstances should the price fall below $7.28, this is the completion level of wave 1 of the secondary level. If this happens, then it will be necessary to look for an error and make serious changes to the Elliott price movement marks in this trading idea.
⚠️ As always, I wish you good luck in making independent trading decisions and profit ✊
Goodbye!

BTCUSD 24/1/2026 Correction PhaseBTCUSD is still on correction phase, wait until correction end for taking BUY.

AVAX Triple Zig-Zag FormationTriple Zig-Zag
It appears that AVAX has been forming a triple zig-zag correction on a high time frame. After further study of lower time frames, I have discovered smaller fractals of this correction of lower degrees. Price action is currently supported by the 1.272 pocket, which COULD lead to a reversal, but the1.618 (Wave "W" × 0.618) is a favored ratio above the 1.272 . However, there are crumbs on a lower time frame that suggest we may be experiencing another fractal of this structure.
On The 8-Hour Chart
An ABC correction has complete, and has price has become impulsive to the down side; the dominant trend has resumed. Price is currently in the Golden Window (0.618-0.786) retracement of wave B and in an area of high liquidity. Could this be a shakeout reversal pattern or continuation pattern? 👇👇👇
On the 1-Hour Chart
An exotic expanded running flat was printed that potentially marked wave 2 or B of a higher degree. Afterward came a 5 wave impulse down with a truncated 5th followed by an ABC to the upside. It's possible that we are in the middle of a zig zag correction and are waiting for confirmation of wave 2 of the potential 5 wave impulse down. An invalidation level would be @ $12.49 and would suggest that the high time frame triple zig zag may be complete at the 1.272 of wave "W". 👇👇👇
...if price action continues to the down side the 1.618 of wave A is a common area of retracement. The 1.272 ratio on the 1-Hour chart is also a potential retracement level, but less common than the 1.618.
This Publish Is Intended For Educational Purposes Only

BTC | DailyCRYPTOCAP:BTC — Transitional Phase
BTC is holding above Q-Structure λₛ support.
A ~9.5% further advance is required to confirm the Leading Diagonal as a transitional structure in Intermediate Wave (1), signalling a Primary-degree trend reversal.
Q-Structure λᵣ targets ➤ $100k via Minor Wave 5(near term).
🔖 This outlook is derived from insights within my Quantum Models framework. Within this methodology, Q-Targets represent high-probability scenarios generated by the confluence of equivalence lines. These Quantum Structures also serve as structural anchors, shaping the model's internal geometry and guiding the evolution of alternative paths as price action unfolds.
#BTC #Bitcoin #ElliottWave #QuantumModel #CryptoMarkets
#MarketStructure #TrendReversal
