XAUUSD Update Price still in the RangeAfter several attempts to break through 4270-4280 area, gold experienced rejection.
Currently, the price has the potential to return to the middle of its range.
BIGGER Range is between 3886 - 4385.
By observing these early symptoms, we can identify this as a consolidation area.
We need more time to be able to identify the current market structure.
Becareful when jump in and have a Blessing week ahead !
Wave Analysis

NEXT WEEK INSIGHTS [15-19TH DECEMBER]In this video, we break down what to expect from the upcoming week’s monetary-policy decisions, particularly from Federal Reserve (the Fed), and why it could matter for global markets, investors, and ordinary people alike. We analyze the most recent data — inflation, employment, bond yields — and explain the market’s growing anticipation that the Fed might announce a rate cut around mid-December. 📉
We also explore the potential ripple effects: how changes to interest rates could influence stock markets, borrowing costs, and economic growth. Plus — if the Fed does cut rates — what that could mean for everyday savers, borrowers, and investors.
Whether you’re a finance-savvy watcher or simply curious about what’s going on with global economics, this video aims to give you the facts in a clear, straightforward way — and show why the next few days could be pivotal.

GOLD – 4H Trendline Structure Analysis Trend OverviewGOLD – 4H Trendline Structure Analysis
Trend Overview
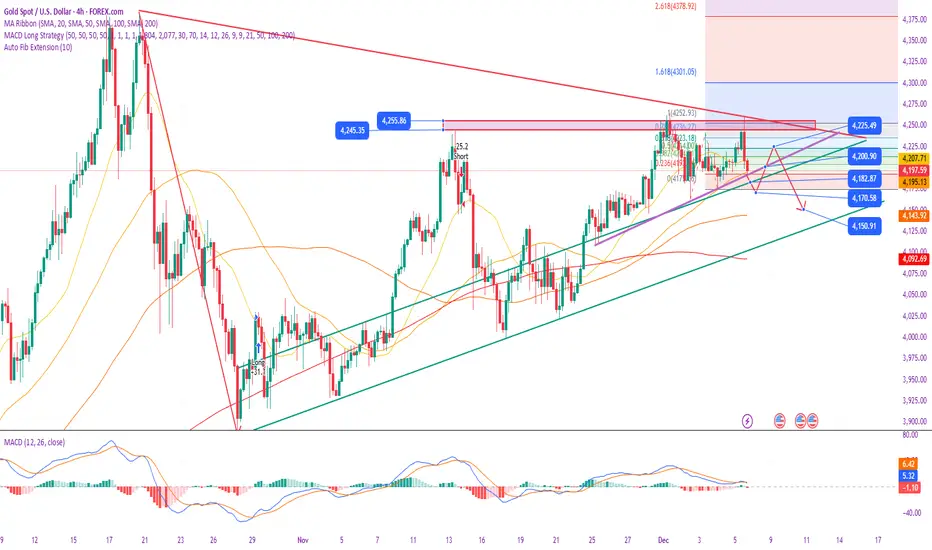
Gold is currently trapped between the green descending trendline (bearish pressure) and the red rising trendline (bullish support).
Price keeps bouncing inside this box, failing to break above the green trendline and repeatedly holding the white horizontal support.
This means:
Market is consolidating, preparing for a bigger breakout.
Momentum is slowly tilting bearish as long as the green trendline holds.
Key Levels
Resistance: 4253
Support: 4128 pivot
Local support box (white zone): 4170–4180
Red trendline: major bullish support — break = bearish continuation
Green trendline: major bearish resistance — rejection = correction
Expected Scenario (High Probability)
Your drawing is accurate — market is likely forming a lower-high pattern under the green trendline.
1️⃣ Move up → rejection at green trendline
Price tries to retest the green trendline (around 4230–4240)
→ Fails to break
→ Forms another lower high.
2️⃣ Drop back into the white support box
Price returns to 4170–4180.
3️⃣ Break of the white box → test red trendline
A clean 4H break and close below the white box will send price toward the red trendline.
4️⃣ Break of the red trendline = full bearish confirmation
If the red trendline breaks with confirmation, gold will likely slide toward:
First target: 4128
Next continuation level: 4080
Extended target: 4020 area
(Your white arrow projection matches this perfectly.)
Bias Summary
Bearish while below the green trendline.
Major bearish trigger = break below white zone + red trendline.
Bullish only resumes if price breaks and closes above 4253 — until then, upside is limited.

BTCUSD testing 4H FVG After hitting an OB with string bullish candle, BTC is looking for support in the 4H created FVG.

Gold Trading Strategy for Next Week:
Trading Strategy Report on Gold Price Movement for December 8th
Core Summary: This week, gold prices exhibited intense volatility, influenced by a confluence of multiple factors, with sensitive market sentiment leading to significantly amplified price swings. The current price is fluctuating repeatedly within a critical range, as the market focuses on the upcoming Federal Reserve interest rate decision for clearer directional cues.
I. Review of This Week's Market and Driving Factors
Price Action Overview
The week began with a rapid surge to $4,262 (the weekly high), followed by a swift pullback to $4,225.
Selling pressure intensified during Asian and European trading hours, pushing the gold price down to a low of $4,170 (the weekly low).
Extreme volatility occurred on Tuesday: a sharp rise of nearly $250 within 15 minutes, followed by a steep plunge triggered by profit-taking, reflecting deep market sensitivity and thin liquidity ahead of major events.
Prices surged again to $4,254 on Thursday, but concentrated selling after the North American market open led to a drop of over $50 within minutes.
Prices ultimately settled below $4,200 on Friday, approaching a crucial support zone.
Primary Influencing Factors
Trading Sentiment and Liquidity: Reduced year-end liquidity amplified price movements, and concentrated buy/sell orders triggered sharp fluctuations.
Fed Policy Expectations: Markets price in a high probability (87%) of a December rate cut, but disagreement exists regarding the cumulative extent of cuts (1-3 times) through 2026, with this uncertainty curbing aggressive bullish positions.
Key Event Preview: Significant internal divergence exists within the Fed regarding rate cuts (5 out of 12 members opposing or expressing doubts). The key driver will be Chair Powell's characterization of the move as "insurance cuts" versus the "start of an easing cycle."
Technical Level Contention: Gold failed in three attempts to sustain above $4,220, leading to a shift in market confidence and ongoing high-level tug-of-war.
II. Technical Analysis
Key Levels
Resistance Zones:
First Resistance: $4,220 - $4,230 (short-term trendline pressure)
Core Resistance: $4,255 - $4,260 (recent highs; maintain bearish view unless breached)
Support Zones:
First Support: $4,160 - $4,165 (ten-day moving average & key structural support)
Breakdown Support: $4,000 (potential test target if hawkish signals emerge)
Chart Patterns & Structure
Triangle Consolidation: Currently in a small triangular consolidation pattern. Watch for two potential developments:
Pennant continuation pattern (trend resumption)
Broad range-bound consolidation pattern (continued sideways movement)
Trendline Focus: A breach of the rising trendline could trigger bearish momentum; conversely, holding support suggests continued choppy pull-ups.
Bull-Bear Line
Short-term Pivot: $4,200. Holding effectively above suggests a bias toward a rebound; trading below indicates continued pressure.
III. Trading Strategy for the Coming Week
Overall Approach
Primary Strategy: Favor selling on rallies, with buying on dips as a secondary approach.
Core Logic: Market sentiment is cautious ahead of the Fed decision, with high volatility and price swings expected. Await key levels for high-probability entry opportunities.
Specific Tactics
Short Strategy (Sell on Strength)
Entry Zone: $4,220 - $4,230
Stop-Loss: Set at $4,230 - $4,240 (8-10 points)
Target Levels:
First Target: $4,200 - $4,180
Second Target: $4,160 (hold if breached)
Long Strategy (Buy on Weakness)
Entry Zone: $4,160 - $4,165
Stop-Loss: Set at $4,150 - $4,155 (8-10 points)
Target Levels:
First Target: $4,190 - $4,210
Second Target: $4,220 (hold if broken)
Risk Management Essentials
Position Sizing: Initiate with light positions; avoid heavy, concentrated bets.
Strict Stop-Losses: Every trade must have a stop-loss; do not average down on losses.
Event Avoidance: Liquidity may be abnormal around the Fed announcement. Consider reducing operations or scaling down position sizes.
IV. Key Events and Outlook
Focus Next Week: Federal Reserve Interest Rate Decision (December)
Watch Point 1: Number of dissenting votes (≥3 would indicate deepening internal division).
Watch Point 2: Tone of Chair Powell's press conference—distinguishing between "insurance cuts" and the "start of an easing cycle."
Scenario Analysis:
Dovish Signal: Clearer path for rate cuts → Gold may resume its upward trajectory, targeting $4,300+.
Hawkish Signal: Downplaying rate cut expectations → Gold could decline to test the $4,000 region for support.
Medium-Term Outlook
Conditions for Upside: Fed confirms an easing cycle + tame inflation data → Gold is expected to break out of the high consolidation range.
Downside Risks: Hawkish Fed decision + tightening liquidity + intensified profit-taking → Potential for a deeper correction towards $4,000 - $4,100.
PUMPUSDT = Time to buy?🐸 NYSE:PUMP #PumpFun ➖ Time to buy?
Chart (PUMPUSDT):
PUMP is down 72% from its all-time high. Looking at the liquidation map, this looks like a solid entry point to grab some PUMP for part of the portfolio with around +150% upside potential.
Take-profit target is $0.007 ➖ right where the biggest cluster of short liquidations sits.

EURUSD - SHORT#EURUSD
It was a tough analysis
The math equations overlap Sell and Buy
Breach level
1.1662
Enter with confirmation
Sell targets
1.1626
1.1615
1.1603 is the main target and
Maybe
1.1585

XAUUSD Analysis TodayXAUUSD Analysis Today – Key Levels, Liquidity Map and High-Probability Trading Plan
Gold is currently retracing after a clear fake breakout on the intraday structure, showing strong rejection from the extended premium zone. Price action on H1 reflects a shift from bullish exhaustion to short-term corrective movement, with liquidity sitting below the most recent swing low. Today’s session will likely revolve around sweeps, mitigation, and a return to discounted zones before any meaningful continuation.
1. Market Structure Overview
The H1 chart shows:
A completed ascending channel with a clear BOS followed by a liquidity sweep.
Price rejecting from the upper imbalance and returning toward equilibrium.
A notable Fake Breakout around 4214–4218 where liquidity was engineered before the sell-off.
The current decline is forming a corrective leg aimed toward the demand range.
This price behavior confirms a move into the BUY ZONE 4168–4186, aligning with Fibonacci retracement and trendline confluence.
2. Important Support & Resistance Levels
Key Resistance
4252–4257: Major supply and premium zone, strong rejection expected on first touch.
4220–4225: Reaction zone where the fake breakout occurred; a retest here may create another liquidity hunt.
Key Support
4201–4208: First reaction demand zone, shallow pullback potential.
4186–4174: Deep discount area, Fibonacci confluence, major BUY ZONE.
4168: Strong low protected by higher-timeframe liquidity.
3. Indicator Confluence
EMA Cluster (20/50/100) is compressing downward, confirming short-term correction.
RSI shows no bullish divergence yet, meaning the sweep of liquidity is still incomplete.
Fibonacci 61.8–78.6% aligns with the 4174–4168 zone, increasing probability of bullish reversal.
4. Expected Price Behavior Today
Scenario A (High Probability):
Price continues toward 4174–4168, sweeps liquidity, then forms a bullish CHoCH on lower timeframe before aiming for 4208 → 4220 → 4252.
Scenario B (Moderate Probability):
Price rejects early at 4201, retraces into 4220 supply, then drops again to deeper levels before reversing.
Scenario C (Low Probability):
Immediate bullish break above 4225 without retesting deeper zones.
5. Trading Strategy (High-Probability Setups)
Buy Strategy – Preferred Setup
Entry: 4174–4168 (Fibonacci + strong demand)
Stop Loss: Below 4160
Take Profit:
TP1: 4208
TP2: 4220
TP3: 4252–4257
This zone is optimal due to liquidity, trendline tap, and deep retracement discount.
Sell Strategy – Counter-trend Short
Entry: 4220–4225 (fake breakout zone retest)
SL: Above 4232
TP: 4205 → 4186
This trade targets the inevitable sweep to the BUY ZONE.
6. Summary
Gold is in a short-term corrective phase inside a larger bullish macro sentiment. Key liquidity remains below, and the most effective strategy today is waiting for deeper discount zones before looking for strong buys.

GOLD Is Very Bearish! Sell!
Please, check our technical outlook for GOLD.
Time Frame: 9h
Current Trend: Bearish
Sentiment: Overbought (based on 7-period RSI)
Forecast: Bearish
The market is approaching a key horizontal level 4,198.77.
Considering the today's price action, probabilities will be high to see a movement to 4,117.75.
P.S
Please, note that an oversold/overbought condition can last for a long time, and therefore being oversold/overbought doesn't mean a price rally will come soon, or at all.
Like and subscribe and comment my ideas if you enjoy them!

EURUSD Is Going Down! Sell!
Here is our detailed technical review for EURUSD.
Time Frame: 8h
Current Trend: Bearish
Sentiment: Overbought (based on 7-period RSI)
Forecast: Bearish
The market is approaching a significant resistance area 1.164.
Due to the fact that we see a positive bearish reaction from the underlined area, I strongly believe that sellers will manage to push the price all the way down to 1.160 level.
P.S
The term oversold refers to a condition where an asset has traded lower in price and has the potential for a price bounce.
Overbought refers to market scenarios where the instrument is traded considerably higher than its fair value. Overvaluation is caused by market sentiments when there is positive news.
Like and subscribe and comment my ideas if you enjoy them!


$BTCUSD: we may be in Wave B rallyBITSTAMP:BTCUSD : we can count 5 waves from the 2022 bear market low. It looks to me we could have bottomed or $80.5K is A of ABC and we're in Wave B.
A itself is an expanded flat. Wave c = 2.618% Wave a, which is a good target for this leg to bottom. If this is just A of ABC and not the entire ABC, then CRYPTOCAP:BTC would have another leg down to perhaps the yellow trendline ($78K-ish) after a relief rally.
Either way, I expect $80.5K to hold for now and BTC continues the up move to either finish Wave B up or to resume the uptrend.

USOIL BEST PLACE TO SELL FROM|SHORT
USOIL SIGNAL
Trade Direction: short
Entry Level: 60.11
Target Level: 57.09
Stop Loss: 62.12
RISK PROFILE
Risk level: medium
Suggested risk: 1%
Timeframe: 1D
Disclosure: I am part of Trade Nation's Influencer program and receive a monthly fee for using their TradingView charts in my analysis.
✅LIKE AND COMMENT MY IDEAS✅

NZD/CAD BULLS ARE STRONG HERE|LONG
Hello, Friends!
The BB lower band is nearby so NZD-CAD is in the oversold territory. Thus, despite the downtrend on the 1W timeframe I think that we will see a bullish reaction from the support line below and a move up towards the target at around 0.802.
Disclosure: I am part of Trade Nation's Influencer program and receive a monthly fee for using their TradingView charts in my analysis.
✅LIKE AND COMMENT MY IDEAS✅

AUD/CAD LONG FROM SUPPORT
Hello, Friends!
Bullish trend on AUD/CAD, defined by the green colour of the last week candle combined with the fact the pair is oversold based on the BB lower band proximity, makes me expect a bullish rebound from the support line below and a retest of the local target above at 0.921.
Disclosure: I am part of Trade Nation's Influencer program and receive a monthly fee for using their TradingView charts in my analysis.
✅LIKE AND COMMENT MY IDEAS✅

GBP/CAD BEST PLACE TO SELL FROM|SHORT
GBP/CAD SIGNAL
Trade Direction: short
Entry Level: 1.864
Target Level: 1.855
Stop Loss: 1.871
RISK PROFILE
Risk level: medium
Suggested risk: 1%
Timeframe: 1h
Disclosure: I am part of Trade Nation's Influencer program and receive a monthly fee for using their TradingView charts in my analysis.
✅LIKE AND COMMENT MY IDEAS✅

BITCOIN BEARISH BIAS RIGHT NOW| SHORT
Hello, Friends!
BITCOIN pair is trading in a local downtrend which know by looking at the previous 1W candle which is red. On the 4H timeframe the pair is going up. The pair is overbought because the price is close to the upper band of the BB indicator. So we are looking to sell the pair with the upper BB line acting as resistance. The next target is 89,196.10 area.
Disclosure: I am part of Trade Nation's Influencer program and receive a monthly fee for using their TradingView charts in my analysis.
✅LIKE AND COMMENT MY IDEAS✅

CHF/JPY BUYERS WILL DOMINATE THE MARKET|LONG
CHF/JPY SIGNAL
Trade Direction: long
Entry Level: 192.579
Target Level: 193.023
Stop Loss: 192.284
RISK PROFILE
Risk level: medium
Suggested risk: 1%
Timeframe: 1h
Disclosure: I am part of Trade Nation's Influencer program and receive a monthly fee for using their TradingView charts in my analysis.
✅LIKE AND COMMENT MY IDEAS✅

CAD/JPY BULLS ARE GAINING STRENGTH|LONG
Hello,Friends!
CAD/JPY pair is in the uptrend because previous week’s candle is green, while the price is obviously falling on the 4H timeframe. And after the retest of the support line below I believe we will see a move up towards the target above at 111.532 because the pair is oversold due to its proximity to the lower BB band and a bullish correction is likely.
Disclosure: I am part of Trade Nation's Influencer program and receive a monthly fee for using their TradingView charts in my analysis.
✅LIKE AND COMMENT MY IDEAS✅

XAUUSD - SELLER MOVE IN The chart shows my view of the next move. Market direction depends on holding this zone.

How Trade Shapes Global Currency1. The Basic Mechanism: Supply and Demand in Currency Markets
At its core, currency value is influenced by supply and demand. International trade directly affects this supply-demand dynamic. When a country exports goods and services, foreign buyers need to purchase its currency to pay for these exports. For instance, if the United States exports machinery to Germany, German importers must buy U.S. dollars (USD) to complete the transaction. This demand for USD increases its value relative to the euro (EUR). Conversely, when a country imports goods and services, it needs foreign currency to pay overseas suppliers, which can increase the supply of its own currency in the global market, potentially causing depreciation.
Trade, therefore, is a continuous flow of currency exchange. Countries with strong export-oriented economies often see their currencies strengthen, whereas nations with large import bills may experience downward pressure on their currency unless offset by foreign investment or other capital inflows.
2. Trade Balances: Surplus and Deficit
A critical concept in understanding currency dynamics is the trade balance — the difference between a country’s exports and imports. A trade surplus occurs when exports exceed imports, meaning foreign buyers are consistently demanding more of the country’s currency. This sustained demand strengthens the domestic currency. For example, China has historically maintained trade surpluses, contributing to the upward pressure on the yuan.
Conversely, a trade deficit happens when a country imports more than it exports. This scenario increases the domestic currency supply in the foreign exchange market, potentially weakening it. The United States, which often runs trade deficits, relies on capital inflows and investment from abroad to offset this pressure. Persistent trade deficits can lead to concerns about a currency’s long-term value, influencing both foreign exchange markets and domestic economic policy.
3. Currency and Competitiveness
Trade also affects currencies through competitiveness. A weaker currency makes a country’s exports cheaper and more attractive to foreign buyers, stimulating export growth. Conversely, a stronger currency can make imports cheaper, benefiting consumers but potentially harming domestic exporters. Central banks sometimes intervene in currency markets to maintain trade competitiveness. For instance, Japan has historically intervened to prevent excessive appreciation of the yen, which could harm its export-driven economy.
4. Capital Flows and Trade-Related Investment
Trade flows often create parallel capital flows. Companies engaged in international trade may invest in foreign markets to streamline supply chains, leading to cross-border investments. These capital movements can reinforce currency trends created by trade. For example, if a European company invests heavily in the United States, it must convert euros into dollars, creating additional demand for USD and supporting its value. Therefore, trade indirectly stimulates currency movement through associated foreign direct investment (FDI) and portfolio flows.
5. Global Reserve Currencies
Trade patterns also shape the global status of currencies. The U.S. dollar, euro, and Japanese yen are widely used as reserve currencies, largely due to historical trade dominance and economic stability. Countries conducting significant trade in dollars tend to hold large USD reserves to facilitate international payments. This demand for reserve currencies reinforces their global value and liquidity. The dominance of reserve currencies can influence global trade, as nations often price commodities like oil and metals in major currencies, creating a feedback loop between trade and currency value.
6. Trade Policies and Currency Volatility
Trade policies such as tariffs, quotas, and trade agreements can directly impact currency values. Protectionist measures, like high tariffs on imports, can reduce trade volumes, affecting currency demand. For example, if the U.S. imposes tariffs on Chinese goods, demand for Chinese yuan may decline because fewer U.S. businesses need it to pay for imports. Similarly, trade agreements that boost cross-border commerce can enhance currency stability by creating predictable demand patterns. Investors monitor trade negotiations closely because even rumors can trigger significant currency volatility.
7. Exchange Rates and Global Competitiveness
Currencies are also shaped by the relative strength of trading partners. A country’s trade performance depends not just on domestic policies but also on the economic health and currency strength of its partners. For instance, a slowdown in the European economy can reduce demand for Asian exports, weakening the currencies of export-dependent Asian nations. Moreover, countries sometimes engage in competitive devaluation, deliberately weakening their currency to boost export competitiveness, which can trigger a cycle of trade-related currency adjustments globally.
8. The Role of Speculation
Finally, trade expectations drive currency speculation. Traders in the foreign exchange market closely monitor trade data, such as import/export volumes, trade deficits, and agreements, to anticipate currency movements. If a nation reports a record trade surplus, traders may buy its currency in anticipation of appreciation. Conversely, unexpected trade deficits or disruptions can trigger rapid selling, causing currency depreciation. Speculation based on trade data can amplify currency swings beyond what actual trade flows would dictate, illustrating the psychological dimension of trade-driven currency movements.
9. Long-Term Implications
Over the long term, sustained trade patterns shape economic strategy and currency policy. Export-oriented economies often maintain strong currencies, invest in industrial capacity, and manage reserves to stabilize exchange rates. Import-reliant nations may adopt measures to attract foreign investment to support their currency. Global trade imbalances can also lead to currency realignments, with under- or overvalued currencies influencing global competitiveness and economic growth. For instance, the rise of China as a global exporter has significantly influenced the valuation of the yuan, affecting trade flows worldwide.
Conclusion
In essence, trade shapes global currencies through a complex interplay of supply-demand dynamics, trade balances, competitiveness, capital flows, policy decisions, and market expectations. Exports drive demand for a country’s currency, imports increase its supply, and trade policies and agreements can amplify or moderate these effects. The interconnected nature of the global economy means that a change in trade patterns in one region can reverberate across multiple currencies. As global trade continues to evolve, currencies will remain both indicators and drivers of economic performance, reflecting the intricate relationship between commerce and financial markets. Understanding this relationship is crucial for governments, businesses, and investors seeking to navigate the ever-changing landscape of global trade and currency markets.

BTCUSD – Support Flip Failure | Major Sell Zone ActivatedBTCUSD – Support Flip Failure & Bearish Liquidity Trap Setup
Price recently broke below the major intraday support zone, confirming weakness after multiple failed attempts to hold the structure. The market is now trading inside a retest phase, where price is likely to pull back toward the previous support (now turned resistance).
The zone between 92,200 – 93,500 is my SELL ZONE, where liquidity is sitting and buyers appear weak. If price taps this area with slow momentum (weak health), I expect sellers to regain control.
After the retest, BTC may continue its bearish leg toward the next major demand zone, highlighted as the TARGET area, aligned with a strong historical support region.

Forex Trading Secrets: Unlocking Success in the Currency Market1. Understanding the Forex Market
The first secret of Forex trading is understanding how the market works. Unlike stock markets, Forex is decentralized, meaning it does not have a central exchange. Currency pairs, such as EUR/USD or GBP/JPY, are traded in over-the-counter (OTC) markets through banks, brokers, and electronic platforms. Prices are influenced by multiple factors, including:
Economic indicators: GDP, inflation, unemployment, and trade balances.
Central bank policies: Interest rates and quantitative easing programs.
Geopolitical events: Elections, wars, and treaties can cause currency volatility.
Market sentiment: Traders’ collective emotions, risk appetite, and speculation.
Understanding these factors allows traders to anticipate market moves rather than react impulsively.
2. The Power of Technical Analysis
While fundamental analysis focuses on economic data, technical analysis is a cornerstone of Forex trading. It involves analyzing historical price charts to predict future movements. Key techniques include:
Support and Resistance: Identifying price levels where the market tends to reverse or consolidate. Trading near these zones increases the probability of success.
Trendlines and Channels: Recognizing the direction of the market (uptrend, downtrend, sideways) helps traders align their positions with the trend.
Candlestick Patterns: Certain formations like Doji, Hammer, or Engulfing patterns can signal potential reversals or continuations.
Indicators: Tools like Moving Averages, RSI (Relative Strength Index), MACD (Moving Average Convergence Divergence), and Bollinger Bands provide insight into momentum, volatility, and trend strength.
Professional traders often combine multiple indicators with price action to increase accuracy and reduce false signals.
3. Fundamental Analysis Secrets
While technical analysis is about patterns, fundamental analysis focuses on economic reality. Understanding the macroeconomic environment can give traders a long-term edge. Key secrets include:
Interest Rate Differentials: Currencies from countries with higher interest rates often strengthen as investors seek higher returns.
Economic Reports: Monitoring scheduled releases like Non-Farm Payrolls (NFP), CPI, and PMI can create predictable short-term volatility.
Political Stability: Elections, reforms, and geopolitical tensions significantly influence currency strength.
Correlation Awareness: Some currencies move in tandem (EUR/USD and GBP/USD), while others move inversely (USD/CHF vs EUR/USD). Knowing these correlations helps manage risk and hedge positions effectively.
By combining technical and fundamental insights, traders can identify high-probability trades.
4. Risk Management: The Hidden Secret
Perhaps the most overlooked “secret” of Forex trading is risk management. Even the most accurate strategies fail without proper risk control. Key rules include:
Never risk more than 1–2% of your trading capital per trade. This protects your account from large losses and allows survival in drawdown periods.
Use Stop-Loss Orders: Predetermine your exit point to limit losses. This prevents emotional decision-making.
Position Sizing: Adjust your lot size based on volatility and account size. Bigger trades do not equal bigger profits if risk is unmanaged.
Avoid Overleveraging: Forex brokers offer leverage, often up to 500:1. While tempting, excessive leverage can wipe out accounts within minutes.
Risk management transforms trading from gambling into a disciplined, professional practice.
5. The Psychological Edge
Trading is more psychological than technical. Many beginners fail due to emotional reactions such as fear, greed, and revenge trading. Secrets to mastering your mind include:
Discipline: Stick to your trading plan regardless of market noise.
Patience: Wait for setups that meet your criteria; avoid impulsive trades.
Emotional Detachment: Treat each trade as a business decision, not a personal victory or loss.
Consistency: Develop routines for analysis, journaling trades, and reviewing performance. Over time, consistent behavior compounds into better results.
Top traders often say that mastering your emotions is harder than mastering charts.
6. Trading Strategies that Work
While there is no single “holy grail” strategy, several proven methods increase winning probabilities:
Trend Following: Enter trades in the direction of the prevailing trend. Use moving averages or trendlines to confirm trends.
Breakout Trading: Trade price breakouts from key support or resistance levels. Confirm with volume or volatility indicators.
Range Trading: When markets are consolidating, buy at support and sell at resistance, using oscillators like RSI to identify overbought/oversold conditions.
Carry Trading: Exploit interest rate differentials by holding a higher-yielding currency against a lower-yielding one.
Each strategy requires discipline, testing, and adaptation to changing market conditions.
7. Secrets of Successful Forex Traders
Professional traders share certain habits that differentiate them from amateurs:
Journaling Trades: Keeping detailed records of every trade, including reasoning, results, and emotions.
Continuous Learning: Markets evolve; successful traders stay updated with news, economic changes, and new strategies.
Backtesting and Demo Trading: Testing strategies on historical data before risking real money is crucial.
Adapting to Market Conditions: Strategies that work in trending markets may fail in sideways markets. Flexibility is key.
These habits, combined with technical, fundamental, and psychological mastery, form the backbone of consistent Forex trading.
8. Advanced Tips and Hidden Secrets
Correlation and Diversification: Don’t concentrate all trades on one currency. Use uncorrelated pairs to reduce risk.
Understanding Market Liquidity: Major pairs (EUR/USD, USD/JPY) are more liquid and predictable than exotic pairs. Liquidity affects slippage and spread costs.
News Trading: Experienced traders exploit scheduled economic releases for short-term volatility. However, this requires speed and risk control.
Algorithmic Trading: Some traders use automated systems to remove emotions from trading, though these require careful design and monitoring.
The real “secret” is that Forex trading is a skill, not luck. Consistency and discipline beat random wins.
Conclusion
Forex trading can be highly profitable, but success comes from understanding the market, mastering technical and fundamental analysis, controlling risk, and cultivating psychological resilience. The true “secrets” are not hidden formulas or magic indicators—they are disciplined habits, strategic planning, and continuous learning. Traders who adopt these practices can transform Forex trading from a gamble into a sustainable career or supplementary income stream.
By combining these insights, one can develop a structured trading approach that maximizes opportunities while minimizing risks—a balance that separates successful traders from the rest.