Second triangle. Wave 4 still in playWe see a second triangle forming which means that wave 4 is still in play.
Wave Analysis

GMT/USDT — Downtrend Exhaustion | DCA Zone for Recovery PhaseGMT/USDT has been locked in a prolonged and aggressive downtrend, a phase that typically ends with seller exhaustion and weak-hand capitulation. Current price behavior suggests that this bearish cycle is approaching completion, with the market preparing to transition into a recovery phase.
From a risk-to-reward perspective, this area offers a favorable accumulation opportunity rather than a chase.

BTCUSD 2H | Liquidity Sweep Completed – Bullish Continuation AftBy analyzing the #BTCUSD chart on the 2H timeframe, we can observe that after maintaining a strong bullish structure, Bitcoin impulsively pushed higher and successfully reached into the $94,500 – $94,800 region, where price reacted from a clear liquidity and supply zone marked on the chart.
Following this aggressive upside move, BTC is now showing signs of short-term exhaustion, with price rejecting from the highs and entering a corrective phase. The market is currently trading around the $90,500 – $91,000 region, where we can see consolidation and minor range formation, indicating temporary balance after the impulse.
This price behavior suggests that liquidity above has already been swept, and the market is now looking to rebalance before the next directional move. As highlighted on the chart, BTC may continue to range between $90,000 – $90,200, building a base before attempting a recovery.
If price holds above the $90,000 support zone, a bullish continuation is expected, with upside targets around $91,700 followed by $93,000 – $93,100, aligning with previous structure highs and unfilled liquidity.
However, a clean breakdown below $90,000 could open the door for a deeper pullback toward lower demand zones before continuation. As long as price remains above the major demand area near $86,500 – $87,000, the overall market structure remains bullish, and any downside move should be considered corrective rather than a trend reversal.
This analysis will be updated as price reacts at the highlighted levels.
Please support me with your likes and comments to motivate me to share more high-quality analysis, and feel free to share your view on whether Bitcoin will continue higher after this consolidation or revisit lower support zones.

XAUUSD 1H – Friday Trade IdeaPrice is showing higher lows after a strong rejection from demand, indicating short-term bullish momentum.
Current plan:
Buy on pullback / continuation
Risk is defined below the recent structure low
Target set at the prior resistance / liquidity zone
Expect minor pullbacks before continuation higher (normal price behavior)
This is a structure + price action setup, not indicator-based.
The goal is clean execution with controlled risk, not prediction.
📌 If price fails to hold above the demand, setup is invalid — no trade.
🤝 Trade With Me (Side-by-Side or Managed)
For traders who want real execution experience, I offer two options:
• Trade side-by-side with me
– Same bias
– Same structure
– Full explanation before execution
• Account trading / management
– Strict risk management
– No overtrading
– Capital protection comes first
This is for people who:
✔️ Want consistency, not signals
✔️ Value risk control
✔️ Want to learn by watching real trades, not hindsight
📌 This is not financial advice. Education & experience focused.
👍 Follow for structured Gold breakdowns
💬 Comment or message if you’re interested in trading together
Discipline > Emotion.
Structure > Indicators.

GoldXAUUSD
- Completed " 1234 " Impulsive Waves
- Fibonacci Level - 50.00%
- Change of Characteristics
- S / R Level
- Bullish Channel as an corrective pattern in Long Time Frame

$TLRY after-hours after earnings tradeNASDAQ:TLRY — Bought some in the after-hours after earnings. Tilray did just beat on revenue and the chart looks constructive. Sitting near the lower end of the range with a double bottom, which makes this a good trade even without strong earnings.
Stop: $9 should hold. Target don't know yet need to asses strength first.

AUDCAD Intraday Rebound Above 0.9269 – Targets 0.9301 & 0.9309Market: AUD/CAD (Australian Dollar vs Canadian Dollar)
Timeframe: Intraday (M15–M30)
Bias: Rebound / Short-term recovery
🔍 Analysis
AUD/CAD is trading near a strong pivot support at 0.9269 after a recent pullback.
Price is showing signs of stabilization, and this area may act as a base for a technical rebound.
As long as price holds above 0.9269, a move toward higher resistance levels remains possible.
🎯 Key Levels
Support / Pivot: 0.9269
Resistance 1: 0.9301
Resistance 2: 0.9309
Upper Resistance: 0.9317
📈 Trading View (Educational)
Rebound bias only above 0.9269
Watch for bullish reaction near support
A clear break below 0.9269 may invalidate this rebound idea
This setup is based on intraday price action and key technical levels.
⚠️ Risk Management
Always use proper risk management and stop-loss.
Avoid over-trading in low-momentum sessions.
📝 Disclaimer
This analysis is for educational purposes only and not financial advice.
Forex trading involves risk, and market conditions can change quickly.
You are fully responsible for your own trading decisions.
OANDA:AUDCAD GETTEX:AUD LSE:CAD CRYPTOCAP:FOREX $INTRADAY $PRICEACTION $SUPPORTRESISTANCE $TRADINGVIEW

GBPUSD: Growth & Bullish Forecast
Balance of buyers and sellers on the GBPUSD pair, that is best felt when all the timeframes are analyzed properly is shifting in favor of the buyers, therefore is it only natural that we go long on the pair.
Disclosure: I am part of Trade Nation's Influencer program and receive a monthly fee for using their TradingView charts in my analysis.
❤️ Please, support our work with like & comment! ❤️

#VET/USDT – Falling Wedge Breakout?#VET
The price is moving in a descending channel on the 1-hour timeframe. It has reached the upper limit and is heading towards breaking downwards, with a retest of the upper limit expected.
We have an upward trend on the RSI indicator, which has reached near the upper limit, and a downward reversal is expected.
There is a major resistance zone in green at 0.01300. The price has bounced from this zone multiple times and is expected to bounce again.
We have a trend of consolidation above the 100-period moving average, as we are moving close to it, which supports a downward move towards touching it.
Entry price: 0.01172
First target: 0.01150
Second target: 0.01122
Third target: 0.01080
Stop loss: Above the resistance zone in green.
Don't forget a simple thing: money management.
For inquiries, please leave a comment.
Thank you.

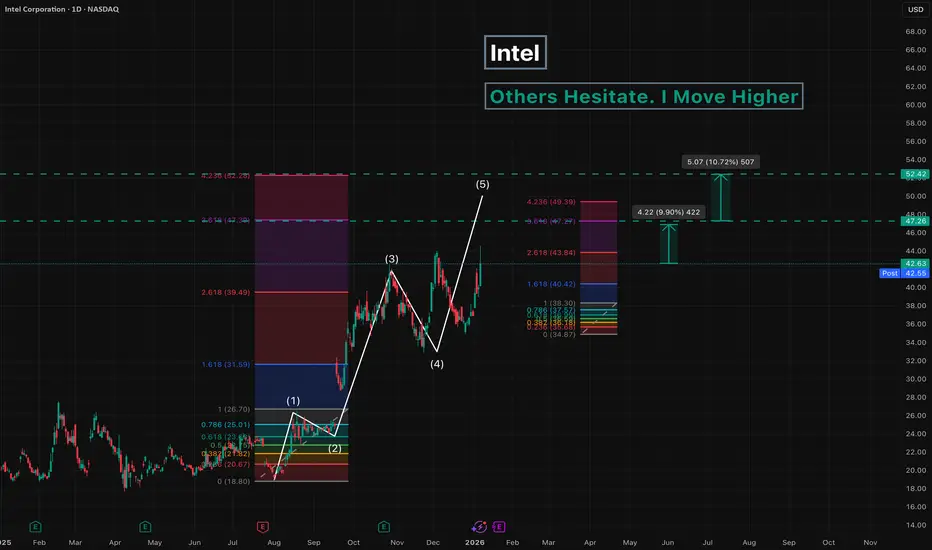
Intel - Others Hesitate. I Move HigherSince August 2025, Intel has been in an uptrend.
Only the final fifth wave remains to be completed.
The upside potential is estimated at 10-23% .
Key targets:
47
52
---
Please subscribe and leave a comment.
You’ll get new information faster than anyone else.
---
GBPUSD 1H Technical Analysis TodayGBPUSD 1H Technical Analysis Today: Strong Low Defense, Fibonacci Retracement Rally, EMA Resistance, Key Supply Zone at 1.3500
GBPUSD on the 1H chart has printed a clear bearish displacement from the 1.3560 area and is now trading at a locally important “strong low” zone around 1.3410–1.3420. This is a classic location where price can pause and produce a corrective bounce. However, the broader structure remains bearish while price stays below the reclaimed supply block near 1.3495–1.3505 and under the descending EMA stack.
Today’s highest-probability plan is to treat any rebound as a Fibonacci retracement rally into resistance, then look for rejection to resume the downtrend.
Market Structure (1H): Bearish Continuation, Bounce Potential from Strong Low
Price rejected from the prior upside expansion and delivered a sharp selloff, confirming bearish control.
The most recent leg has pushed into a “strong low” area, where liquidity is likely resting.
The chart projection aligns with a common sequence: sweep/defend the low → corrective bounce → retest supply/EMA → continuation lower.
Bias:
Intraday: corrective bullish bounce possible from 1.3410–1.3420
Structural: bearish until 1.3495–1.3505 is reclaimed and holds as support
EMA Read: Dynamic Resistance Above Price
Your EMA cluster is stacked above current price (roughly 1.3430–1.3465 on the right scale), which typically means:
Any rally into EMAs is a “sell-the-rally” area in a bearish phase.
A true shift requires a clean 1H close above the EMA band and then a successful retest.
Key EMA resistance references from the scale:
1.3432–1.3449 (near-term EMA pressure)
1.3463–1.3466 (higher EMA barrier before the main supply zone)
Fibonacci Retracement Map (Swing High → Swing Low)
Using the most recent downswing (approximately 1.3560 down to 1.3413), the retracement levels align tightly with your EMA and supply zone:
38.2%: ~1.3469
50%: ~1.3486
61.8%: ~1.3504
This creates a high-quality resistance band:
1.3469 → 1.3486 → 1.3504
If price rallies into this zone and fails, it often signals continuation lower.
Key Support and Resistance Levels
Support (Demand)
1.3410–1.3420: strong low and immediate decision zone
1.3380: next downside objective if the low breaks
1.3366 area: deeper demand pocket (grey zone), last defense before broader weakness
Resistance (Supply)
1.3432–1.3440: first reaction zone on a bounce
1.3449: intraday resistance (EMA overlap)
1.3463–1.3466: higher EMA barrier
1.3495–1.3505: major supply zone (key level to watch)
1.3520: higher supply band
1.3560: weak high liquidity above
RSI Framework (How to Filter Trades)
Even without the RSI panel visible, the current sequence strongly suggests:
RSI likely spent time below 50 during the selloff, confirming bearish momentum.
For longs: prefer RSI reclaiming 50 during the bounce and holding it on pullbacks.
For shorts: best entries often appear when RSI fails near 50 while price tags Fibonacci + EMA resistance.
RSI should be used as confirmation, not the primary trigger.
Trading Strategies for Today (Clean Execution Plans)
Plan A: Buy the Bounce From the Strong Low (Short-Term Correction)
This is a tactical counter-move, not a trend reversal.
Entry Logic:
Look for bullish rejection or a minor CHoCH up on 5m/15m after defending 1.3410–1.3420.
Targets:
TP1: 1.3432–1.3440
TP2: 1.3449
TP3: 1.3463–1.3469 (Fibo 38.2%)
Invalidation:
A strong 1H close below 1.3410, opening the path to 1.3380 then 1.3366.
Plan B: Sell the Retracement Rally Into Fibonacci + EMA + Supply (Preferred Setup)
This is the higher-probability setup aligned with the broader structure.
Sell Zones:
1.3469–1.3486 (Fibo 38.2–50%) if price shows weakness
1.3495–1.3505 (major supply + Fibo 61.8%) is the premium short area
Confirmation Triggers:
Rejection wick + bearish close on 15m/1H
Lower high formation under the supply zone
RSI fails to hold above 50 during the rally
Targets:
TP1: 1.3449
TP2: 1.3432
TP3: 1.3410–1.3420 (retest of lows)
Extension: 1.3380 → 1.3366 if breakdown confirms
Invalidation:
Sustained 1H acceptance above 1.3505 and a successful retest holding the zone as support.
Plan C: Bullish Reversal Only If Supply Flips to Support
A real reversal requires confirmation, not hope.
Trigger:
1H close above 1.3505, then a clean retest holding 1.3495–1.3505 as support.
Targets:
1.3520 then 1.3560
Failure Signal:
Break above 1.3505 followed by immediate rejection back below the zone.
Summary
GBPUSD is bearish structurally, but sitting at a strong low where a corrective bounce is reasonable.
The key battlefield is 1.3469–1.3505 (Fibonacci + EMA + supply). If price rejects there, continuation down becomes the primary path.
If 1.3410 fails, downside opens toward 1.3380 and potentially the 1.3366 demand pocket.

50% and more with BONK!!!!!Recent uptrend from Jan 1-5 could replicate in the following days, making a new high up to 0.00001582 (Green Arrow) or slowly building it up for a couple of days (Yellow Arrow) like what happened in April 2025 due to same angle of trend. In long-term, investors should be looking forward to the peak at 0.00002411.

$SPY & $SPX Scenarios — Friday, Jan 9, 2026🔮 AMEX:SPY & SP:SPX Scenarios — Friday, Jan 9, 2026 🔮
🌍 Market-Moving Headlines
• 🚨 Jobs Day: Payrolls, unemployment, and wages hit together — the single most important macro catalyst of the week.
• Labor cooling vs resilience: Markets assess whether hiring strength holds without reigniting wage pressure.
• Rates and risk reset: Payrolls outcome will drive front-end yields, equity multiples, and January positioning.
• Housing check: Starts and permits add context on rate sensitivity in real economy demand.
📊 Key Data & Events (ET)
8 30 AM — Labor and Housing
• U.S. Employment Report Dec: 73,000
• Unemployment Rate Dec: 4.5 percent
• Hourly Wages Dec: 0.3 percent
• Hourly Wages Year over Year: 3.6 percent
• Housing Starts Oct: 1.33 million
• Building Permits Oct: 1.34 million
10 00 AM
• UMich Consumer Sentiment Jan: 53.4
⚠️ Disclaimer: For informational use only — not financial advice.
📌 #SPY #SPX #JobsReport #NFP #wages #labor #macro #markets #trading

EURJPY: Great Trading Opportunity
EURJPY
- Classic bullish setup
- Our team expects bullish continuation
SUGGESTED TRADE:
Swing Trade
Long EURJPY
Entry Point - 182.73
Stop Loss - 182.60
Take Profit - 182.95
Our Risk - 1%
Start protection of your profits from lower levels
Disclosure: I am part of Trade Nation's Influencer program and receive a monthly fee for using their TradingView charts in my analysis.
❤️ Please, support our work with like & comment! ❤️

AUDUSDYou can consider buying right here or at lower levels and at a time when there is confirmation.

NLDN | SOLUSDT PERPETUAL SPECULATION SHORTAsset Pair: SOL/USDT (Solana) on the Binance Perpetual Futures instrument.
Timeframe: 1D (Daily), showing price movement from late 2025 to early January 2026.
Current Price Condition: The price is around 134.10 USDT. It appears the price has just touched the resistance zone (orange box) around 139.27 and experienced rejection.
Technical Analysis:
Supply Zone (Orange): The area between 139 and 145 is a fairly strong selling zone, where the price has often held up in the past.
This indicates expectations of a price decline after failing to break through the upper resistance.
Sentiment: The short-term trend appears to be testing the strength of sellers in the upper area. If the price fails to hold above 134, there is potential for a move towards the psychological level of 120 or the lower target of 113.

#DOGE/USDT is about to blast off! Study internet bubble stocks#DOGE
The price is moving in a descending channel on the 1-hour timeframe. It has reached the upper limit and is heading towards breaking downwards, with a retest of the upper limit expected.
We have an upward trend on the RSI indicator, which has reached near the upper limit, and a downward reversal is expected.
There is a major resistance zone in green at 0.1546. The price has bounced from this zone multiple times and is expected to bounce again.
We have a trend of consolidation above the 100-period moving average, as we are moving close to it, which supports a downward move towards touching it.
Entry price: 0.1420
First target: 0.1395
Second target: 0.1355
Third target: 0.1307
Stop loss: Above the resistance zone in green.
Don't forget a simple thing: capital management.
For inquiries, please leave a comment.
Thank you.

EUR/USD SENDS CLEAR BULLISH SIGNALS|LONG
Hello, Friends!
EUR/USD is making a bearish pullback on the 4H TF and is nearing the support line below while we are generally bullish biased on the pair due to our previous 1W candle analysis, thus making a trend-following long a good option for us with the target being the 1.167 level.
Disclosure: I am part of Trade Nation's Influencer program and receive a monthly fee for using their TradingView charts in my analysis.
✅LIKE AND COMMENT MY IDEAS✅

Market forecast for 2026!⭐Good afternoon! Happy New Year to all!⭐
1. The bit is not falling to 63k:
- onchain metrics already show a reversal
- one of my indicators shows that we will not come to the value of 63k, as I have already said, this is ironclad!
- the bit is the first target of 135 local, globally waiting for 260k. - Also, my indicator shows the beginning of an upward impulse in March!
2. The alt market and timings
🙂Q1 (Jan-Mar): Awakening → Growth → Institutional Entry
🤑Q2 (Apr-Jun): Recognition → Euphoria → Local Peak
🥳Q3 (Jul-Aug): Transition → Accumulation → Preparation
😎Q4 (Sep-Nov): Corporate Events → Control → MAXIMUM
🎄December: Celebration → Cycle Closure
3. Market capitalization of 7-8 trillion $
4. Ethereum 12k $
Good Luck to everyone!
Hugged everyone, Your Panda!
All indicators used in the analysis are proprietary.
🌊 Elliott Wave Master Pro -
🔮Impulse Oracle - Prediction -
🚀Crypto Market Cycle Detector (It will show you in advance when the altcoin season will start)-

EURUSD 1H AnalysisEURUSD 1H Analysis – Bear Trend Intact, Trading the Rebound vs Breakdown (EMA + Fibonacci + RSI)
EURUSD on the 1H chart remains in a clear bearish market structure: lower highs, multiple BOS to the downside, and price holding below the main EMA stack. The current candle is sitting inside a demand band near the weak-low area, which makes today a two-scenario session: either a controlled relief bounce into supply, or a breakdown continuation if the demand fails.
1H Market Structure
The last impulsive leg down was followed by a corrective pop, but sellers defended the recovery and pushed price back into the demand band.
Price is still capped by a descending trendline drawn from the prior swing highs (late Dec/early Jan). Until that trendline breaks, rallies are more likely to be sold.
Directional bias:
Bearish while below 1.1702–1.1718
Any upside is treated as a pullback unless price reclaims the supply zones with confirmation.
Key Levels for Today (Support & Resistance)
Resistance (Sell Zones)
1.1689 – 1.1703
First reaction zone (EMA friction + prior intraday pivot). If price rebounds, this is the first area where sellers typically re-enter.
1.1718 – 1.1742
Major “sell-the-rally” zone (dynamic EMA ceiling + structure supply). This is the key barrier to flip momentum intraday.
1.1758 – 1.1762
Higher-timeframe supply/ceiling (top structure resistance on this leg). A break above this would weaken the bearish narrative.
Support (Buy Defense / Breakdown Triggers)
1.1674 – 1.1655
Current demand band / weak-low region. This is the “line in the sand” for intraday buyers.
1.1640 – 1.1626
Next support pocket if the weak-low breaks and price accelerates.
Fibonacci Roadmap (Swing High → Swing Low)
Using the most recent down swing (from the last pullback high into the current weak-low area), the retracement zones align well with the chart’s EMA/pivot levels:
0.382–0.5 retracement: 1.1689 – 1.1703 (first sell zone)
0.618 retracement: around 1.1718 (key trend continuation sell area)
0.786 retracement: 1.1735 – 1.1742 (last-resort supply before trend invalidation attempts)
This is why 1.1689–1.1703 and 1.1718–1.1742 matter most: they are Fibonacci confluence zones, not random numbers.
EMA + RSI Confirmation Rules
EMA filter
As long as price stays below the EMA cluster (and the longer EMA), rebounds are statistically more likely to stall.
A bullish shift requires multiple 1H closes above 1.1718 with EMAs starting to flatten.
RSI trigger (confirmation, not prediction)
Bear continuation: RSI holds below 50 and rejects on retests (sell rallies).
Relief bounce quality: RSI pushes back above 50 and holds while price reclaims 1.1703 (bounce can extend into the next supply).
Trading Strategies (High-Probability Plans)
Plan A: Sell the Rally (Primary Trend Setup)
Entry zone: 1.1689 – 1.1703
Invalidation: 1H close and hold above 1.1718
Targets: 1.1674, then 1.1655 (and extension to 1.1640/1.1626 if breakdown follows)
Best used when price taps the zone and prints rejection structure (wicks, lower high, RSI failure under 50).
Plan B: Relief Bounce Long (Countertrend, Quick Management)
Entry zone: 1.1674 – 1.1655 (demand defense only)
Invalidation: clean 1H breakdown below 1.1655
Targets: 1.1689 – 1.1703, then partial continuation only if price accepts above 1.1703
This is not a “trend reversal” trade. Treat it as a mean-reversion bounce unless structure flips.
Plan C: Breakdown Continuation (Momentum Expansion)
Trigger: 1H close below 1.1655, then a failed retest back into the band
Entry: retest rejection under 1.1655–1.1670
Targets: 1.1640, then 1.1626
This setup usually offers the cleanest follow-through when liquidity under the weak low is taken.
Summary
Bearish bias remains dominant while price is capped under 1.1703–1.1718.
The current demand band 1.1674–1.1655 is the key battlefield: defend for a bounce, or break for continuation.
Best opportunities today come from Fibonacci + EMA confluence at resistance and confirmation via RSI behavior.

BIANRENSHENG/USDT — U-Shape RecoveryBIANRENSHENG/USDT has completed a prolonged corrective phase and is now showing classic U-shape recovery behavior. Price spent sufficient time at the bottom, absorbing sell pressure and forming a rounded base

BABA – Weekly / Daily Structure | Wave (4) Update
Thesis
NYSE:BABA remains in a broader bullish reversal, with the current pullback continuing to resolve as an intermediate corrective phase.
Context
- Weekly and daily timeframes
- Multi-year base already completed
- Prior impulsive advance followed by a controlled retracement
What I see
- Pullback continues to respect the prior breakout structure
- Price is consolidating inside a descending corrective channel
- Rising longer-term moving-average support remains intact
- Structure remains consistent with an intermediate Wave (4) correction
What matters now
- The 50-day moving average is aligned with the 0.382 Fibonacci retracement near the $159 area
- A break and hold above this confluence would signal completion of Wave (4)
- Failure to reclaim this level likely extends consolidation
Buy / Accumulation zone
- Current consolidation range within the Wave (4) retracement zone
- Risk remains defined against the recent higher low
Targets
- A confirmed flip of the $159 confluence opens the path toward the $230 area
- That level aligns with the next intermediate upside reference
Risk / Invalidation
- Loss of rising support would weaken the bullish reversal structure

Rolls-Royce Holdings: Wave Count AdjustedAfter Rolls-Royce shares recently surged and broke through resistance at €14.10, we have revisited our wave count and made some adjustments. We now primarily believe that the low of wave (4) in magenta was likely set at the end of November, forming a turquoise A-B-C three-wave move. In any case, the ongoing wave (5) in magenta should still have some upside potential before completing the larger cyclical wave I in beige.
