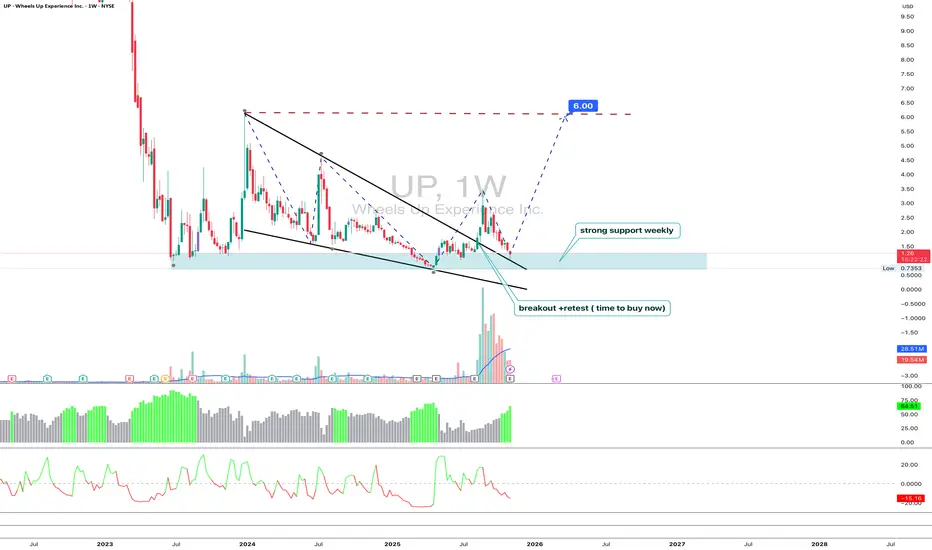
UP 1W-business jet without autopilot, but the runway looks clearTechnically, Wheels Up (UP) broke out of a long falling wedge and returned to the wide demand zone around $1.00–$1.30, where weekly support has formed. Volume expansion and bullish divergence signal that accumulation is taking shape. As long as price stays above $1.05, the structure remains constructive with initial upside targets at $1.60 and $1.80, while a breakout above $2.00 could open the door toward $6.00.
Fundamentally , the company continues its transformation after the liquidity crisis and strategic partnership with Delta Air Lines. Management has shut down unprofitable low-margin programs, refocused on high-yield corporate and frequent-flyer clients, and introduced a leaner “asset-light” model by outsourcing part of its fleet to partner operators. Q3 2025 results showed revenue near $185 million with solid gross bookings growth and improved operational efficiency - 99 % flight completion and 89 % on-time performance mark the best metrics since restructuring began. Losses and negative cash flow remain, but cost discipline is improving, and the Delta integration is slowly turning into a real commercial synergy. If corporate demand keeps strengthening and free cash flow moves toward breakeven, UP may turn into a rare small-cap comeback story in the aviation sector.
Tactically , the plan remains simple - hold above $1.05, look for movement toward $1.60 and $1.80, take partial profits near $2.00, and re-enter on retests around $1.20–$1.30 if volume confirms. A weekly close below $0.95 would invalidate the bullish scenario.
The market has heard “we’re taking off” before but this time, there’s at least a real runway under the wheels.
Wedge
PONKEUSDT - A Major Dump Incoming?Yello Paradisers — did you just witness that clean breakdown on PONKEUSDT? If not, this might be your early warning. The structure is starting to unravel, and if you're not prepared, this move could catch you off guard. Let’s walk through what’s happening and how to approach it with precision.
💎PONKEUSDT has broken down from a rising wedge pattern that formed right beneath a significant resistance zone. This breakdown isn’t just technical noise — it’s supported by strong bearish confluence across multiple indicators. We're seeing clear divergence on the MACD histogram, RSI, and Stochastic RSI, all of which point toward weakening bullish momentum and increasing downside probability. When you have structure, resistance, and momentum all aligning like this, it's time to start thinking defense — not offense.
💎If the price retraces back up toward the resistance zone, this could provide a cleaner and higher-probability entry for shorts. Ideally, traders should look for confirmation through candlestick patterns such as a bearish engulfing to validate their setup. A retracement followed by rejection would not only strengthen the bearish case but also significantly improve the risk-to-reward ratio of any new positions.
💎However, it’s crucial to stay objective. If PONKEUSDT pushes back above the resistance zone and closes a candle with conviction, the bearish setup becomes invalid. That would be our signal to step aside and wait for new confirmation before making any moves. Trading based on probabilities means knowing exactly when you're wrong — and having the discipline to act on that.
🎖We are playing it safe right now. If you want to be consistently profitable, you need to be extremely patient and always wait only for the best, highest probability trading opportunities.
MyCryptoParadise
iFeel the success🌴

Bitcoin - Will History Repeat Itself Again?📈Bitcoin continues to follow a remarkably similar path to its previous market cycles. Each major bullish impulse has been followed by a controlled correction, a fakeout towards the lower trendline, and then a strong rebound toward new highs.
Looking closely at the current structure, BTC seems to be retesting the lower bound of its long-term rising channel, a pattern that played out multiple times before every major leg up.
⚔️If history repeats itself, this fakeout could mark the final shakeout before the next macro rally, with a potential reversal forming between late November and early January.
🏹From there, the next impulsive wave could push price toward the upper boundary of the channel, around the $150,000–$160,000 zone, aligning perfectly with Bitcoin’s long-term cyclical rhythm.
The big question remains: will history rhyme once again, or is this time different?
⚠️ Disclaimer: This is not financial advice. Always do your own research and manage risk properly.
📊All Strategies Are Good; If Managed Properly!
~Richard Nasr

Hecla Mining Company - BullishBreakout after 26 year wedge pattern
Plenty of volume too and no retest yet, especially in September 2025.

GBP-AUD Will Keep Falling! Sell!
Hello,Traders!
GBPAUD is forming a clear bearish wedge, showing distribution inside a premium zone. Once liquidity above internal highs is swept, expect a displacement toward the downside. Time Frame 4H.
Sell!
Comment and subscribe to help us grow!
Check out other forecasts below too!
Disclosure: I am part of Trade Nation's Influencer program and receive a monthly fee for using their TradingView charts in my analysis.

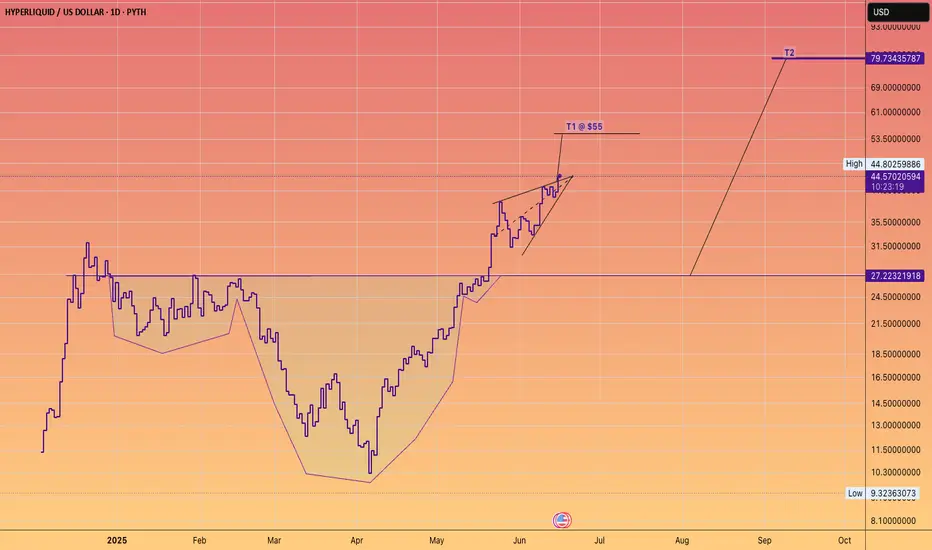
Don't fight the HYPE train!The James Wynn saga was wonderful advertising for the platform.
(Maybe it was staged).
Either way #Hyperliquid goes higher.
BTC/USD Broadening Wedge Pattern, Chance to $129kThis analysis focuses on the BTC/USD pair in the Daily Timeframe. This trading idea suggests a potential Long Position (Buy) based primarily on the formation of the Broadening Wedge chart pattern (also known as the Megaphone Pattern).
Technical Analysis Based on Broadening Wedge Pattern: The chart shows the formation of a pattern characterized by Lower Lows (green arrows) and Lower Highs (red arrows) sloping downwards, but the distance between them is widening, not narrowing. This is a variant of the Broadening Wedge pattern that slopes down, often classified as a bearish continuation pattern or a highly aggressive bullish reversal pattern when the price nears the lower boundary. In this context, with the price bouncing off the lower boundary, the pattern is interpreted as a potential bullish reversal.
Entry: The Long signal is based on two scenarios: Taking a position when the price touches the dynamic support of the lower wedge boundary (seen around the $96,000 - $100,000 level), where the latest bounce is occurring.
Take Profit (TP): The profit target has been precisely set at $129,000. This level is a resistance projection formed by the extension of the broader Broadening Wedge's upper trendline, indicating a potential rise of 29.07% from the current price. This level also serves as a test point to determine whether the price can break through and continue the long-term bullish uptrend or will retest that resistance.
Timeframe: This analysis is based on the Daily chart. The movement towards the target is projected to take about 57 days (57 bars), with the estimated time of target achievement around December 31, 2025. This suggests that this trading idea falls into the Medium-Term Swing Trade category.
Stop Loss (SL): To limit risk, the Stop Loss (SL) should be placed below the lower boundary of the Broadening Wedge pattern, which is considered crucial support. A safe SL placement is around the psychological level of $90,000 - $85,000 to invalidate the entire bullish idea if the wedge pattern is definitively broken downwards, signaling a deeper continuation of the bearish trend.
The current interpretation is a potential bullish reversal from the lower boundary of the pattern. Further confirmation will come from price action that manages to create a Higher Low on the retest of the dynamic support area, and strong buying volume upon a breakout from the upper trendline, validating the $129,000 target as a realistic Take Profit.
** Disclaimer: This analysis is part of a trading plan and does not constitute investment advice. Always use strict risk management and consider the potential for loss in every trading decision.**

GBPAUD BEARISH WEDGE PATTERN|SHORT|
✅GBPAUD price is consolidating in a bearish wedge after a sharp drop, suggesting continuation toward the 1.9950 target zone once support breaks. Time Frame 5H.
SHORT🔥
✅Like and subscribe to never miss a new idea!✅

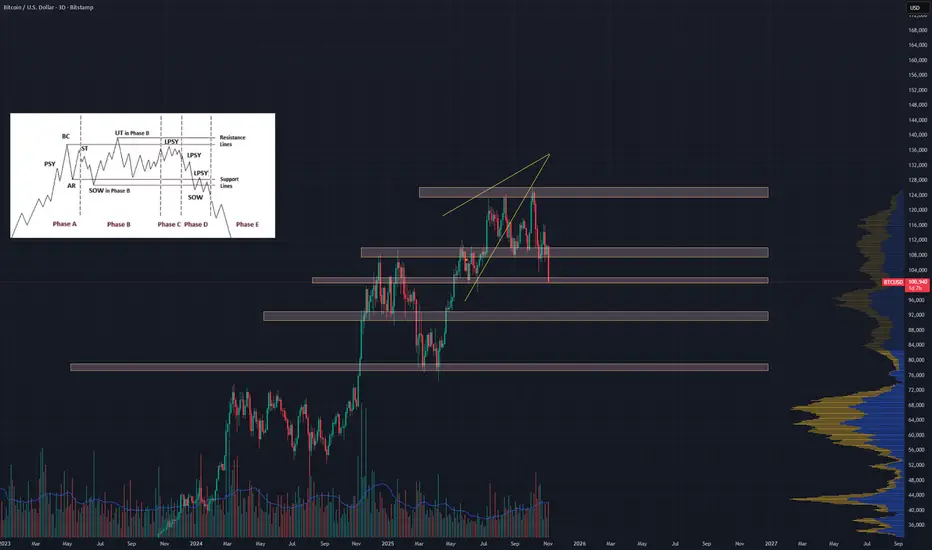
Another BTC Chart but created with PnF chartingThese drawings were made with a One Hour PnF chart for Bitcoin. Wyckoff distribution picture included for posterity.
Chart speaks for itself along with my last chart. Those Supply/Demand Zones will tell you a lot.
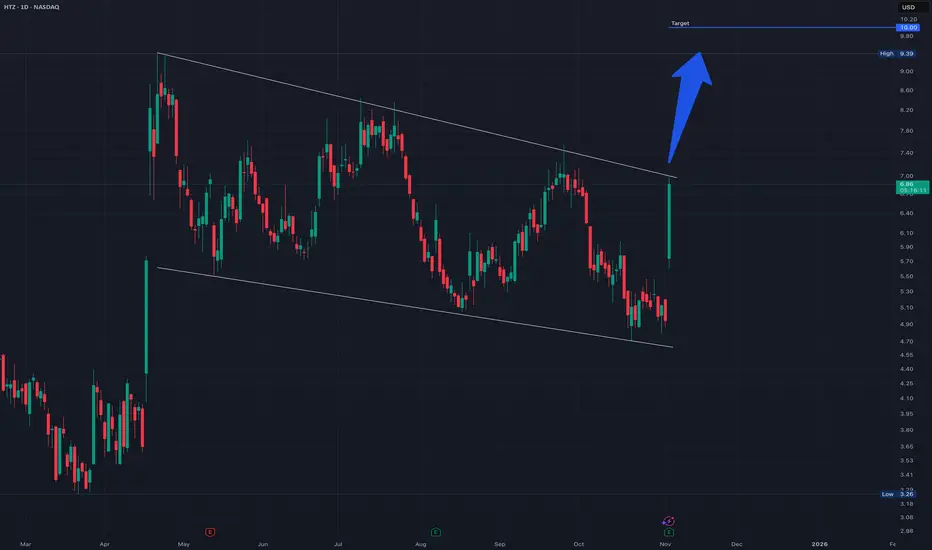
HTZ | Falling Wedge Formation — Watching for Bullish Breakout ToHertz Global Holdings ( NASDAQ:HTZ ) is currently trading within a well-defined falling wedge pattern, a classic bullish setup that often precedes a reversal or breakout to the upside. After a period of consistent lower highs and lower lows, the price appears to be compressing near the wedge’s lower boundary, suggesting a potential exhaustion of selling pressure. The narrowing structure indicates that volatility is contracting, typically a prelude to a decisive move. If price action confirms a breakout above the upper trendline with solid volume, the pattern projects a potential upside target near $10, aligning with prior resistance levels and measured-move expectations from the wedge height. I’m monitoring closely for a daily close above the wedge resistance as a confirmation signal. Until then, the pattern remains in play, offering a constructive technical setup for bullish continuation.
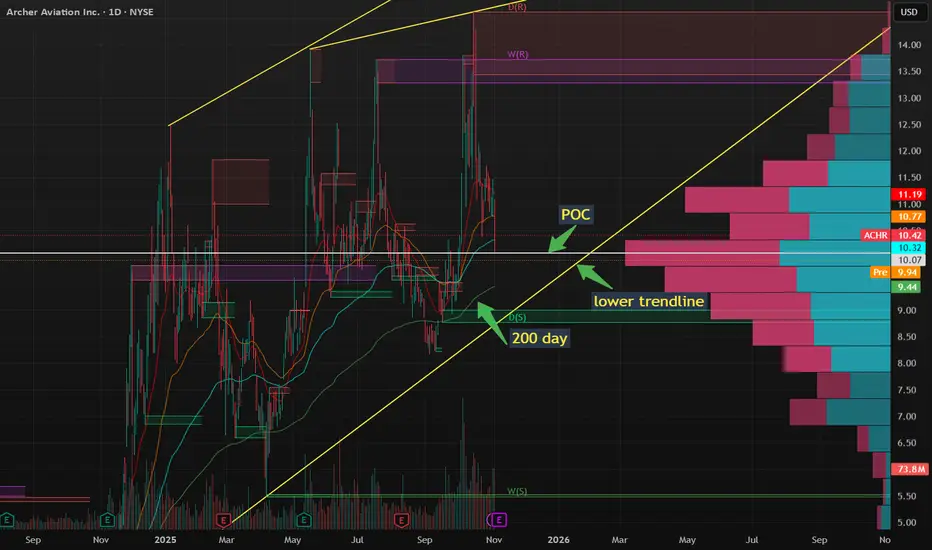
ACHR to take flight (again)ACHR is my favourite vertical flight buys. I think JOBY is over-priced, and EVTL just doesn't seem to have enough market visibility.
I've been in and out of ACHR for the better part of 2 years, and it's coming back into a spot where a swing makes a bit of sense.
It's still in the rising wedge (which of course, it could fall out of), but there's lots of support to indicate that it should hold.
1. Today at pre-market it's trading at $10. That's almost exactly the POC for the past year.
2. The 200 day moving average is at about $9.50
3. The lower trendline is at about $9.00
With earnings on Thursday, there is some risk to this trade, but I think with options premiums, it's a good risk/reward balance.
On open, I'll look to sell puts somewhere around my ideal entry point which is $9.
Ideally I'd like a 10% value on the puts which means that I'd like about $0.09 per share.
If the earnings crash, and I own the stock below $9, I'm OK with that. If the stock price drops, but stays above $9, I may just outright buy it. If the stock price jumps, I'll keep the premium, and wait for a new entry point at a later date.
I'll update this at market open.
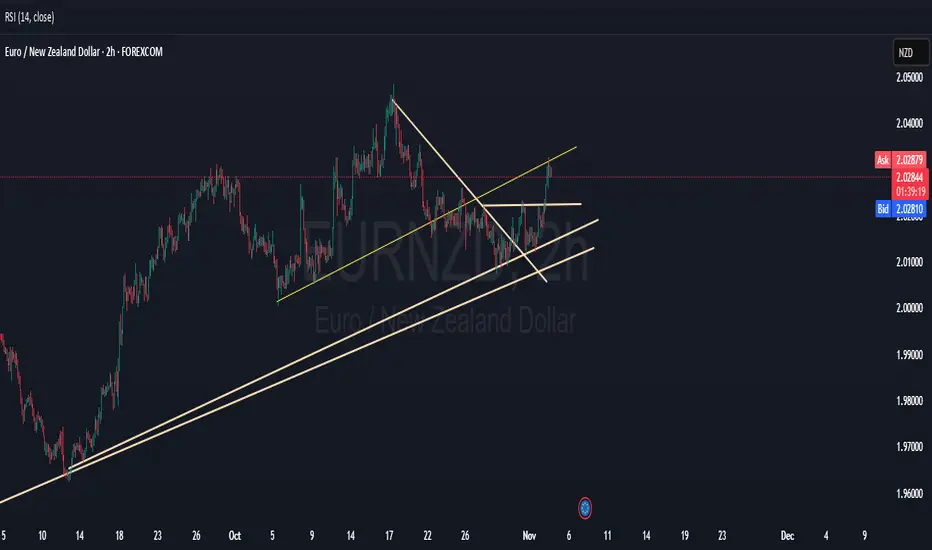
MAYBE EURNZD SHORTS CAN BE 100PIPS?From a break and retest perspective, EURNZD is poised for a sell. Only react to market and not predict. Stay safe out there and KNOW YOUR RISK APPETITE
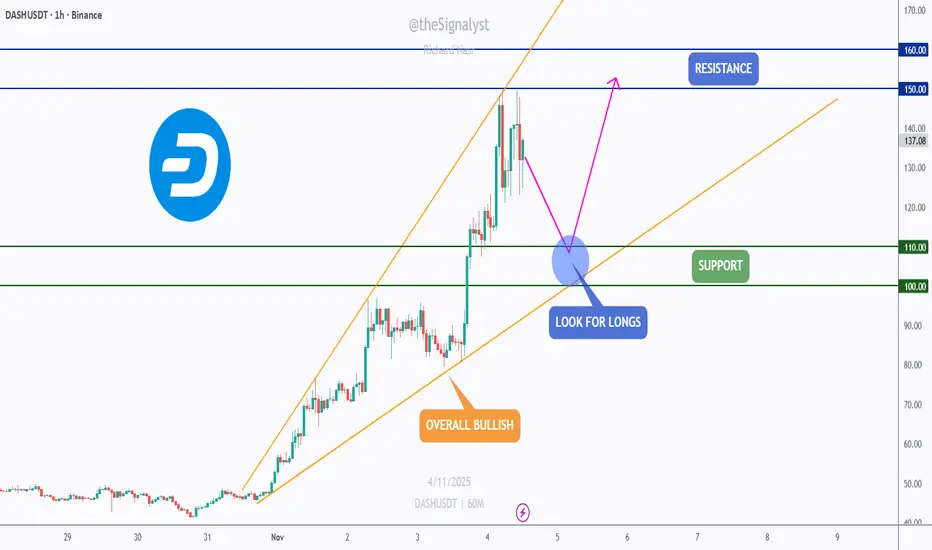
DASH - Top Performer Setting Up for the Next Leg!🏹DASH has been one of the top-performing altcoins this month, showing strong momentum and clear leadership among mid-cap assets.
💣After an explosive rally, price is now pulling back within a well-structured rising wedge, a healthy correction within an overall bullish trend.
As DASH approaches the intersection of support and the lower bound of the wedge, this confluence zone will be key to watch.
I’ll be looking for trend-following long opportunities from that area, targeting a continuation toward the $150–$160 resistance zone.
⚔️As long as the $100 support holds, the bulls remain firmly in control, and this dip could be the perfect opportunity to join the next wave up.
⚠️ Disclaimer: This is not financial advice. Always do your own research and manage risk properly.
📊All Strategies Are Good; If Managed Properly!
~Richard Nasr
$BYND - The Next GMELet's look at the thesis behind this idea :-
1) Massive Short interest.
2) Falling Wedge Pattern.
3) Diamond Hands are back again and This time they are supporting BYND.
4) Untapped Liquidity Resting above and possibility of liquidating Shorts would also be appealing to Market makers to supply Liquidity to HIGHER Bidders for building new Short positions.
From my speculation, this is highly risky play. But how to play it?
No need to go full APE.
Risk Assessment can be used. Assess your risk. Use a Stop loss. Accept your Risk. Always use a Stop loss with risk in mind of what you can afford to lose.
This is not a Financial Advice. Your gains and losses are your responsibility. I wish you good luck.
This idea is for educational purposes only. DYOR.
If you like this idea then Follow me please.

Gold Technical Outlook: Bearish Wedge Formation Signals Potenti
The four-hour chart of gold (XAU/USD) shows price action developing within a rising wedge pattern, which typically indicates a potential bearish reversal if a breakdown occurs. The price is currently hovering around $3,995, near the 50-period exponential moving average that acts as dynamic resistance, while the 200-period EMA below provides structural support for the broader trend.
From a technical perspective, the bias remains bearish as long as the price stays below the upper boundary of the wedge and under the $4,060 resistance level. A confirmed break below the wedge’s lower trendline could trigger a decline toward $3,950 and $3,890, with further downside potential extending to $3,820 and $3,730.
Conversely, a breakout above $4,025–$4,040 could lead to a temporary corrective rally toward $4,160 before sellers potentially regain control. Overall, gold maintains a downward bias in the short term, with momentum favoring further weakness unless the price stabilizes above $4,060.

Gold Nears Resistance — Buyers Target $4,130 BreakoutHello traders, here’s my current outlook on Gold (XAUUSD). The market structure shows that Gold has recently shifted from a sharp bearish phase into a short-term recovery pattern, finding solid demand near the $3,940–$3,950 Buyer Zone. After the last strong drop from the $4,130 Resistance Level, price stabilized within this accumulation area and began forming an ascending structure supported by a clear Support Line. Currently, Gold is trading inside a rising wedge pattern — a signal of a tightening market where buyers are gradually gaining ground. The Resistance Line near $4,050 represents a short-term barrier, and a confirmed breakout above this level could open the way for a move toward the $4,130 Resistance Zone (TP1), which aligns with the previous Seller Zone. From my perspective, as long as the price remains above the $3,940–$3,950 Support Zone, the bullish bias remains valid. A successful breakout above $4,050 would likely confirm the continuation of the current upward momentum, targeting $4,130. However, if the price fails to break above resistance and falls below the ascending support line, a short-term pullback toward the Buyer Zone could occur before any new bullish wave develops. In my opinion, the market structure currently favors buyers, with strong support underpinning the move. Therefore, I’m expecting a potential bullish continuation toward $4,130 as the next key target.

NDZJPY BUY SET UPNZDJPY Technical Breakdown – 3 Confluences for a High-Probability Buy Setup
After a corrective move to the downside, NZDJPY has presented a potential long opportunity backed by multiple confirmations:
1️⃣ Bullish Flag Breakout –
The pair recently broke out of a downward-sloping channel (bullish flag), indicating a possible continuation of the previous impulsive bullish leg.
2️⃣ Retest of Structure Support –
Price has pulled back to retest a previous resistance zone that has now flipped into support around the 88.20 level. This retest aligns with the principle of market structure continuation.
3️⃣ Rejection from Demand Zone –
Multiple rejections from the demand area highlight strong buying interest and institutional order flow at this level.
🎯 Bias: Bullish continuation toward the next resistance zone near 88.80
📊 Timeframe: 1H
🧠 Risk Management: Stop below 87.99 to protect against potential fakeouts
Trading isn’t about prediction — it’s about confluence and probabilities.
#TradingStrategy #MarketAnalysis #NZDJPY #Forex #TechnicalAnalysis #PriceAction #TraderMindset

EURUSD - Preparing for the Next Wave of Bearish Momentum!🏹EURUSD remains trapped within a well-defined descending channel, with the market structure clearly favoring the bears.
Each rally has been met with selling pressure, forming a series of lower highs and lower lows, a textbook example of controlled downside continuation.
⚔️As price approaches the confluence zone, where the upper red trendline meets the horizontal structure around 1.1680–1.1700, I’ll be looking for potential trend-following short setups. This intersection has acted as a strong rejection point in previous moves, and it remains a key decision zone for sellers to step back in.
If rejection confirms there, the next leg lower could retest the 1.1550, then 1.1500 support areas.
On the flip side, a daily close above 1.1720 would be the first sign of a possible short-term shift in sentiment.
Until proven otherwise, the trend is clear — rallies are for selling.
⚠️ Disclaimer: This is not financial advice. Always do your own research and manage risk properly.
📚All Strategies Are Good; If Managed Properly!
~Richard Nasr

Crypto Multi-year Rising TriangleWatching to see how this triangle breaks, as of now it looks like it's going to break down and could fall to around $1 trillion market cap. A break up could lead to a blow off wave or a larger rally.

3 Cases for EURUSD EURUSD continues to fall. I see three possible scenarios for what it might do next.
The first case is that a wedge forms near the current level.
The second case is another leg down to test 1.15.
The third case is the formation of a trend channel, using the parallel of the downward yellow trendline, which would imply a decline toward 1.14.
I do not have a strong opinion on which scenario will play out, so I will play the statistics game and enter a long position here with a favorable risk–reward ratio but a modest take-profit target. I will keep my stop loss above 1.15, enter the trade with half position size, and then see waht the market will do.

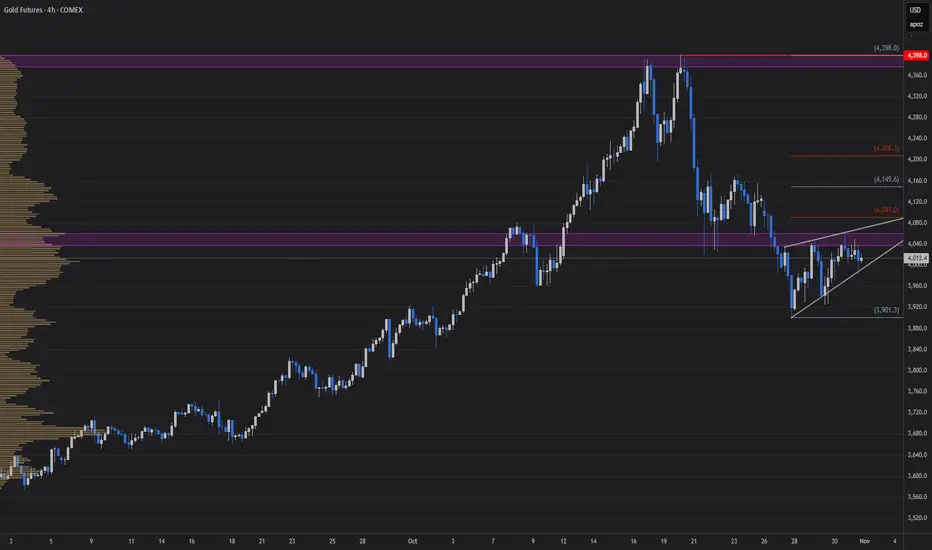
GC Higher or Lower?Looking at GC on the 4 hour TF, we see it consolidating in a small rising wedge. If price wants to continue higher, I will be looking for price to drop back down to the $3980s level and then move higher breaking out of the wedge. If price wants to continue lower, I will be looking for price to make its way up to the 38.2% Fibonacci level marked on the chart, around $4090s, before breaking back down and creating another leg down in its recent downtrend.
What are your thoughts on GC?
DIS | A Possible Bull Flag On Disney | LONGThe Walt Disney Co. engages in the business of international family entertainment and media enterprise. It owns and operates television and radio production, distribution and broadcasting stations, direct-to-consumer services, amusement parks, and hotels. It operates through the following business segments: Disney Entertainment, ESPN, and Disney Parks, Experiences, and Products. The company was founded by Walter Elias Disney on October 16, 1923 and is headquartered in Burbank, CA.

$OPUSD looks good for a long hereSince 2024, OP has been falling inside of a wedge, and it recently broke out and has now backtested it. We've also formed a capitulation low on Oct 6th, and now we look set to make a move higher.
I think we could see between a 2x-10x move from here potentially all the way up to the top of the range.
Let's see how it plays out over the comings weeks.
