EUR/USD - Fundamental / Tech & 1W/1M Macro OutlookFX:EURUSD
The EU economy might be in a coma, but EUR/USD is finally trying to pull out of a long-term bear trend. Technically, we’ve seen a breakout of key levels following a bull flag, so this week is all about confirmation or rejection. Below is my macro and technical analysis, along with a specific game plan
Fundamentals:
- before taking the technical picture under loop, it’s important to break down EUR/USD from the fundamental and macroeconomic side. Local dollar strengthening might cause a short-term drop in the euro, but it won’t be the force that pushes the price south globally
- the Eurozone has been in economic stagnation for quite a while now because production is slowly weakening due to a lack of resources, high energy prices, and high spending on non-productive sectors
- at the same time, the Eurozone is very wealthy, and the resource deficit can be offset by increased imports. To make imports more profitable, the national currency must be strong (so you can buy more goods for one unit of currency), while for more profitable exports, a weak currency is better (you get more money for one unit of goods)
- this is why the resource-rich US has a weak dollar and increases its exports, while resource-poor but cash-rich Europe increases imports and has weak exports because it can’t produce much
- for this same reason, the European Central Bank made no changes to the interest rate last week (if the rate goes down, loans become more profitable for companies, which stimulates the economy by helping production; if the rate goes up, loans become less attractive and production drops) while saying inflation might even decrease (but probably no signs of possible deflation)
- an interesting fact is that in Jan. 2026, the EU signed a truly massive trade deal with India (a country rich in resources and labor), specifically on simplified customs duties for many goods (excluding agricultural products and a few others)
- looking at this through the lens of assumptions, the EU market could be flooded with resources and goods they desperately need, and this increase in domestic resources in EU could lead to a ramp-up in production volumes, potentially boosting industrial earnings, household income, and overall GDP
- as a matter of a fact at the same time the India's market will get a major boost to its economy and production, whereas allowing to significantly increase its GDP over the next few years, and we can also see that the probability of the Indian Rupee rising definitely increases
- of course, there are opposing views and news—for example, Macron recently said the euro is too expensive and needs to be cheaper. Locally this can be the case, but globally today this is far from beneficial for Europe, so in my opinion this kind of news is more like media noise rather than the most probable outcome
Technicals:
- since Oct. 2022, the price reversed after hitting major lows and in Feb. 2025 it confirmed the start of a new medium-term bullish trend, finally breaking out of the long-term descending channel that has been in place since 2008
- during the last week of Jan. 2026, there was an attempt to break a multi-year resistance level of "medium strength" (originating from 1998), which resulted in a false breakout. Why "medium strength"? Historically, the price tends to perform a fakeout here, followed by a technical retracement to the 0.236 Fibonacci level (and rarely a deeper correction towards 0.382), before eventually resuming momentum for a full breakout
- a local correction in DXY towards 98.70 (approx. +1.12% from the current 97.60) could proportionally lead to a local EUR/USD weakening toward the 1.16910 area
- this price target coincides with a mirror support/ressistance level formed in Aug. 2017 and later confirmed in Mar. 2021 and Oct. 2021
- a strong weekly bar has left an imbalance within the {1.16984, 1.17655} range, making this a point of Interest (POI) for further liquidity hunt
- looking at the monthly chart on the screenshot below, the price is testing the upper boundary of a descending consolidation channel for the third time. This is looks like forming a bull flag pattern, which historically signals local accumulation before a further move to the upside
- 1. optimal scenario: 1.16912 is the primary target with a risk-reward ratio of 1:3.65 with taking partial profits (at 45% level of the untouched order zone) at 1.1733, in case HFTs or market makers decide to leave some liquidity untapped for a later move
- 2. optimistic scenario: should sell-side pressure prevail in the local context, the price may test the long-term support level at 1.16400
- 3. pessimistic scenario: conversely, if the price fails to break resistance and consolidate above 1.19050, we could see a move south toward 1.13960 to sweep liquidity below the 1.14680 support. However, this move would take significant time to materialize and should only be considered if the price fails to hold above 1.16400
- local short scenario invalidated if 2 bars close above 1.18780
- higher probability of global long continuation if 2 bars close above 1.19400 ( increased risk if entry at 1.19100 )
Conclusion:
- the Euro has recently broken out of a multi-year downtrend and is currently sitting at the upper boundaries of both a descending consolidation channel and a local ascending channel
- this trade is focused on a retest of the {1.16984, 1.17655} range to clear liquidity before any attempt to test the major resistance at 1.19050
- risk management constraints do not allow for a stop-loss at 1.19420 (the price level which, if held above, would confirm the continuation of the medium-term bullish move)
- the basis for this local short is a combination of the local technical setup, the macroeconomic backdrop, and the currency correlation with the DXY
- higher probability of global long continuation if 2 bars close above 1.19400 (increased risk if 1.19100)
- higher probability of global short continuation if 2 bars close below 1.16100 (increased risk if 1.16750)
- last but not least: always keep the "Black Swan" in mind and stay critical. The EU economy is still in a very fragile state, and the points mentioned above are merely attempts to resuscitate it from an economic coma. Unexpected events can always shift market sentiment overnight, rendering any technical or fundamental analysis useless. Use your head and always weigh the probabilities of different outcomes and their consequences
# - - - - -
Local Short Scenario:
⚠️ Short/Swing-term Signal - Sell ⬇️
✅ Entry Point - 1.1842
🛑 SL - 1.18860
🤑 Partial TP 50% - 1.1749
🤑 Final TP 100% - 1.1692
⚙️ Risk/Reward - 1 : 3.68 👌
⌛️ Timeframe - 3 weeks 🗓
# - - - - -
If price consolidates at 1.19 - 1.195:
⚠️ Long-term Signal - Buy ⬆️
✅ Entry Point - 1.19100
🛑 SL - 1.18170
🤑 TP - 1.22370
⚙️ Risk/Reward - 1 : 2.15 👌
⌛️ Timeframe - 3 months 🗓
# - - - - -
Good Luck! ☺️
# - - - - -
DISCLAIMER: Not financial advice. Everyone must make trading decisions at their own risk, guided only by their own criteria and strategy for opening or not opening a trade
Weeklyanalysis

Market Insights with Gary Thomson: 2 - 6 FebruaryMarket Insights with Gary Thomson: Gold Outlook, Central Banks, US NFP Data, and Corporate Earnings
In this video, we’ll explore the key economic events and market trends, shaping the financial landscape. Get ready for insights into financial markets to help you navigate the week ahead. Let’s dive in!
In this episode of Market Insights, Gary Thomson breaks down what moved the markets last week and unpacks the strategic implications of the most critical events driving global markets.
👉 Key topics covered in this episode:
— What Happened in the Markets Last Week
— Central Bank Meetings
— Nonfarm Payrolls and Unemployment Rate
— Stocks to Watch
Gain insights to strengthen your trading knowledge.
Disclaimer: This video represents the opinion of the Companies operating under the FXOpen brand only. It is not to be construed as an offer, solicitation, or recommendation with respect to products and services provided by the Companies operating under the FXOpen brand, nor is it to be considered financial advice.

TCS Weekly View ! Monitor for continuation ?TCS Weekly View ! Monitor for continuation ?
Cluster band to watch.

Market Insights with Gary Thomson: 26 - 30 JanuaryMarket Insights with Gary Thomson: Geopolitics, Central Bank Meetings, and Corporate Earnings
In this video, we’ll explore the key economic events and market trends, shaping the financial landscape. Get ready for insights into financial markets to help you navigate the week ahead. Let’s dive in!
In this episode of Market Insights, Gary Thomson breaks down what moved the markets last week and unpacks the strategic implications of the most critical events driving global markets.
👉 Key topics covered in this episode:
— What Happened in the Markets Last Week
— Central Bank Meetings
— Stocks to Watch
Gain insights to strengthen your trading knowledge.
Disclaimer: This video represents the opinion of the Companies operating under the FXOpen brand only. It is not to be construed as an offer, solicitation, or recommendation with respect to products and services provided by the Companies operating under the FXOpen brand, nor is it to be considered financial advice.

Market Insights with Gary Thomson: 19 - 23 JanuaryMarket Insights with Gary Thomson: Geopolitics, Inflation & Earnings to Watch
In this video, we’ll explore the key economic events and market trends, shaping the financial landscape. Get ready for insights into financial markets to help you navigate the week ahead. Let’s dive in!
In this episode of Market Insights, Gary Thomson unpacks the strategic implications of the week’s most critical events driving global markets.
👉 Key topics covered in this episode:
— UK
— US
— Stocks to Watch
Gain insights to strengthen your trading knowledge.
Disclaimer: This video represents the opinion of the Companies operating under the FXOpen brand only. It is not to be construed as an offer, solicitation, or recommendation with respect to products and services provided by the Companies operating under the FXOpen brand, nor is it to be considered financial advice.

EURUSD| Institutional Narrative - Weekly (12th JAN - 16th JAN)
WEEKLY NARRATIVE: FX:EURUSD ARCHITECTURE 🦅
Market Condition: Bearish Orderflow Delivery State: Non-Correlated Price Delivery
The Macro View: We are currently navigating a divergence in price delivery. While the primary Draw on Liquidity (DOL) remains at the 1.17900 - 1.18100 levels, the prevailing Bearish Orderflow makes a direct sweep of those highs highly questionable for the early week.
The Roadmap:
Mon-Tue Phase: Expecting a continuation lower. Price is likely to seek Sell-Side Liquidity (SSL) within the 1.16000 - 1.15800 zone.
The Pivot: Once the lower targets are mitigated, we look for a corrective shift.
The Retracement: A move back into the 1.16900 - 1.17200 premium array to rebalance.
Architect’s Note: Do not marry the bias. The non-correlated nature of the current delivery means we must wait for displacement before confirming the retracement leg.
Happy Trading. @HSK_FX

Weekly Trade Planning Session: High Probability Pairs Analysis"When you fail to plan in trading, you are planning to fail." Welcome to this week's trade planning session where we identify high-probability setups using currency strength analysis + technical structure.
📊 Portfolio Selection - Currency Strength Index (CSI):STRONG Currencies (Buy Bias):
🟢 AUD
🟢 USD
🟢 GBP
🟢 CHF
🟢 EURWEAK Currencies (Sell Bias):
🔴 JPY
🔴 NZD
🔴 CAD
Why This Matters:
High-probability trades occur when technical structure aligns with fundamental strength. When a strong currency pairs against a weak one AND the chart shows clear technical setup = highest probability. Strategy: Look for strong vs weak currency pairs with confirming technical patterns.
💹 USDJPY Analysis (1HR Chart):Structure: Completed bullish wave structure ✓Current Position: Trading at the high
Expected Move: Bearish reversal
Entry Strategy (Advanced):
Rather than selling immediately at the high, I'm waiting for a failure pattern:
First: Expect break above Friday's high (158.18)
Then: Watch for failure to hold above 158.18
Entry: Sell on the rejection/failure
Why This Works:
This "break and fail" pattern traps late buyers and creates a higher-probability reversal entry with tighter risk.
Status: Watch for setup to develop
💶 EURUSD Analysis (1HR Chart):
Structure: Bearish wave structure in progress
Completed: Wave 0-1-2 ✓
Wave 2 extended nicely forming Wave 3 ✓
Expected This Week: Wave 4 formation (pullback)
Key Requirement for Downtrend Continuation:
We NEED to see Wave 4 form. This means a Lower High (LH) must develop before downside continuation to Wave 5.
Immediate Outlook:
Based on current price formation, a break above 1.1742 is possible before the sell setup activates.
Strategy: Watch for rally to 1.1742+
Then look for LH formation (Wave 4)
Sell the Wave 4 completion for Wave 5 downside.
💷 GBPUSD Analysis (1HR Chart):
Last Week's Action: Price failed below the last bullish wave structure, creating a complete breakdown.
Current Status: Price definition unclear
Issue: Structure is ambiguous after the breakdown
Recommendation: Wait for clarity. Allow price to create Wave 2 structure, which will provide a clear selling framework.
Strategy: Patience required. Let structure develop before committing.
🍁 USDCAD Analysis (1HR Chart):
Recent Action: Strong short covering rally without structural pullback = extended and vulnerable.
Opportunity: This uninterrupted rally creates potential for strong bearish reversal.
Entry Approach: Drop to lower timeframe (15min or 5min)
Wait for break of momentum low on lower TF
Look for selling opportunity after 1HR buyer stop-losses trigger
Logic: Extended moves without pullbacks eventually exhaust. When 1HR buyers' stops get hit, momentum can reverse sharply.
Strategy: Monitor for momentum low break on smaller timeframes, then execute short.
💡 Trading Principle:
"Fail to plan = Plan to fail"
This weekly planning session ensures we:
✅ Know currency strength/weakness going into the week
✅ Identify high-probability pairs (strong vs weak)
✅ Have clear technical levels to watch
✅ Understand what price needs to do before we act
✅ Trade in harmony with the market, not against it
Preparation = Confidence = Better Execution
Updates This Week:
I'll post individual trade setups as they develop throughout the week. Follow for updates!
👍 Boost if you found this weekly planning helpful
👤 Follow for trade updates throughout the week
💬 Which pair are you watching? Comment below
Wishing you a successful trading week! 📈

ORIENT CERATECH LTD - WEEKLY TRENDLINE BREAKOUT📊 ORIENT CERATECH LTD – Weekly Trendline Breakout Attempt 🔥
📅 Date: Jan 01, 2026
⏱️ Timeframe: 1W
💰 CMP: ₹52.51 (+21.64%)
📌 Exchange: NSE
🔍 Technical Structure Overview
Orient Ceratech has been trading under a long-term descending trendline, forming a broad consolidation / corrective phase after its previous rally.
Recent price action shows strong bullish momentum, with a high-volume bullish candle attempting to break above the falling trendline — a classic early sign of trend reversal.
This move becomes technically significant as it occurs after:
Higher lows formation
Demand stepping in near ₹32–35 zone
Strong weekly close near highs
🎯 Possible Scenarios
✅ Bullish Case:
Weekly close above ₹56
Retest and hold of breakout level
Targets: ₹65 → ₹72 → ₹80
⚠️ Caution Case:
Rejection near trendline
Sideways consolidation between ₹46–56
📌 Chart Summary
Orient Ceratech is at a critical inflection point on the weekly timeframe.
The stock is showing early trend reversal signals, supported by strong volume and price expansion. A confirmed breakout could open doors for a fresh medium-term uptrend.
⚠️ Disclaimer
This analysis is for educational purposes only. Not financial advice.

Market Year Wrap 2025 with Gary ThomsonMarket Year Wrap 2025 with Gary Thomson: Key Highlights and Outlook for 2026
2025 was a year defined by policy shocks, geopolitical risk, and strong divergence across asset classes. From renewed trade wars to record-breaking equity and commodity moves, markets were repeatedly forced to reprice macro assumptions. Let’s recall the most critical events that had an impact across FX, equities, and commodities.
Key Highlights:
- FX Markets: Currency pairs were highly volatile throughout the year as persistent recession fears, weak and uneven macro data, contradictory monetary policy signals, and rising geopolitical tension triggered significant price swings.
- Equities: US equities experienced sharp volatility during the year. In April 2025, the implementation of broad tariffs triggered a large sell-off, marking the largest decline since the COVID crash of 2020. Despite this, equities recovered strongly. Expectations of easier monetary policy and resilient corporate earnings pushed major indices to record levels by year-end.
- Commodities: Precious metals were among the strongest performers of the year. Energy markets told a different story. Policy decisions and geopolitical dynamics played a central role across the markets.
Stay informed and ahead of the market with us!
Disclaimer: This video represents the opinion of the Companies operating under the FXOpen brand only. It is not to be construed as an offer, solicitation, or recommendation with respect to products and services provided by the Companies operating under the FXOpen brand, nor is it to be considered financial advice.

Alembic Limited – Weekly Chart Technical AnalysisMarket Structure
On the weekly timeframe, the stock has been in a broad consolidation phase after a sharp decline from the ₹160–165 supply zone.
Price is currently trading near ₹100, which lies in the middle of a long-term range, indicating indecision and low momentum.
Multiple rejections from higher levels suggest that sellers remain active near resistance zones.
Key Demand & Supply Zones
Major Support Zone: ₹80–85
This is a long-term demand area where strong buying previously emerged.
Intermediate Support: ₹90–92
Short-term support; loss of this level may accelerate downside.
Immediate Resistance: ₹120–125
Strong supply zone; price needs acceptance above this level for trend reversal.
Major Resistance: ₹165–170
Previous distribution zone and long-term supply area.
Price Action Outlook
As long as price holds above ₹80–85, the structure remains range-bound with accumulation potential.
A pullback towards ₹90–85, followed by strong bullish price action, can act as a base for medium-term recovery.
A decisive weekly close above ₹125 would signal a trend change and open upside towards higher resistance zones.
Until then, rallies are likely to face selling pressure near ₹120–125.
Bias
Neutral to mildly bearish below ₹120
Range-bound between ₹85 and ₹125
Bullish confirmation only on sustained breakout above ₹125
Disclaimer
This analysis is based purely on technical analysis and historical price behavior. It is provided for educational purposes only and should not be considered as investment or trading advice.

MOIL LTD – Weekly AnalysisTrend: Medium-term downtrend but approaching a major reversal zone.
Structure: Price still below falling trendline; momentum weak.
🟢 Strong Demand Zone: 260–285
Major support area.
Multiple historical reversals from this zone.
High probability of a bounce if price retests this region.
🔴 Resistance Levels
380–405: First major resistance. Expect selling here.
520–560: Long-term strong supply zone.
📈 Expected Move
Price likely to retest 260–285 zone.
If demand holds, a bullish reversal towards 380–405 is expected.
Sustained weekly close above 405 can open targets toward 480+.
⚠️ Invalid Scenario
Weekly close below 260 = bearish breakdown and deeper correction risk.
📌 Summary
Stock nearing a high-probability reversal area.
Watch 260–285 for accumulation + bounce setup.
First upside target: 380–405.
⚠️ Disclaimer
This is only for educational purposes, not financial advice. Use stop-loss and manage risk.

Week 48 Market Update — $SPXStrong week for the SP:SPX index. After two weeks of hesitation candles, price finally shifted back into strength and pushed decisively higher. This week’s candle not only reclaimed momentum but fully erased last week’s cooling-off behavior.
Price also moved well above the key mid-range levels that traders usually watch to define trend health. It’s now sitting firmly above the major risk zone and continues building distance away from it — a clear sign of strength. From the moment this week’s upside break triggered, the index has gained roughly 1.9%, and that kind of move typically translates into solid returns for options traders playing directional setups.
Major support zones sit lower around 5900, 5100, and the deeper structural support near 4000. As long as price holds above the upper layers of support, momentum remains intact.
On the higher-timeframe monthly chart, the trend has been active for eight straight months with no signs of exhaustion. Price is still far above the level where the monthly trend began, and even further above the long-term midline — showing how dominant the larger trend still is.
The 2-day chart continues to support the overall bullish structure, breaking above short-term levels and maintaining strength after multiple confirmations earlier in the week.
This week was a clean continuation of the broader uptrend — strong candle, strong momentum, and strong positioning above every major structural region.
Elite clarity. Elite precision. More coming soon.

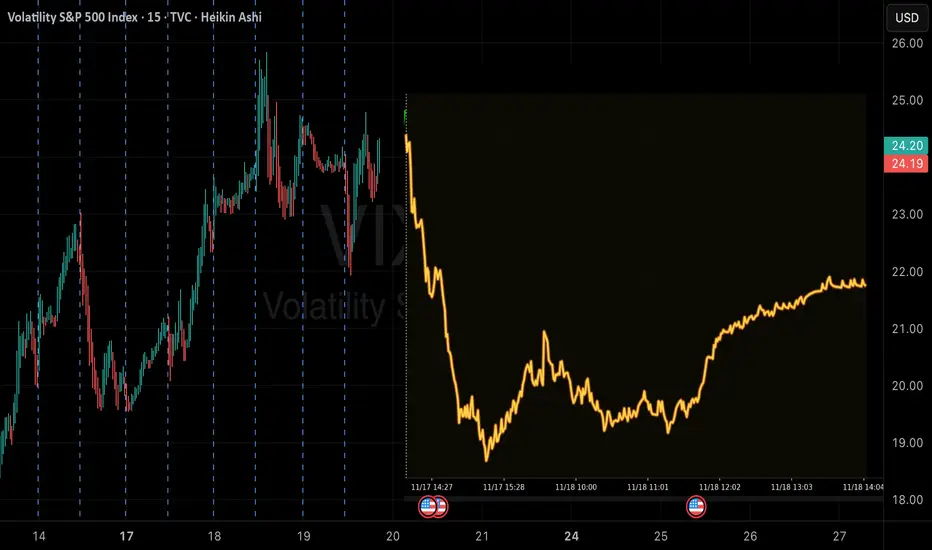
QuantSignals V3: High-Confidence VIX DowntrendVIX QuantSignals Katy 1M Prediction (2025-11-19)
Current Price: $22.40
Trend: Bearish
Confidence: 75%
Volatility: 94.1%
Final Prediction: $20.98 (-6.34%)
30-Min Target: $21.10 (-5.81%)
Trade Signal:
Direction: PUT
Entry: $22.40
Target: $21.26
Stop Loss: $22.74
Expected Move: -6.34%
Summary: 1 trade signal generated from 1 successful analysis.
Weekly Outlook: XAUUSD, #SP500, #BRENT for 17-21 November 2025XAUUSD: BUY 4085.00, SL 4055.00, TP 4175.00
Gold enters the new week around $4,080 per ounce on Monday, November 17, 2025. The market focus is the release of the Federal Reserve minutes this week and the resumption of delayed U.S. macro data after the government pause ended: this shapes expectations for the future rate path and the dollar’s dynamics. Meanwhile, overall demand for gold is supported by sustained official purchases: according to the World Gold Council, central banks kept net buying elevated in Q3, and October marked a fifth consecutive month of inflows into gold funds. On the supply and alternative-yield side there are no notable new factors; 10-year Treasury yields remain near recent levels, which limits the cost of holding gold but does not negate safe-haven demand.
Fundamentally, the week looks moderately favorable for XAUUSD: the minutes may confirm a course toward gradual easing of conditions in 2026, while uncertainty in data and the geopolitical backdrop preserve interest in defensive assets. Risks for buyers include a tougher reading of the minutes and a stronger dollar; supportive factors include steady official purchases, continuing ETF inflows, and stable retail investment demand. In this environment, buying dips with a nearby loss limit is preferred.
Trade recommendation: BUY 4085.00, SL 4055.00, TP 4175.00
#SP500: BUY 6735, SL 6685, TP 6885
The S&P 500 starts the week near 6,734 at Friday’s close (November 14), while Monday futures trade modestly higher on expectations for key corporate earnings. The main catalyst is results from the leading producer of AI-focused semiconductors, viewed as a gauge of whether the investment cycle in AI and corporate capex continues. On the macro side, the Fed minutes and the return of several delayed indicators will help refine the monetary-policy path after recent rate cuts. Yields on 10-year U.S. Treasuries are holding around 4% with choppy swings, which does not add fresh pressure to equity multiples.
The weekly backdrop supports the benchmark: anticipated corporate drivers (AI investment, retailer reports as a read on consumer demand) and reduced data uncertainty as releases resume. Risks include softer guidance on AI capex, a jump in yields, or more cautious signals from the Fed minutes. The base case is a measured continuation of the uptrend if earnings resilience is confirmed and no negative surprises appear in the data.
Trade recommendation: BUY 6735, SL 6685, TP 6885
#BRENT: BUY 64.00, SL 61.80, TP 70.60
Brent crude on Monday, November 17, 2025, holds near $64 a barrel as the market digests the resumption of loadings at Russia’s Novorossiysk port after a brief halt while reassessing the global supply-demand balance. Recent assessments point to a growing surplus in 2025–2026: agencies note faster output growth alongside moderate demand, while OPEC+ signals readiness to manage supply flexibly against the backdrop of lowered official selling prices for Asia in December. At the same time, geopolitical risks and occasional disruptions periodically restore a risk premium, cushioning the pressure from oversupply.
This week, prices will be driven by news on OPEC+ discipline, stock/export data, regulator commentary, and the dollar’s path after the Fed minutes. The base balance is “moderately neutral” with elevated sensitivity to headlines: absent fresh signals of a larger surplus, the market tends to consolidate with potential for a recovery toward the upper end of the range as short positions are covered and risk appetite improves. Key risks to long positions are faster non-OPEC+ supply growth, softer Asian demand, and a lack of geopolitical premium in the news flow.
Trade recommendation: BUY 64.00, SL 61.80, TP 70.60

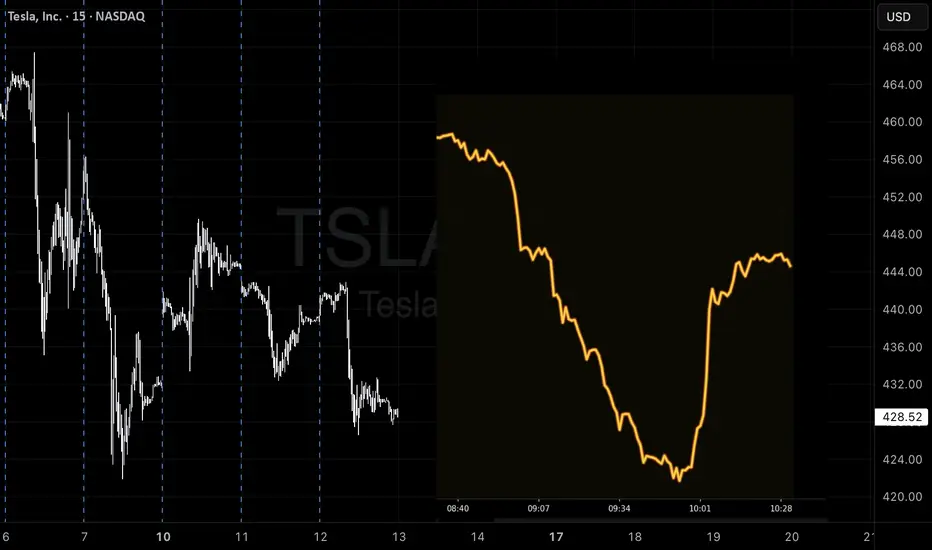
TSLA 1M AI Prediction📊 TSLA 1M AI Prediction – 2025-11-12
Current Price: $442.35
Trend: Neutral
Confidence: 55%
Volatility: 14.7%
Trade Signal:
Direction: Short
Entry Price: $442.35
Target: $440.50 (-0.52%)
Stop Loss: $448.99
Expected Move: -0.52%
30min Target: $440.31 (-0.46%)
Insight:
Katy AI predicts a small downward move in the short term
Low-moderate confidence; trade with proper risk management
Market trend is neutral, so position sizing should remain cautious
SKYGOLDLooks good on Chart.
Breakout Visible.
Above all key EMA.
Good for Short Term.
Target 410,500.
Do Like ,Comment , Follow for regular Updates...
Keep Learning ,Keep Earning...
Disclaimer : This is not a Buy or Sell recommendation. I am not SEBI Registered. Please consult your financial advisor before making any investments . This is for Educational purpose only.

Market Insights with Gary Thomson: 20 - 24 OctoberMarket Insights with Gary Thomson: Canada, UK & US Inflation, UK Retail Sales, Earnings Reports
In this video, we’ll explore the key economic events and market trends, shaping the financial landscape. Get ready for expert insights into financial markets to help you navigate the week ahead. Let’s dive in!
In this episode of Market Insights, Gary Thomson unpacks the strategic implications of the week’s most critical events driving global markets.
👉 Key topics covered in this episode:
— Canada’s Inflation Rate
— UK Inflation Rate
— UK Retail Sales
— US Inflation Rate
— Corporate Earnings Reports
Gain insights to strengthen your trading knowledge.
This video represents the opinion of the Companies operating under the FXOpen brand only. It is not to be construed as an offer, solicitation, or recommendation with respect to products and services provided by the Companies operating under the FXOpen brand, nor is it to be considered financial advice.

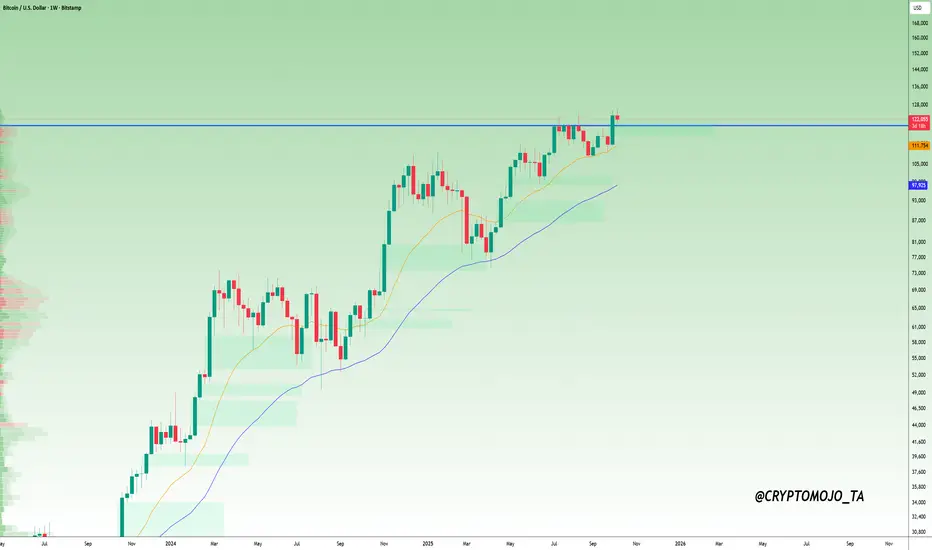
#Bitcoin Weekly Update !!#BTC UPDATE
#Bitcoin has printed a new weekly high, confirming the ongoing strength of the broader uptrend. Both the 21 EMA (yellow) and the 55 EMA (green) are trending upward, indicating that medium-term momentum remains bullish.
The key structural level to focus on is the former weekly resistance around $120,000, which Bitcoin has successfully broken above. As long as the price holds above this level on a closing basis, the bullish bias will remain intact.
If the breakout holds, the next potential target lies in the mid-$130K range.
However, if Bitcoin closes below $120,000, the move would be neutralized, potentially opening the door for a retest of the EMAs in the $112K–$114K zone.
For now, both the trend structure and EMAs suggest that the continuation of this bullish trend is likely.
Market Insights with Gary Thomson: 6 - 10 OctoberMarket Insights with Gary Thomson: FOMC Minutes & Powell’s Speech, Canada Jobs, RBNZ Rate Decision
In this video, we’ll explore the key economic events and market trends, shaping the financial landscape. Get ready for expert insights into financial markets to help you navigate the week ahead. Let’s dive in!
In this episode of Market Insights, Gary Thomson unpacks the strategic implications of the week’s most critical events driving global markets.
👉 Key topics covered in this episode:
— FOMC Minutes and Fed Powell’s Comments
— Canada’s Unemployment Rate
— RBNZ Interest Rate Decision
Gain insights to strengthen your trading knowledge.
This video represents the opinion of the Companies operating under the FXOpen brand only. It is not to be construed as an offer, solicitation, or recommendation with respect to products and services provided by the Companies operating under the FXOpen brand, nor is it to be considered financial advice.

Weekly Market Wrap: Nifty, BankNifty & S&P 500 OutlookNifty closed the week at 24894, gaining 240 points from the previous week. The index made a high of 24904 and a low of 24587, once again respecting the range I mentioned last week — 25050–24250.
From the week’s low of 24587, we’ve seen a sharp bounce back toward 24900, exactly as projected.
Nifty Outlook for Next Week
For the coming week, I expect Nifty to trade between 25300–24500.
A breakout or breakdown beyond this range could bring some real fireworks
Bullish Scenario:
If Nifty sustains above 24900/24950 on Monday, we could see a rally toward 25300, supported by strength in Banking, Financials, and Metal sectors.
Bearish Scenario:
Below 24750, bears might get an opening to drag Nifty toward 24500 — though, as of now, that looks less likely unless global sentiment weakens.
⚠️ Caution:
While short-term momentum looks positive, the monthly and weekly charts of Nifty still lack strong bullish confirmation. Those waiting to capture a big 800–1000-point breakout move should be patient until we see a clear bullish crossover on higher timeframes.
Sector Spotlight: Metals
As mentioned last week, Metals continued to shine, with the Metal Index up 4% this week!
It also gave an all-time high weekly close above 10220, a key breakout level.
If it sustains above 10220 next week, the index can rally another 4% toward the next major resistance at 10709.
👉 Keep your eyes on metal stocks hitting new all-time highs (ATHs) — momentum could stay strong here.
BankNifty Update
BankNifty is forming a W pattern on the weekly timeframe — a strong bullish reversal formation.
Stay alert for potential breakouts in leading banking stocks, as they might fuel the next leg of the rally.
Global Cues – S&P 500
The S&P 500 gave an all-time high close at 6715, up 72 points from last week.
If it sustains above 6700, expect a move toward 6780.
For investors already long — move your trailing SL to 6560 to protect profits.
For those waiting to enter — 6568/6570 offers a better risk–reward entry zone.
Key Takeaways
✅ Nifty range for next week: 25300–24500
✅ Bulls need 24950+ for continuation; bears only active below 24750
✅ Metals remain the sector leader
✅ BankNifty W pattern could fuel the next upmove
✅ S&P 500 remains in a strong uptrend — global sentiment supportive

Market Insights with Gary Thomson: 22 - 26 SeptemberMarket Insights with Gary Thomson: US Durable Goods, GDP Final, PCE, Personal Income & Spending
In this video, we’ll explore the key economic events and market trends, shaping the financial landscape. Get ready for expert insights into financial markets to help you navigate the week ahead. Let’s dive in!
In this episode of Market Insights, Gary Thomson unpacks the strategic implications of the week’s most critical events driving global markets.
👉 Key topics covered in this episode:
00:16 — US Durable Goods Orders
01:09 — US GDP Growth Rate QoQ Final
01:54 — US PCE Price Index, Personal Income & Personal Spending
03:00 — Trade Tensions
Gain insights to strengthen your trading knowledge.
This video represents the opinion of the Companies operating under the FXOpen brand only. It is not to be construed as an offer, solicitation, or recommendation with respect to products and services provided by the Companies operating under the FXOpen brand, nor is it to be considered financial advice.

Market Insights with Gary Thomson: 1 - 5 SeptemberMarket Insights with Gary Thomson: UK Retail Sales, Canada Jobs, US NFP, and OPEC+ Meeting
In this video, we’ll explore the key economic events and market trends, shaping the financial landscape. Get ready for expert insights into forex and commodities to help you navigate the week ahead. Let’s dive in!
In this episode of Market Insights, Gary Thomson unpacks the strategic implications of the week’s most critical events driving global markets.
👉 Key topics covered in this episode:
— UK Retail Sales
— Unemployment Rate in Canada
— US NFP and Unemployment Rate
— OPEC+ Meeting
— Trade Tensions
Gain insights to strengthen your trading knowledge.
This video represents the opinion of the Companies operating under the FXOpen brand only. It is not to be construed as an offer, solicitation, or recommendation with respect to products and services provided by the Companies operating under the FXOpen brand, nor is it to be considered financial advice.

UROY LongAnalysis
* Long accumulation phase formed a value area
* Maninpulation below the accumulation into weekly Fair Value Gap
* Subsequent initial distribution
* Pullback into equilibrium of the accumulation range and half way back measured move off the manipulation low
Trade Frame - Entry
* (Already partially at the pullback into the value area)
* Continuation of the bullish order flow on activation of the next weekly order block
Trade Frame - Profit targets
* At all time high
* 2 - 2.5 Standard deviations of the manipulation leg
