US Dollars Index weekly (DXY )The index is still moving inside a long-term descending channel.
Price remains below the major descending trendline, which keeps the primary bias bearish on the higher timeframe.
The recent move creates a falling wedge with Wolfe wave which indicates that the price will be rise up to 103-104.7.
Resistance:
100.0–101.0 (near-term)
103.8–104.7 (strong supply zone)
107–108 (major trendline resistance)
Support:
97.8–97.0 (current reaction area)
95.0
92.0 (channel low / macro support)
Wolfe Wave

BTC with new top head 2026This an analysis for btc to have new top at 136 then 153 after crossing 96
Good lock to everyone

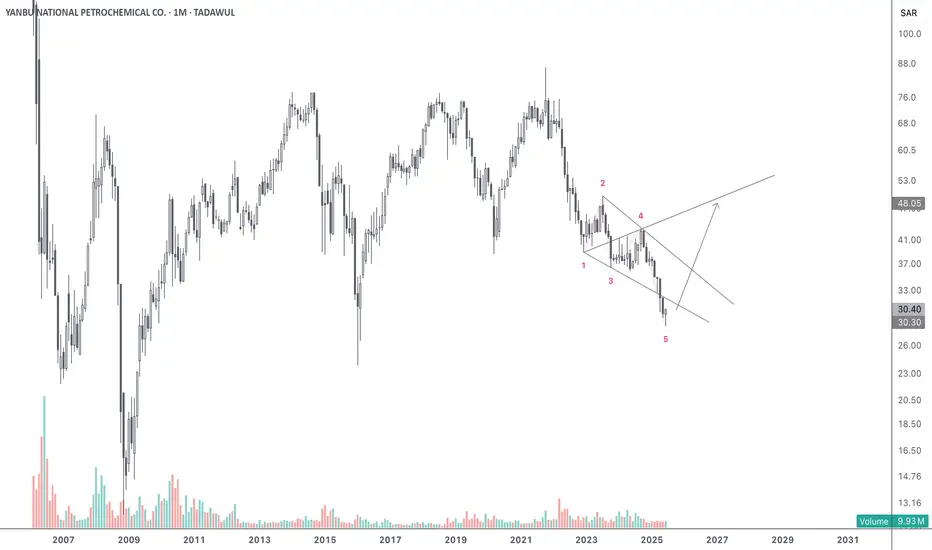
Tasi in future wolfe waveSuadi Tadawul (Tasi) in Weekly Wolfe wave corrections, it is now in forth wave which must be below 9400 to and expected to be returned from 9027 or 7400

AUDCHF (2H)AUDCHF | Bullish Breakout + Retest Setup (2H)
Price reclaimed the previous support zone around 0.51860 – 0.51940 and continued to break the short-term resistance at 0.52120 – 0.52170, shifting structure bullish on the 2H timeframe. Market is now pulling back to retest the breakout zone, which can act as demand for continuation higher.
🧠 Why Bullish?
Clean break above previous resistance (0.52120+)
Market structure flipped to higher highs and higher lows
Two stacked demand zones below, showing strong absorption on the way up
Current pullback likely a retest rather than a reversal (unless breakout fails)
📌 Key Levels
Main Demand Zone: 0.51860 – 0.51940
Breakout / Retest Zone: 0.52120 – 0.52170
Continuation Trigger: Bullish rejection off the retest
🎯 Upside Targets
TP1: ~0.52550 (minor liquidity level)
TP2: ~0.52750 – 0.52800 (major sweep objective / imbalance fill)
❌ Invalidation
Bullish bias invalid if price breaks below 0.51860, meaning demand failed and structure returns bearish.

Wolf Wave formation in NiftyPositional View:
Nifty has made wolf wave pattern and 5th wave has been completed. Now, comes under the parallel channel and made breakdown.
Short Nifty below 25645 for a target of 25085-24500 with a SL of 25835 (SL on 15 min. candle close).
Disclaimer: Sharing my personal market view — only for educational purpose not financial advice.

S&P will decline to 6350 from 6840 in the next 2-5 daysS&P will decline to 6350 from 6840 in the next 2-5 days

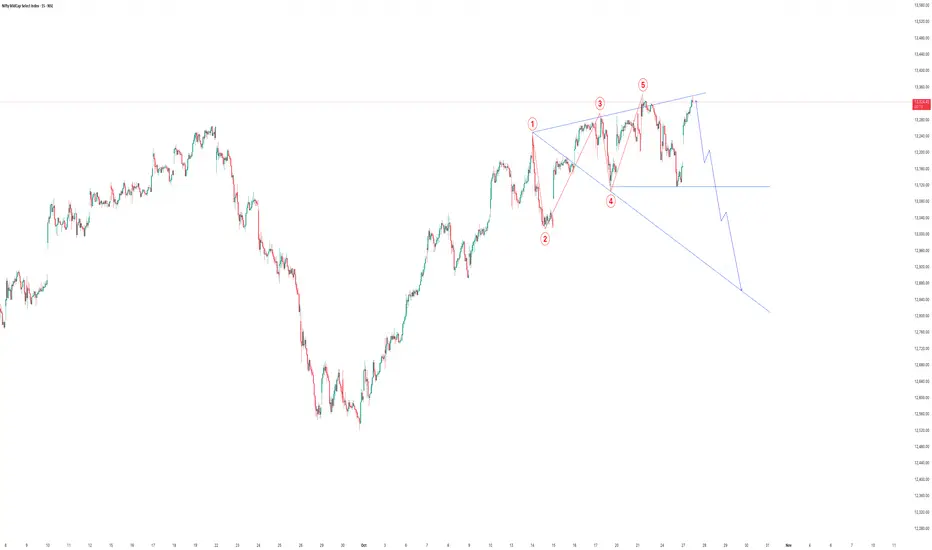
Nifty Midcap Select Index - 15 mins🧩 Pattern Structure: Wolfe Wave (Bearish Formation)
The chart clearly outlines a 5-wave Wolfe structure within a broadening wedge:
Wave 1–2: Sharp corrective fall marking the start of the structure.
Wave 2–3: A strong rally forming the upper resistance trendline.
Wave 3–4: Pullback holding the mid-support region, creating the internal pivot.
Wave 4–5: Final push forming a false breakout above the upper boundary — a classic exhaustion move typical before reversal.
Wave 5 marks the completion of the structure and hints at the beginning of a strong downside impulse toward the “EPA” (Estimated Price at Arrival) line — the projected Wolfe target.
📊 Summary
Parameter Observation
Pattern Type Bearish Wolfe Wave
Completion Point Wave 5 near upper resistance
Breakdown Confirmation Below Wave 4 line (~13,180)
Immediate Targets 13,100 → 12,850 → 12,500
Invalidation Above 13,400
Probability of Downmove ~65–70%
Technical Bias Strong Bearish Setup
🧠 Conclusion
The Nifty Midcap Select Index has likely completed a bearish Wolfe Wave, indicating exhaustion at higher levels.
Once the support line (Wave 4–2) is breached, a sharp impulsive decline toward 12,850–12,500 is probable.
This aligns with a broad market rotation from midcaps to large caps as profit booking accelerates.
Disclaimer:
This analysis is for educational and informational purposes only and should not be construed as financial advice. Market conditions can change rapidly — always manage risk with appropriate stop-loss levels before initiating any trade.
Bullish Wolfe WaveA textbook bullish Wolfe wave has formed with equal timing on the waves. This could be an entry with the target being the previous high

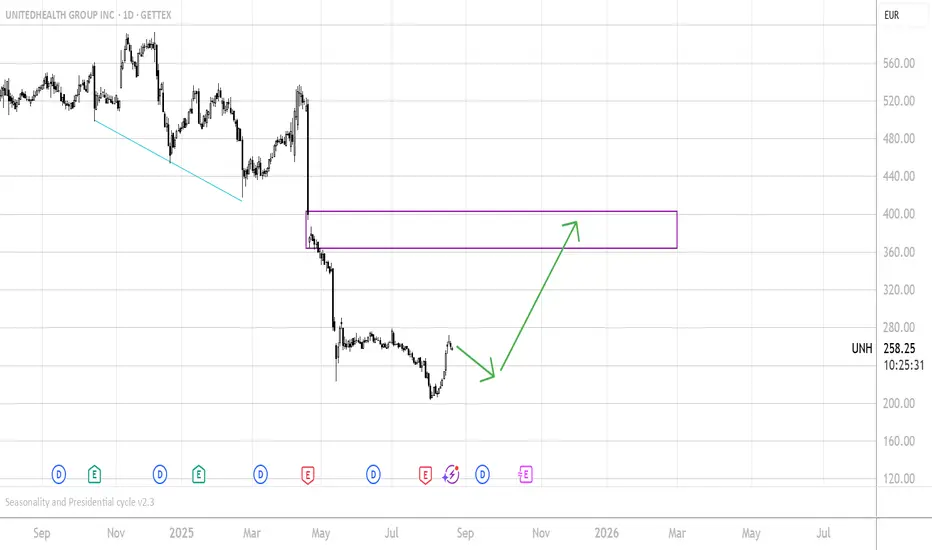
UNITEDHEALTH UNH Long Scenario based on Seasonality and FractalsFrom a fractals Perspective I expect a chance for around 30% gain from an upcoming upmove.
From a Seasonal Perspective I expect a retracement mode until End of Mid/September and then upside until early December.
I hope we make the bigger upmove in this time and complete that move otherwise this fractals target could take some time/moths/years.
Feel free to like / support the Idea, leave a comment or contact me in the chat.
Good luck to all
*this is not a trade call*
Cheers!
GOLD- COMPLEX WOLFE WAVE FORMATION🔹 Pattern Observed
The chart shows a Complex Wolfe Wave structure with points 1–2–3–4–5 clearly mapped.
Price has reached point 5 near the upper resistance (~3,650–3,670 USD).
Wolfe principle: After point 5, price targets the 1–4 trendline → this is your projected drop zone.
🔹 Current Situation
Current Gold price: ~3,645 USD.
Strong rally completed wave 5.
Chart marks Immediate Target: ~3,300 USD.
🔹 Levels & Targets
Resistance: 3,650–3,670 (pattern top).
Immediate Target Zone: 3,300 (near support + Wolfe line).
Extended Target: 3,200–3,150 (if selling pressure deepens).
Invalidation: Above 3,700 (new highs would negate Wolfe setup).
🔹 Trading Implication
Bias: Bearish after wave 5 completion.
Entry: Short near 3,650–3,670 (with confirmation candle).
Stop Loss: Above 3,700.
Targets:
T1 = 3,450
T2 = 3,350
T3 = 3,300
This gives ~350 point downside vs ~50 point risk → R:R ~1:6 if trade is taken near the top.
✅ Conclusion
Gold has likely completed wave 5 of Wolfe structure near 3,650–3,670.
Short-term expectation is a fall toward 3,300, aligning with Wolfe target zone.
Important NOTE - Risk management is crucial — pattern invalidates above 3,700.
⚠️ Disclaimer:
This analysis is for educational purposes only. It is not financial advice. Trading commodities and derivatives involves substantial risk of capital loss. Please consult your financial advisor before acting on this view.

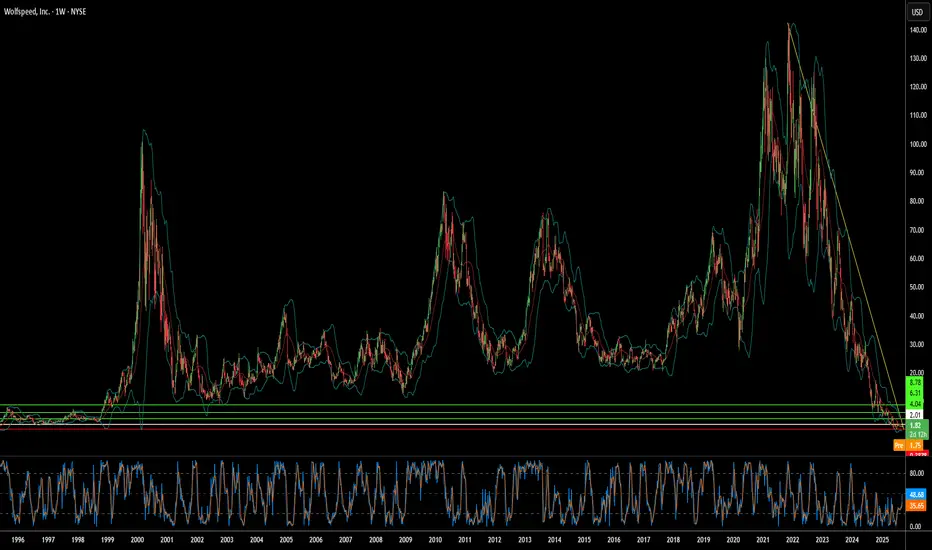
Can Silicon Carbide Save a Bankrupt Chip Giant?Wolfspeed's dramatic 60% stock surge following court approval of its Chapter 11 restructuring plan signals a potential turning point for the struggling semiconductor company. The bankruptcy resolution eliminates 70% of Wolfspeed's $6.5 billion debt burden and reduces interest obligations by 60%, freeing up billions in cash flow for operations and new fabrication facilities. With 97% creditor support backing the plan, investors appear confident that the financial overhang has been cleared, positioning the company for a cleaner emergence from bankruptcy.
The company's recovery prospects are bolstered by its leadership position in silicon carbide (SiC) technology, a critical component for electric vehicles and renewable energy systems. Wolfspeed's unique capability to produce 200mm SiC wafers at scale, combined with its vertically integrated supply chain and substantial patent portfolio, provides competitive advantages in a rapidly growing market. Global EV sales exceeded 17 million units in 2024, with projections of 20-30% annual growth, while each new electric vehicle requires more SiC chips for improved efficiency and faster charging capabilities.
Geopolitical factors further strengthen Wolfspeed's strategic position, with the U.S. CHIPS Act providing up to $750 million in funding for domestic SiC manufacturing capacity. As the U.S. government classifies silicon carbide as critical for national security and clean energy, Wolfspeed's fully domestic supply chain becomes increasingly valuable amid rising export controls and cybersecurity concerns. However, the company faces intensifying competition from well-funded Chinese rivals, including a new Wuhan facility capable of producing 360,000 SiC wafers annually.
Despite these favorable tailwinds, significant risks remain that could derail the recovery. Current shareholders face severe dilution, retaining only 3-5% of the restructured equity, while execution challenges persist regarding ramping the novel 200mm fabrication technology. The company continues operating at a loss with high enterprise value relative to current financial performance, and expanding global SiC capacity from competitors threatens to pressure pricing and market share. Wolfspeed's turnaround represents a high-stakes bet on whether technological leadership and strategic government support can overcome financial restructuring challenges in a competitive marketplace.
FILUSDT — WyckoffIdea / Plan
Structure
Higher-timeframe shows a completed Wyckoff accumulation between 2.20–2.70: SC → ST → Spring (June) → Test (Aug).
Price is printing an LPS inside a contracting triangle. Bands are squeezed; volume declining into the apex.
VPVR shows MP/POC ≈ 2.58–2.60; above it there’s a low-volume pocket up to ~2.85–2.90.
200D MA sits just below 3.0 and lines up with prior AR shelf.
Triggers
Aggressive: reclaim and hold 2.60–2.62 (MP) + break of triangle top.
Conservative: daily close > 2.703 with rising volume.
Add-back on a clean retest of 2.60–2.62 as support.
Targets
T1: 2.70 (range lid)
T2: 2.86–2.90 (LVN/MA confluence)
T3: 3.02–3.12 (AR shelf / supply band)
T4: 3.57–3.60 (major SOS line)
Stretch: if momentum persists, 4.18 then 4.82 (weekly levels / measured extension).
Invalidation & Risk
Primary invalidation of the Wyckoff view: daily close < 2.22 (Spring failure).
Tighter trade-management levels: lose 2.49 → 2.44 (triangle base) and odds favor a revisit of 2.32–2.27; reduce risk there.
If price reclaims 2.60 after a shakeout, treat it as a LPS retest.
Expect stair-step behavior into 3.0–3.6 due to supply overhang; partials on the way up are prudent.
Idea is invalidated on persistent closes back inside 2.20–2.32.
This is a technical plan, not financial advice. Trade your system and size risk accordingly.

BBDelta Insight: Biggest Winners After Bitcoin HalvingThe Bitcoin halving is one of the most anticipated events in the crypto space. In 2024, the latest block reward reduction served as a powerful catalyst for a new bull cycle. In 2025, the cryptocurrency market is growing at an impressive pace, and investors worldwide are seeing record-breaking returns.
The experts at BBDelta analyzed post-halving market behavior, identified the most profitable assets and strategies, and in this article, they reveal who earned the most — and how BBDelta clients used this opportunity to grow their capital.
What Is the Bitcoin Halving and Why Does It Matter?
The Bitcoin halving is a programmed reduction of the block reward by 50%, which occurs approximately every four years. In 2024, the reward dropped from 6.25 BTC to 3.125 BTC.
Why it’s important for investors:
Reduced issuance decreases supply-side pressure
Continued demand creates supply scarcity
Historically, halvings have triggered strong BTC bull runs
After the halvings in 2012, 2016, and 2020, Bitcoin entered major growth cycles. The 2024–2025 period was no exception.
How Did the Market React to the 2024 Halving?
According to BBDelta data:
Bitcoin rose from ~$38,000 in October 2024 to ~$118,000 in August 2025 — +105%
The number of active investors on the BBDelta platform grew by 47%
The average portfolio return for those who invested between Dec 2024 and Jan 2025 reached +94% by August
The market surge was driven not only by the halving, but also by rising institutional interest, DeFi expansion, and new infrastructure developments.
Who Earned the Most? Top 5 Performing Assets (Post-Halving)
1. Solana (SOL)
Growth since Dec 2024: +211%
Drivers: scalability, ecosystem expansion, new DEXs and NFT platforms
2. Ethereum (ETH)
Growth: +134%
Fuelled by active staking, Layer-2 development, and dominance in DeFi
3. Arbitrum (ARB)
Growth: +188%
A leading Ethereum L2 scaling solution, with rapid user and TVL growth
4. Bitcoin (BTC)
Growth: +105%
New cycle kick-off, rising institutional demand, launch of new BTC ETFs
5. Render (RNDR)
Growth: +280%
Riding the trend of decentralized computing and AI-powered graphics
How BBDelta Clients Earned Profits
1. Long-Term Holding (HODL)
Clients who invested in BTC and ETH before or shortly after the halving saw returns ranging from +70% to +130%.
2. Altcoin-Focused Strategy
Those who allocated capital across Solana, Arbitrum, and Render gained +150% to +240%.
3. BBDelta’s Dynamic Strategy
Our automated system rebalanced portfolios monthly based on market signals.
Average return from Jan to Aug 2025: +112%
Real BBDelta Client Cases
Case 1: Investor from Poland
Invested in Dec 2024: $15,000
Portfolio: 40% SOL, 30% ARB, 20% ETH, 10% RNDR
Current Value: $38,600
Return: +157%
Case 2: Investor from UAE
Invested in Jan 2025: $50,000
Strategy: BTC + ETH + staking
Return: +81%
Comment: “No gains without risk — but with BBDelta, I took risks confidently.”
Conclusion: BBDelta investors grow their wealth by applying well-timed, data-driven strategies — especially around major market events like the halving.
How to Maximize Halving in Your Investment Strategy
Buy early — accumulate BTC 3–6 months before the halving
Focus on infrastructure — altcoins that support the BTC/ETH ecosystem tend to outperform
Use BBDelta’s automated strategies — our algorithms monitor entry/exit points
Staking — helps boost returns even during sideways markets
Rebalance regularly — monthly reviews let you reallocate capital into high-potential assets
Why Investors Choose BBDelta
Access to 300+ cryptocurrencies
Algorithmic investment strategies
Automated portfolio rebalancing
High-level asset protection
Personalized analytics reports
BBDelta doesn’t just help you buy crypto — we help you profit from it, while managing risk and adapting to market cycles.
Conclusion
The 2024 Bitcoin halving triggered a new wave of crypto growth. And while BTC did double in price, the biggest profits went to those who focused on altcoins and combined strategies.
BBDelta investors succeeded because they were prepared, informed, and supported by professional tools

2290 Bullish Wolfe WaveA clean bullish Wolfe Wave setup is emerging, with price action completing the fifth wave just outside the channel – a typical trap zone before reversal.
Wave 5 shows early signs of a bullish reaction, suggesting a potential move toward the target line drawn from points (1) to (4).
Hourly SAR moved above priceThis is an earlier signal compared to the standard bearish Wolfewave entry - which is price entering back below the 1-3 line.
Here, I placed a 1:3 risk/reward ratio.
Keep in mind that there could be stop hunters just above the bear risk tolerance.
Next in line in the fractal order to mark a swing high will be the 4 hour SAR.
Standard bearish Wolfewave Target is the 1-4 line.
Alternative Targets are the Magic Lines.
Patterns can fail
Do your own due diligence.

Bearish Wolfewave still in playThe head and shoulders measured move target already got made.
As long as the weekly SAR is above price, the lower targets are still in play.
The bearish Wolfewave target is the 1-4 line.
The magic lines are alternative targets.
Patterns can fail.
Do your own due diligence.

Bearish Wolfewave set upPrice has gone above the 1-3 line.
Short signal is when price enters back below the 1-3 line.
Target will be the 1-4 line.
Alternative targets are the magic lines.
An earlier entry is when the hourly SAR moves above price.
Earlier clues could be seen on the shorter timeframes.
Patterns can fail.
Do your own due diligence.

4 hour bearish Wolfewave morphing into a head and shouldersA neckline line break of a head and shoulders pattern is a more common sell signal.
The earlier sell signal is from the bearish Wolfewave pattern when price entered below the 1-3 line.
An even earlier sell signal was when the 4 hour SAR moved above price.
Earlier sell signals could be seen on the shorter timeframes.
Patterns can fail.
Do your own due diligence.

Bearish Wolfewave in playPrice has entered below the 1-3 line.
Target is the 1-4 line.
Other targets are the intersecting lines which we call the magic line.
As long as at least the 4 hour SAR is above price - those target are in play.
Pattens can fail.
Do your own due diligence.

Measured move target madePrice bounced near the target and has been confirmed by the 4 hour SAR.
The 4 hour SAR is currently on a bearish retrace relative to the daily SAR.
As long as the Daily SAR is above price, the bearish Wolfewave is still in play.
Price is anticipated to go lower than what the 4 hour SAR has established as support.
To see more details and for faster movement, we look to the shorter intervals.
Shorter interval price action could invalidate longer interval patterns.

Bearish Wolfewave target madeThe more confluence - the better.
I combine this pattern with the SAR signal.
The odds also seem better when there’s an rsi divergence.
Typical entry is when price goes back down the 1-3 line.
Ideal target is the 1-4 line.
To spot a potential Wolfewave forming, I usually look for a wave 4 that enters wave 1.
Then, I watch if that wave 4 breaches wave 2.
If not, the next move should be a break above the 1-3 line.
Another thing to look at is if the 2-4 line forms a rising wedge with the 1-3 line ( for a bearish Wolfewave).
Earlier entry for a bearish Wolfewave could be when the SAR of the pattern moves above price.
Another earlier entry is looking for signals on a shorter timeframe.
Patterns can fail.
Do your own due diligence.

Bearish Wolfewave target madeWhat I like about this pattern is the nice risk/reward it has.
The ideal pattern has a drastic and large move that quickly happen.
I added Fibonacci time that intersects the 1-4 target line for alternative targets for scaling out.
This chart has multiple SAR from different timeframes to track potential stop losses of other traders so that we can act accordingly.
Patterns can fail.
Do your own due diligence.
