Natural Gas Full Bear After Inventories!Natural GAs plummeted today on inventory report.
The consensus was for 76BCF build but came in higher at 80BCF build.
This demonstrates less demand and higher production.
The technical picture is slowly starting to breakdown for Nat Gas...the bulls need to do something quick to firm up price or we run the risk of the weekly downtrend taking hold.
next key area to watch will be a retest of the 3.30 zone.
Simultaneously you need to be monitoring inter market analysis (ie. watch Nat gas resource stock to see how their price action responds).
We booked profits on a small Boil long scalp today.
WTI

WTI to $55 amid excess supply concerns?There was some relief at the start of the week for oil prices as traders reacted to the weekend news of de-escalation in the trade war between the US and China and figured that a potential extension of the tariff truce would be net positive for the demand outlook. However, the recovery stalled as WTI prices couldn’t break above $60 per barrel and have since turned flat on the week. The bearish trend thus remains intact for oil. Here, investors are concerned about the excess supply of the stuff hitting the markets, as the OPEC+ is gradually releasing some withheld oil supplies to win back market share. The group’s plan is to increase production by a total of 1.65 million barrels per day by the end of 2025. It has already increased output by 137K bpd from October. Against a backdrop of increasing supplies, it looks like WTI is heading towards the April lows of around $55.00 again.
By Fawad Razaqzada, market analyst with FOREX.com

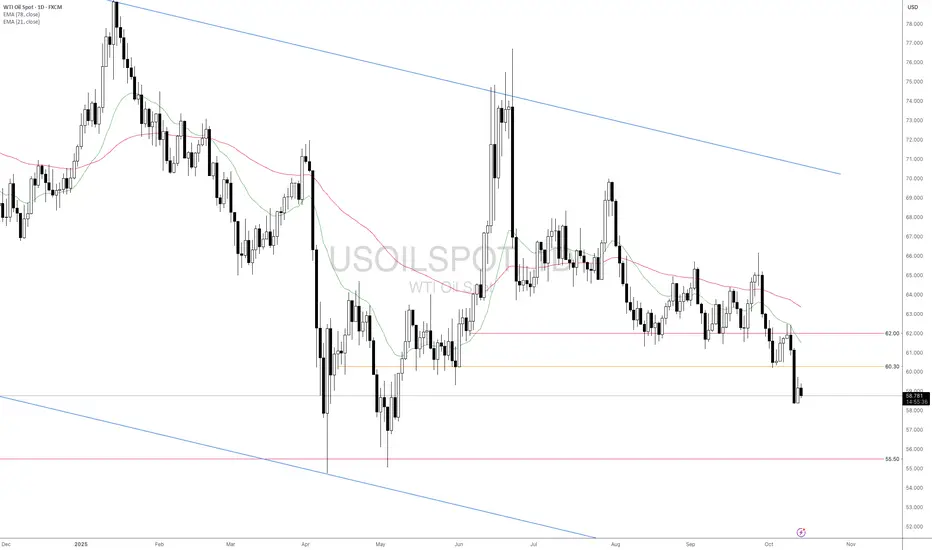
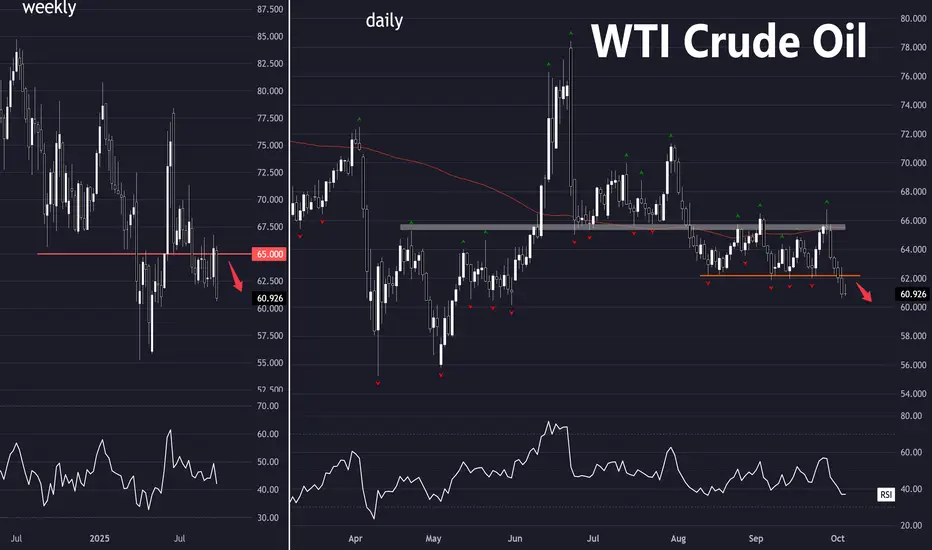
WTI Crude Oil: What Could Happen Next?Oil prices are sitting at a really important spot right now. Here’s what to watch for:
If the price drops below $58.28, it could keep falling toward $50.
If it breaks below $50, we might see it slide into the $43–$46 range.
But if oil climbs back above $65, it could run up toward $74 again.
So in simple terms:
👉 Below $58 = could fall more
👉 Above $65 = could rise again
We’re in a “wait and see” zone ; the next move will show which way oil really wants to go.
If you’re watching this market and not sure what these levels mean for your trades, feel free to DM us ; happy to break it down in plain English or share how I’m looking at it myself.
Mindbloome Exchange

Will US–China trade tensions continue to weigh on oil prices?
Deepening US–China trade tensions ahead of the APEC summit are putting downward pressure on oil prices. China’s Commerce Ministry announced sanctions on five US subsidiaries of Hanwha Ocean and imposed new port fees on American vessels.
Meanwhile, President Trump accused Beijing of deliberately halting soybean purchases to pressure US farmers and warned of possible retaliatory measures, including ending trade in edible oils and other sectors.
USOIL extended its downtrend, falling below 60.00, with diverging bearish EMAs indicating a possible continuation of bearish momentum. If USOIL fails to close above 60.00, the price may retreat below 57.00. Conversely, if USOIL breaches above 60.00 and EMA21, the price may advance toward 62.00.

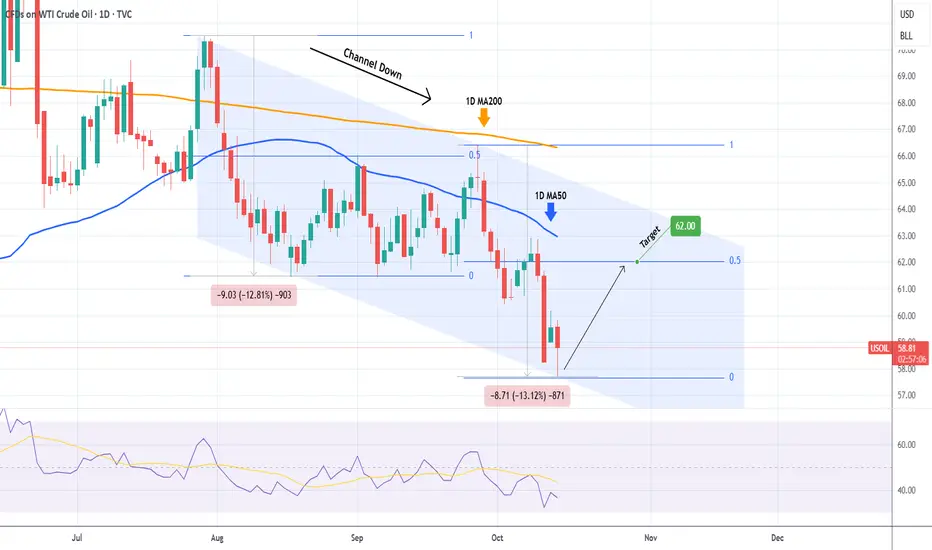
WTI OIL hit the Channel Down bottom. Buy Signal.WTI Oil (USOIL) has been trading within a Channel Down since the July 30 High and today it hit its bottom (Lower Lows trend-line). The decline from the recent Lower High was around -13%, similar to the previous Bearish Leg.
When that bottomed (Lower Low), it rebounded towards its 1D MA50 (blue trend-line) and peaked (Lower High) marginally above the 0.5 Fibonacci retracement level. As a result, we expect a new Bullish Leg to start now, with our Target at $62.00.
-------------------------------------------------------------------------------
** Please LIKE 👍, FOLLOW ✅, SHARE 🙌 and COMMENT ✍ if you enjoy this idea! Also share your ideas and charts in the comments section below! This is best way to keep it relevant, support us, keep the content here free and allow the idea to reach as many people as possible. **
-------------------------------------------------------------------------------
💸💸💸💸💸💸
👇 👇 👇 👇 👇 👇
USOIL Pressured by Trade Tensions and Oversupply Concerns
Fundamental approach:
- USOIL prices declined this week, pressured by renewed US-China trade tensions and persistent concerns about oversupply.
- USOIL fell following President Trump's threat of additional 100% tariffs on Chinese goods, starting 1 Nov, which reignited fears of reduced global energy demand from the world's largest consumers.
- In addition, easing Middle East tensions removed risk premiums, capping gains. OPEC+ is continuing its production increases, with the group adding 137k bpd in Nov.
- US crude inventories also rose by 3.7 mln barrels in early Oct, exceeding analyst expectations and reinforcing concerns about a supply glut.
- Prices may face further downward pressure as global inventory builds are expected to average 2.6 mln barrels per day through 4Q. However, any progress in US-China trade negotiations or unexpected supply disruptions from Eastern Europe could provide upside support.
Technical approach:
- USOIL strongly declined after retesting EMA21. The price created lower swings, indicating bearish momentum persists.
- If USOIL remains below the resistance at 60.30, the price may continue to decline toward the following support at 55.50.
- On the contrary, closing above 60.30 may prompt a further correction to retest the following resistance at 62.00.
Analysis by: Dat Tong, Senior Financial Markets Strategist at Exness
WTI Crude Oil – Elliott Wave Analysis🛢️ WTI Crude Oil – Elliott Wave Analysis
Wave Structure · Smart Money · Fib Confluence · Price Action
🔎 Market Context & Overview
WTI Crude Oil remains one of the most critical and closely watched commodities in the global market. After decades of dramatic price swings driven by geopolitical events, supply shocks, and evolving demand patterns, the market now appears poised at a pivotal juncture. Combining Elliott Wave theory , Smart Money Concepts , Fibonacci retracements & extensions , and price action analysis with fundamental macro insights reveals a compelling narrative: Crude is concluding a prolonged corrective phase and preparing for a significant breakout. This analysis breaks down each wave, highlighting key technical and fundamental factors shaping the future trajectory of oil prices.
🔹 Wave 1 – Early Impulse (1970s–1985)
📉 Technicals: Formed the foundational uptrend post-oil embargo.
🧠 SMC: Accumulation following global inflation shock.
📊 Fib: Initial rally; shallow extension, not impulsive in character.
🌍 Macro: Oil embargo, inflation, and a restructuring of global energy markets gave birth to this initial move.
🔹 Wave 2 – Complex Correction (1985–1999)
🔁 Technicals: Multi-decade W-X-Y corrective pattern, fully retracing Wave 1.
🧠 SMC: Smart Money accumulation masked by long-term bearish structure.
📊 Fib : Deep correction toward 78.6%, classic for Wave 2.
🌐 Macro: OPEC instability, Gulf War, rising non-OPEC supply, and suppressed demand through globalization.
🔹 Wave 3 – Supercycle Rally (1999–2008)
🚀 Technicals: Powerful impulsive rally, achieving 1.618 Fib extension of Wave 1.
🧠 SMC: Clear Break of Structure (BoS) in early 2000s; institutions led the markup.
📊 Fib: Ideal third-wave behavior — extended and directional.
📈 Macro: China-led supercycle, supply bottlenecks, geopolitical conflict, and a commodities renaissance pushed oil to $147.27.
🔹 Wave 4 – Still In Progress (2008–2026 est.)
🔄 Technicals: Long, complex W-X-Y-X-Z or potential triangle; entering final E-leg now.
🧠 SMC: Liquidity grabs during COVID (2020) and 2022–24 highs; Smart Money sweeping both ends.
📊 Fib: Final leg projected to terminate near 0.5 retracement of Wave 3 (~$47.55).
🔍 Price Action: Distribution in 2011–14, liquidation in 2020, false rallies, and compression since 2022.
🧨 Macro: GFC aftermath, shale oversupply, COVID demand crash, ESG underinvestment. Currently driven by energy policy chaos and geopolitical rebalancing.
⏳ Wave 4 is near completion , with the final move expected to tag the 0.5 retracement before reversal.
🔹 Wave 5 – Upcoming Macro Breakout (2026–2032 est.)
⚡ Technicals: Expected impulsive breakout wave toward price discovery.
🧠 SMC: Anticipate Break of Structure (BoS) above $147 for confirmation of markup phase.
📊 Fib: Target zone between previous high ($147) and 2.618 extension (~$366.58).
🔥 Macro: Long-term underinvestment, peak cheap oil, geopolitical tension (Russia, Middle East), energy transition bottlenecks. Inflation & policy shifts will add fuel.
📍 This is the final leg of the cycle and could mirror or even exceed the explosiveness of Wave 3 due to multi-decade supply-demand imbalances.
✅ Final Summary
Crude Oil is completing its Wave 4 correctio n, expected to bottom around $47.55 — the 0.5 retracement of Wave 3 . The corrective structure is nearly exhausted, showing signs of Smart Money accumulation and multi-leg exhaustion. Once Wave 4 completes, a powerful Wave 5 is expected to begin, targeting $195–$366 , driven by macro energy scarcity, inflation, and long-term capital flow back into commodities.
This is a strategic inflection zone — where technical compression meets macro ignition.
"Master the waves, follow the smart money, and let Fibonacci guide your path to consistent trading success." — FIBCOS
#WTICrudeOil #ElliottWave #Fibonacci #SmartMoneyConcepts #WaveTheory #TechnicalAnalysis #TradingStrategy #OilTrading #CommodityAnalysis #MarketCycles #PriceAction

Hellena | Oil (4H): SHORT to support area of 58.884Colleagues, it appears that the downward movement is not over and I see several reasons to continue to look short.
The higher order wave “C” is looking to complete the correction and I expect the start of the middle order wave “3” to see the low update and reach the support area at 58.884.
Fundamental context
Oil remains under pressure as supply increases and demand outlook weakens. OPEC+ decided to slightly raise output for November, while U.S. inventories keep growing. Crude lost about 8% last week, and EIA now expects lower prices by the end of the year — all of which supports the idea of a continued downside move within wave “3” toward the 58.884 support area.
Manage your capital correctly and competently! Only enter trades based on reliable patterns!

BRIEFING Week #41 : Havoc on CryptosHere's your weekly update ! Brought to you each weekend with years of track-record history..
Don't forget to hit the like/follow button if you feel like this post deserves it ;)
That's the best way to support me and help pushing this content to other users.
Kindly,
Phil

WTI Oil Shorting Opportunity | Technical + Macro Confirm📌 WTI CRUDE OIL | Money-Making Thief Plan 🛢️ (Swing/Day Trade)
🗡️ Thief Strategy Plan (Bearish Bias)
Plan: Bearish setup confirmed — sellers in control after MA rejection of bulls 📉
Entry (Layered Style):
63.000 🔪
62.500 🔪
62.000 🔪
61.500 🔪
(You may increase or adjust layers based on your own plan)
Stop Loss (Thief SL): @64.000 ❌
⚠️ Adjust SL according to your risk & strategy
Target (Thief TP): Key resistance zone + overbought trap @4.6700 🎯
Note: Dear Ladies & Gentlemen (Thief OG’s) — I don’t recommend locking only my TP. Take your profits wisely & manage risk responsibly. 💰
❓ Why This Plan?
Moving average rejection confirms sellers’ dominance ⚔️
Technical indicators showing strong sell bias 📉
Layered entry strategy helps in catching moves efficiently 🎯
Oversupply risk + weak demand = bearish fuel 🔥
Retail & institutions both leaning short-side heavy 🐻
🔍 Market Analysis (Technical + Fundamental + Macro + Sentiment)
📊 Real-Time Price Action - Sep 05
Daily Change: -1.03%
Monthly Change: -2.84%
Yearly Change: -8.44%
😊 Retail & Institutional Sentiment
Retail Traders: 35% 🐂 | 55% 🐻 | 10% 😐
Institutional Traders: 30% 🐂 | 60% 🐻 | 10% 😐
🌡️ Fear & Greed Index
Current: 25/100 — Fear 😟
Mood: Cautious, driven by oversupply fears + weak demand
⚒️ Fundamental Score: 40/100 (Bearish)
U.S. crude inventories unexpectedly +2.42M vs. -2.19M expected 📈
OPEC+ considering production increase 🌍
Weak China demand signals 📉
🌐 Macro Score: 35/100 (Bearish)
Fed rate cut expectations (25bp likely in September) 💸
Global slowdown fears 🌎 (Europe + Asia weak data)
Geopolitical risks (Russia-Ukraine) limited impact 🚨
🏁 Overall Market Outlook: Bearish (Short Bias) 🐻
Declining prices + rising inventories + OPEC+ supply hike risk
Technicals = Strong Sell (daily/weekly)
Sentiment favors sellers across the board
🔮 Key Takeaway
WTI/USOIL remains heavy under supply pressure + demand weakness.
Market sentiment is fearful, with both retail & institutions leaning short.
⚡ Keep eyes on U.S. jobs data + OPEC+ decisions for any trend shifts.
📌RELATED PAIRS TO WATCH
BRENT CRUDE ( TVC:UKOIL ): $66.42 (-1.8% daily)
NATURAL GAS ( FX:NGAS ): $2.84 (-0.7% daily)
ENERGY ETFS: XLE, USO, UCO
OANDA:CADJPY : Oil-correlated currency pair
ENERGY STOCKS: NYSE:XOM , NYSE:CVX , NYSE:COP , NYSE:SLB
✨ “If you find value in my analysis, a 👍 and 🚀 boost is much appreciated — it helps me share more setups with the community!”
#USOIL #WTI #CrudeOil #ThiefTrader #EnergyMarkets #Commodities #OPEC #SwingTrade #DayTrade #OilAnalysis

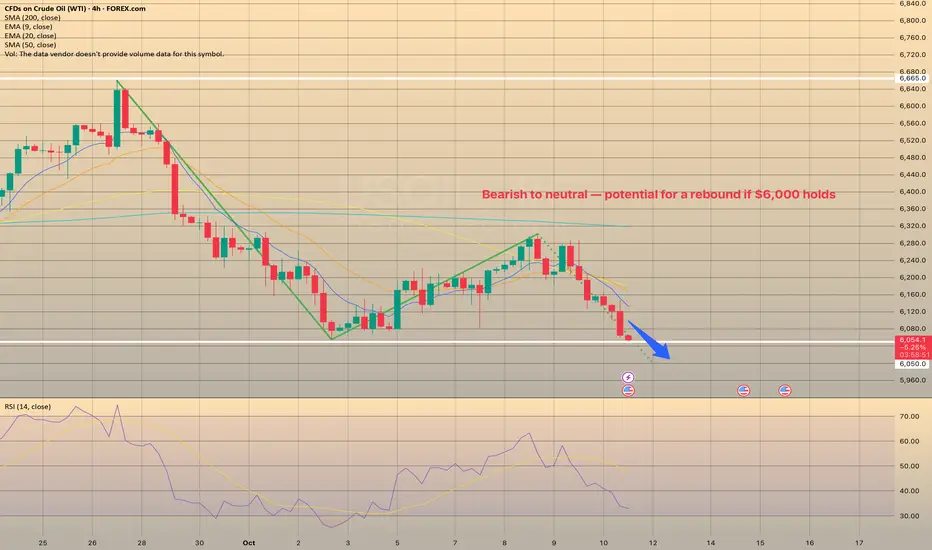
Oil Market: Bearish to neutral — potential for a rebound if $6,0Oil Market: Bearish to neutral — potential for a rebound if $6,000 holds
Crude and gasoline prices fell on Oct. 9 as market sentiment shifted amid rising supply expectations.
OPEC+ agreed to raise output by 137,000 bpd starting November, well below expectations of a 500,000 bpd hike. The group continues to unwind earlier cuts, aiming to restore 1.66 million bpd of production by year-end. OPEC’s September output rose 400,000 bpd to 29.05 million bpd, a 2.5-year high.
On Oct. 10 supply concerns eased after Israel accepted a U.S.-brokered cease-fire deal in Gaza, reducing geopolitical risk premiums. Still, new U.S. sanctions on Iran—targeting over 50 entities linked to oil and LPG trade—helped limit further losses.
Russian supply disruptions remain a supportive factor after drone attacks forced shutdowns at key refineries, while floating storage volumes fell 7% week-on-week to 82.8 million barrels, signaling tighter near-term supply.
Meanwhile, Iraq’s plan to resume Kurdish exports (up to 500,000 bpd) could weigh on prices, offsetting some of the geopolitical support.
EIA data showed U.S. crude inventories 4.5% below the 5-year average, with production up 0.9% w/w to 13.63 million bpd, near record highs. Active U.S. oil rigs slipped by two to 422, just above the four-year low.
Outlook:
Crude oil continues to display a bearish short-term structure, extending its recent downtrend after failing to sustain above the $6,300–$6,350 resistance zone. The price has now revisited the local support area around $6,050–$6,000, which has acted as a key pivot level in recent sessions.
ANZ Research expects near-term downside risks amid higher OPEC+ supply and weaker refinery demand, though low stockpiles outside China may cushion prices into 2026.
A clean rebound from $6,000 could trigger a short-covering move toward $6,200–$6,300.
CRUDE OIL REBOUND AHEAD|LONG|
✅WTI OIL has tapped into the demand level after a sharp decline, showing signs of accumulation. A reaction from this discount area could drive price higher toward 61.10$, where liquidity above minor highs is resting. Time Frame 2H.
LONG🚀
✅Like and subscribe to never miss a new idea!✅

USOIL – Buy SetupTimeframe: H1
Current price: 62.40 USD/barrel
Trade idea:
Buy USOIL 62.30–62.40
🎯 Target: 63.90
🛑 Stop loss: 61.74
📈 R:R ≈ 1:3
Technical basis:
Price retested the breakout trendline and held above SMA89 (bullish confirmation).
Strong rebound from Fib 0.236 zone (62.28).
Momentum building toward 63.9 resistance area.
Comment:
Short-term rebound expected after correction. Maintain buy bias while price >61.8.

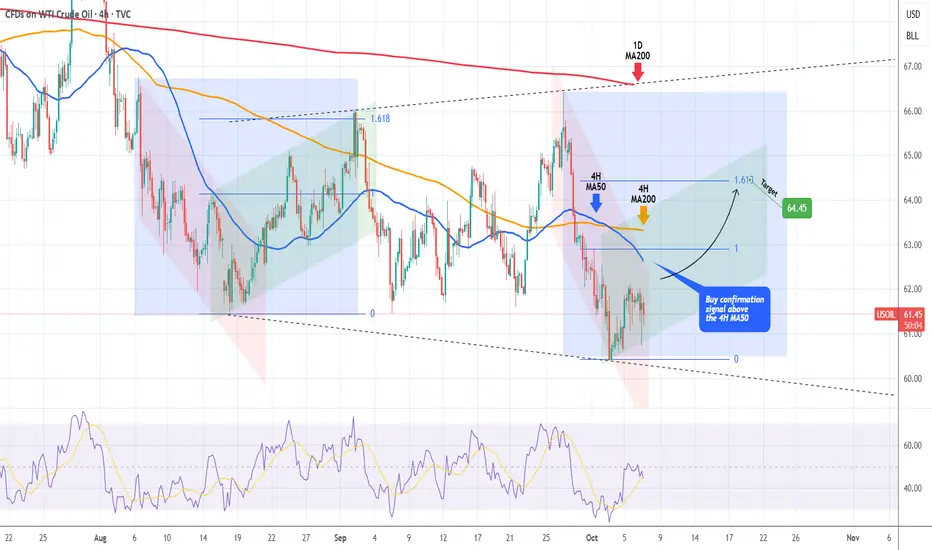
WTI OIL Megaphone bottomed but 4H MA50 gives the signal.WTI Oil (USOIL) has been trading within a Megaphone pattern since the August 18 Low and last Thursday made its latest Lower Low. The 4H RSI instantly rebounded along with the price, after turning oversold (<30.00).
This is technically the start of the pattern's new Bullish Leg. The last one confirmed its start after the price broke above the 4H MA50 (blue trend-line). If it does again, we will take it as a buy signal, targeting the 1.618 Fibonacci at $64.45.
-------------------------------------------------------------------------------
** Please LIKE 👍, FOLLOW ✅, SHARE 🙌 and COMMENT ✍ if you enjoy this idea! Also share your ideas and charts in the comments section below! This is best way to keep it relevant, support us, keep the content here free and allow the idea to reach as many people as possible. **
-------------------------------------------------------------------------------
💸💸💸💸💸💸
👇 👇 👇 👇 👇 👇
BRIEFING Week #40 : What could cause VIX>100Here's your weekly update ! Brought to you each weekend with years of track-record history..
Don't forget to hit the like/follow button if you feel like this post deserves it ;)
That's the best way to support me and help pushing this content to other users.
Kindly,
Phil

CRUDE OIL Will Keep Falling! Sell!
Hello,Traders!
CRUDE OIL retested the horizontal supply area cleanly and is now forming a pullback, confirming Smart Money’s intent to continue distribution. Liquidity above recent highs is likely absorbed, with price expected to target 60.10$ to rebalance inefficiency and continue bearish flow.Time Frame 3H.
Sell!
Comment and subscribe to help us grow!
Check out other forecasts below too!
Disclosure: I am part of Trade Nation's Influencer program and receive a monthly fee for using their TradingView charts in my analysis.

Key pivot resists followed by breakdown (WTI Crude)Setup
Bearish. Breakdown
Bearish engulfing candle
Failure at key 65.0 pivot
Signal
Looking to sell while price holds below support-turned-resistance at 62.
(Watch for possible intraday fakeout above 62 before daily close lower)
Agree / disagree? Let me know - happy to discuss :)
USOIL WILL GO DOWN|SHORT|
✅WTI OIL Price rejects supply after distribution and forms bearish orderflow, ICT suggests liquidity is being targeted below. Market likely seeks drawdown into 60.00 demand imbalance. Time Frame 4H.
SHORT🔥
✅Like and subscribe to never miss a new idea!✅

Hellena | Oil (4H): SHORT to support area of 60 (Wave 3).The price is still not reaching the target of 60. I decided to make a new forecast, slightly changing the labeling of waves, or rather their importance.
At this stage, as before, I think that the price will reach the area of the level 60 in the middle wave “3”.
This movement is the development of the big corrective wave “C”. In general, the plan remains the same.
Manage your capital correctly and competently! Only enter trades based on reliable patterns!

Oil prices extend losses on supply concernsOil prices extend losses on supply concerns
Oil prices slipped Thursday, extending last week’s decline on oversupply worries and uncertainty from the U.S. government shutdown. Expectations that OPEC+ may raise output by up to 500,000 bpd in November, along with forecasts of a potential glut, weighed on sentiment.
Geopolitical risks remain in focus, with the G7 vowing tighter controls on Russian oil and the U.S. set to aid Ukraine with intelligence for strikes on energy infrastructure. Still, Chinese stockpiling helped limit losses. Concerns over Russian supply disruptions and steady Chinese stockpiling provided some support, but U.S. data showing rising crude and fuel inventories added to bearish pressure.

Oil Playing Twister: Triple Bottom or Quadruple Pretzel?A Triple Bottom Walks Into a Bar…
Crude Oil (CL) has been busy doing something traders love and hate at the same time: building bottoms. First, it carved a neat Triple Bottom on the daily chart — textbook stuff. Everyone lined up at 66.68 waiting for the breakout champagne to pop.
But what did price do? Instead of exploding higher, it slammed on the brakes and took a detour straight back to support. Typical CL — always keeping traders on their toes.
Now we’re staring at the possibility of a Quadruple Bottom. Not a typo. Yes, they exist, but you don’t see them every day. Like spotting a unicorn in Times Square.
Why We Care About 66.68
That level isn’t just random. It’s the line where:
The Triple Bottom neckline lives.
The Supertrend upper band hangs out.
And, conveniently, the breakeven of our options spread sits.
In other words: get above 66.68 and suddenly this setup has wings. Target? Around 70.63, where UFO resistance is waiting to greet us.
The Fun Part: Bull Call Spread
Instead of swinging a giant futures bat and risking unlimited pain, we play it smarter with a Bull Call Spread:
Buy the 65 Call (Nov-17)
Sell the 71 Call (Nov-17)
Pay about 1.75 points (≈ $1,750 per standard spread, ≈ $175 if you go micro).
That’s it. Risk capped, reward mapped. Max loss? $1,750. Max gain? $4,250.
And yes, the breakeven is… drumroll… 66.8. Same line as the chart breakout. Love when math and pictures line up.
Plot Twist: Cheaper Now, But…
Here’s the kicker: because price dipped back into support, the spread might actually be cheaper right now. Sounds good, right?
But there’s a catch. Waiting for the breakout confirmation could make the spread pricier later, shrinking your reward-to-risk. Classic trading dilemma: do you want cheaper tickets with less confirmation, or more expensive tickets after the bouncer checks your ID?
Risk in 3 Sentences
Keep your trade size sane.
Don’t marry the setup if price dumps below the bottoms.
If CL rushes toward 70, take the money and run (or at least roll the short strike higher).
Bottom Line
Crude Oil is still building its base. Maybe it’s a Triple Bottom. Maybe it becomes the rare Quadruple Bottom collectors dream about. Either way, the play is the same: breakout above 66.68, aim for 70.63, and do it with a defined-risk Bull Call Spread that doesn’t keep you up at night.
Sometimes the market is dramatic. That’s why we trade it. 🎭
Want More Depth?
If you’d like to go deeper into the building blocks of trading, check out our From Mystery to Mastery trilogy, three cornerstone articles that complement this one:
🔗 From Mystery to Mastery: Trading Essentials
🔗 From Mystery to Mastery: Futures Explained
🔗 From Mystery to Mastery: Options Explained
When charting futures, the data provided could be delayed. Traders working with the ticker symbols discussed in this idea may prefer to use CME Group real-time data plan on TradingView: www.tradingview.com - This consideration is particularly important for shorter-term traders, whereas it may be less critical for those focused on longer-term trading strategies.
General Disclaimer:
The trade ideas presented herein are solely for illustrative purposes forming a part of a case study intended to demonstrate key principles in risk management within the context of the specific market scenarios discussed. These ideas are not to be interpreted as investment recommendations or financial advice. They do not endorse or promote any specific trading strategies, financial products, or services. The information provided is based on data believed to be reliable; however, its accuracy or completeness cannot be guaranteed. Trading in financial markets involves risks, including the potential loss of principal. Each individual should conduct their own research and consult with professional financial advisors before making any investment decisions. The author or publisher of this content bears no responsibility for any actions taken based on the information provided or for any resultant financial or other losses.

USOIL STRONG DEMAND AREA|LONG|
✅WTI OIL price reacts at demand level, showing signs of absorption with liquidity grabs. ICT model points to bullish orderflow aiming for the nearby target zone. Time Frame: 4H.
LONG🚀
✅Like and subscribe to never miss a new idea!✅

CRUDE OIL Free Signal! Buy!
Hello,Traders!
CRUDE OIL taps into a horizontal demand area, showing strong bullish reaction. Liquidity beneath recent lows is swept, signalling smart money positioning for upside continuation.
-------------------
Stop Loss: 61.35$
Take Profit: 62.87$
Entry: 61.94$
Time Frame: 8H
-------------------
Buy!
Comment and subscribe to help us grow!
Check out other forecasts below too!
Disclosure: I am part of Trade Nation's Influencer program and receive a monthly fee for using their TradingView charts in my analysis.
