LINK USDT LONG SIGNAL---
📢 Official Trade Signal – LINK/USDT
📈 Position Type: LONG
💰 Entry Price: 14.064
Entry price=2
13.756
---
🎯 Take-Profit Targets (Partial Exits):
• TP1: 14.294
• TP2: 14.515
• TP3: 14.740
• TP4: 14.976
• TP5: 15.316
• TP6: 15.660
---
🛑 Stop-Loss: 13.355
📊 Timeframe: 15m
⚖️ Risk/Reward Ratio: ≈ 2.03 (based on TP6)
💥 Suggested Leverage: 5× – 10×
---
🧠 Technical Analysis Summary
LINK is showing signs of bullish momentum after holding above the key support level around 14.064. The market structure on the 15-minute chart suggests a potential upward move, with higher lows forming and price testing immediate resistance zones. The take-profit levels are aligned with previous swing highs and liquidity concentrations on the higher timeframes.
The critical upside targets are:
14.294 → 14.515 → 14.740 → 14.976 → 15.316 → 15.660
A confirmed break above TP1 (14.294) may accelerate momentum toward the subsequent targets, especially if supported by increasing volume and bullish market sentiment.
---
⚙️ Trade Management Rules
✔ Take partial profit at each TP level
✔ Move stop-loss to entry point once TP1 is reached
✔ Trail stop-loss upward as price advances
✔ No re-entry if stop-loss (13.872) is triggered
✔ Confirm bullish structure and momentum before entering
---
📌 TradingView Hashtags
#LINKUSDT #LINK #CryptoSignal #LongSetup
#TradingView #FuturesTrading #TechnicalAnalysis
---
Disclaimer: Always practice proper risk management and verify market conditions before entering any trade.
X-indicator

My people who is ready to BuyWe have a support zone on that yellow line I’ve put . It’s a lot of buy orders in that area so get ready to grab some buys. I am not so good at explaining but I hope gerrit 😊

EUR/USD Is Compressing — A Breakout Is Getting Close📊 (1) MARKET STRUCTURE
NZD/USD is moving inside a well-defined descending channel, creating:
Lower Highs
Lower Lows
However, the most recent bearish swings are shorter and losing momentum —
a signal that the downtrend is weakening.
📉 (2) PRICE REACTION
Every touch of the channel’s lower boundary triggers a visible reaction upward.
Recent candles show:
Smaller bearish bodies
Wicks rejecting the lows
Early signs of micro higher lows
These elements indicate absorption of sell pressure.
⏳ (3) HTF CONTEXT
On the H1 structure:
Price is sitting at the oversold edge of the channel
Momentum is compressing
The market is forming a tight consolidation zone
This compression phase often precedes a bullish breakout.
📐 (4) EXPECTATION
High-probability scenario:
Price may dip slightly to retest 0.5960 – 0.5965
A new higher low forms
Breakout of the upper channel line
Price extends toward 0.6025 – 0.6040
This is a textbook reversal from the channel floor.
🎯 (5) TRADING SIGNAL
BUY SETUP
Entry: 0.5960 – 0.5965
Stop Loss: Below 0.5940
Take Profit:
TP1: 0.5990
TP2: 0.6015
TP3: 0.6038 (breakout target)
Key Advantages
Weakening bearish momentum
Clean reactions from channel support
Tight compression before breakout
High R:R opportunity with controlled risk

USDCAD easy buy setupNice buy signal for USDCAD.
We see an impulsive up after a 3 wave correction. We also have a divergence on MACD.
Good trade for a 1:1 rr
Lets watch.

Gold Looks Prime for All-Time High Breakout📈 Technical Analysis of the Chart
The chart shows XAU/USD (Gold vs. USD) moving in what appears to be an upward-sloping channel — higher lows are marked by trend-line support.
Price recently revisited the lower boundary (support zone + trendline) and appears to have held firm — a bullish signal (i.e. a “retest & bounce”).
The annotation “POI” (Point of Interest) near that bounce suggests a probable pivot from support → initiating the next leg up.
On the upside, the chart projects a move toward a new all-time high (ATH) — the red horizontal line — implying a breakout of the current consolidation zone.
If gold breaks above current resistance and stays above the channel’s upper boundary, that increase could accelerate with bullish momentum. This aligns with typical breakout + retest strategies often used in gold trading.
Conversely, if price fails to hold this support zone and drops below the trendline, the bullish setup would be invalidated — a risk to watch, especially if sentiment shifts.
Technical conclusion: The chart shows a classic channel-retest setup — if upward momentum continues, a move toward the all-time high is well justified. The current bounce from support provides a favorable entry setup for bulls, with manageable risk if a stop-loss is set just below the channel support.
🌍 Fundamental & Macro Context
Gold’s recent strength is driven by expectations of lower interest rates: as a non-yielding asset, gold tends to benefit when rates fall because the opportunity cost of holding gold decreases.
A weaker U.S. dollar — often accompanying potential rate cuts — makes gold cheaper for foreign buyers, adding further demand support.
Broad economic context: unsteady global growth, geopolitical uncertainty, and rising demand for safe-haven assets help maintain strong gold demand.
Market forecasts remain bullish: some analysts see gold reaching as high as $4,950/oz by 2026, with a more likely base-case target around $4,500/oz — assuming rate cuts and continued macroeconomic uncertainty.
That said, the key risk remains in a potential rebound of the U.S. Dollar or abrupt shift in monetary policy (e.g. fewer rate cuts than expected) — either could undercut gold’s rally.
Fundamental conclusion: The macro backdrop — rate-cut expectations, weak USD, and global uncertainty — strongly supports a continuation of gold’s upward trajectory. If these tailwinds persist, gold’s push toward new highs is fundamentally justified.
✅ What This Setup Means & What to Watch
If bullish scenario plays out
Expect price to challenge the all-time high. A breakout may target or even exceed prior ATHs.
A bounce-and-run scenario may attract momentum traders, fueling further upside.
Key triggers to monitor
Keep an eye on announcements from Federal Reserve: rate-cut decisions or dovish signals accelerate gold demand.
Watch USD strength: a strong dollar could cap gains or reverse the uptrend.
Monitor global risk sentiment — geopolitical events or economic slowdown fears tend to push money into gold.
Risk control considerations
Use the channel support / trendline as a stop-loss anchor. A breakdown below could invalidate the bullish bias.
Consider that strong moves in the dollar or surprising inflation data might compress gold’s upside or spark a pullback.

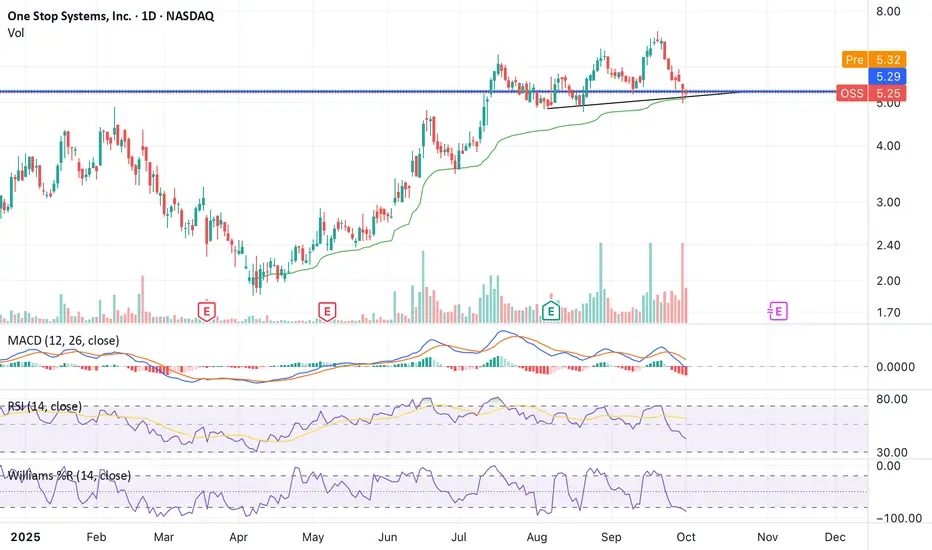
OSS: LONG small cap / event tradeFinalized its offering yesterday which is what I attribute the recent move lower to. Love this space (edge compute for AI/ML - theyre primarily going after military contracts) and any small wins will have outsized impact. This is also the type of company that gets gobbled up.
Lower indicators should flip higher today with the overhang gone. Held anchored VWAP from the April pivot. Should be good support at 4.70 which should be the S/R flip level. I think this gets back to its highs quickly which means 30% upside.
TSLA in SELL ZONEMy trading plan is very simple.
I buy or sell when at either of these events happen:
* Price tags the top or bottom of parallel channel zones
* Money flow volume spikes beyond it's Bollinger Bands
So...
Here's why I'm picking this symbol to do the thing.
Price in selling zone at top of channels
Money flow momentum is spiked positive and nearing top of Bollinger Band
Entry at $447
Downside targets are
$370 bottom channel (short time frame)
$390 bottom channel (longer time frame)
$420 moving average
Will be buying NASDAQ:TSLQ

SAZEW - PSX - Technical AnalysisOn daily TF, after a phenomenal bull run, SAZEW has retraced Fib 25%.
Anchored Volume Profile has been used to identify the area of maximum participation (Volume).
Since Fib 30% and Fib 38% also coinciding with a big participation, therefore, it should test 1730 and then 1670. If price continues to go down then it will test Fib 55% to 60% zone.
Technically correct and very safe buying in expected bull run is 2075. However, buying at discounted level of 1645 or 1485~1500 are also very good.
However, buying at nearest support of 1720 may be a risky affair.
Although RSI suggest a small hidden bullish divergence which might take prices a bit up till 1890 where exists a strong resistance as well. Therefore, risking for mere 5% gain is not logical.

DAL - Upside Extension Toward ATH Looks PossibleDAL - CURRENT PRICE : 64.20
DAL is showing a strong bullish breakout as price surges above the key horizontal resistance near 64, supported by rising volume and a clean reclaim of both the EMA50 and EMA200. Today’s breakout candle signals renewed momentum, while the ascending trendline beneath reinforces a steady higher-low structure. RSI pushing above 60 reflects strengthening buyers without entering overbought territory. With this decisive breakout, DAL may build momentum toward higher resistance levels and potentially work its way toward challenging its all-time high zone if buyers continue to control the trend. Bias remains bullish above 58–60 support, with further upside favored as long as the breakout holds.
ENTRY PRICE : 64.00 - 64.40
FIRST TARGET : 69.00
SECOND TARGET : 74.00
SUPPORT : 58.00

NQ LongsStill in a bullish uptrend, Sweep of lows yesterday and momentum sustained towards the end of the day. Ideally, price should come to take Asia Lows and then move higher to take the most recent highs.
If we continue to move higher through London, I'll be watching previous highs as an area of interest for shorts In NY session.

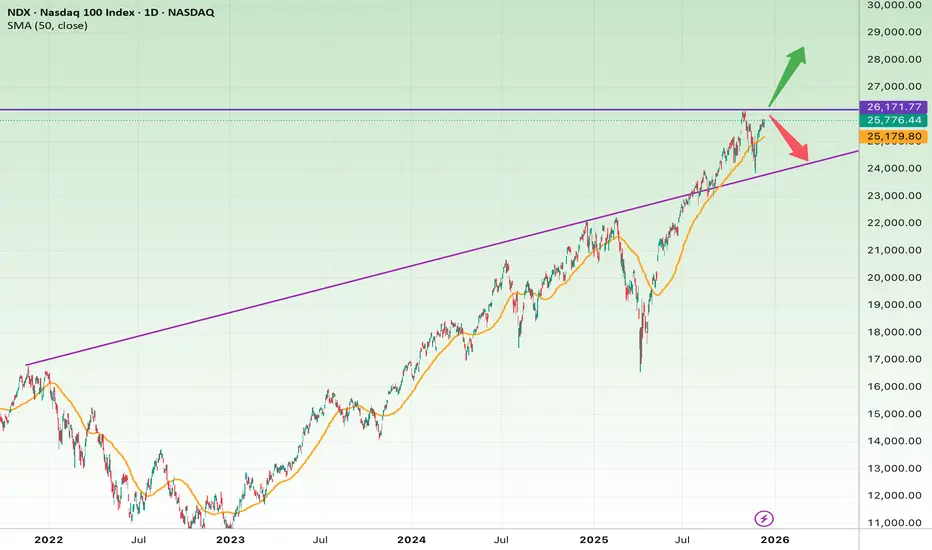
Nasdaq at a Make-or-Break Level: Breakout or Breakdown?Price is trapped between a major historical resistance and a long-term ascending trendline — a critical decision zone.
Bullish Scenario
If price breaks and holds above 26,300:
• Target 1: 27,500
• Target 2: 28,500–29,000
• Stop-loss: Close back below 25,800
Bearish Scenario
If price loses 25,200, and especially 24,800 (trendline):
• Target 1: 23,500
• Target 2: 21,800
• Stop-loss: Reclaiming 25,500
Short Fundamental View
• Tech giants continue to drive market momentum.
• Valuations are elevated, leaving room for correction.
• Fed policy and macro data will heavily influence future price action.
Apple Consolidates at Key Fibonacci Level: Is a Breakout Coming?Apple is sitting right under a big technical level: the 38.2% Fibonacci retracement around $279–280. This spot has been blocking price for days, and the stock keeps bouncing between this resistance and the support levels below.
Buyers have already defended the 50% ($276) and 61.8% ($273) Fib levels, which shows there’s still strength in the uptrend. But unless Apple finally pushes above $280 with conviction, it could swing back down to retest those support levels again.
In short: Apple is coiling up, and the breakout direction from here will tell us everything about the next move.

GBP/USD – Technical Structure Update (4H Chart)The chart highlights the recent price behavior of GBP/USD within a clearly defined market structure:
Key Observations
Resistance Zone:
Price is currently trading near a marked resistance area where previous upward momentum has slowed. Candlestick reactions in this zone suggest hesitation from buyers.
Consolidation Phase:
Before reaching resistance, the pair moved through a period of consolidation, indicating indecision and balanced pressure between buyers and sellers.
Trendline Break & Retest Behavior:
The pair previously followed an ascending trendline before breaking below it. The move back into the resistance region suggests a potential retest of broken structure.
Support Zones:
Two key support areas are noted:
Low Support Zone near 1.3140–1.3170
Broader Support Range extending lower, representing previous accumulation areas where buyers were active.
🔹 Market Outlook
The chart illustrates a scenario in which price may react from the resistance zone and potentially revisit lower support levels if bearish momentum develops. This aligns with the current range-bound behavior visible in the 4H timeframe.
🔹 Reminder
This analysis reflects a technical interpretation of chart structure and does **not** constitute financial advice or a trade recommendation. Always conduct your own analysis and manage risk appropriately.

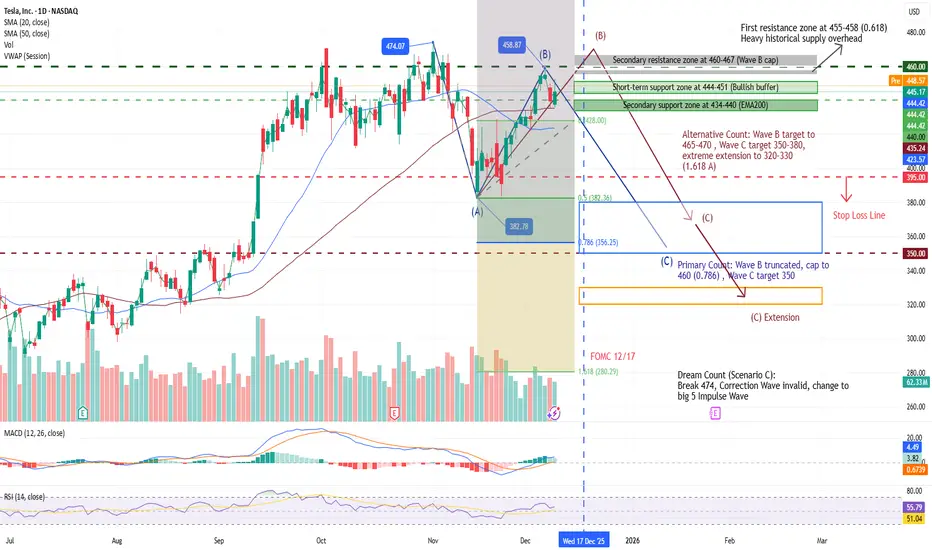
TSLA Elliott Wave Update: B-Wave Truncation at 460 or Extension TSLA Elliott Wave Update: B-Wave Truncation at 460 or Extension to 465?
TSLA's rally from the 383 low has tested the 61.8% Fib at 458, forming a potential B-wave top in the A-B-C correction from the 474 high. EMAs provide dynamic support, but MACD/RSI mild divergence signals momentum fade.
Primary Count: B-wave truncates at 460 (0.786 Fib), capping the rally short; current pullback signals C-wave start, targeting 350 (1.0 extension of A). Volume below 1.5B shares on 455 test reinforces failure—odds of C to 350 rise to 70%. Short-term support at 444-451 (bull buffer).
- Resistance: Primary 455-458 (0.618 Fib + heavy historical supply); Secondary 460-467 (B cap, EMA50 crossover). Volume surge >1.5B needed for break.
- Support: Secondary 434-440 (EMA200 channel low).
- Indicators: MACD (12,26,9) red bars narrowing to 0.32 hints exhaustion; RSI (14) at 68 with bearish divergence warns pullback. Volume MA shows low conviction above 455 (1.3B vs. 1.5B threshold).
Alternative Count: B-wave extends to 465-470 (0.786-1.0 Fib), then C pulls back to 350-380 (1.0 extension) or 320-330 (1.618 A extreme). Probability 25-30%, up on recent strength.
Scenario C: B exceeds 474 on volume >1.5B, invalidating correction for 5-wave impulse: Wave 3 to 520 (1.618x Wave 1, Jan 2026); Wave 5 to 600+ (Q2 2026). Probability 30-35%.
Monitoring: 12/17 FOMC rate cut catalyst.
Disclaimer: This analysis is for educational purposes only and is not investment advice. Please do your own research (DYOR) before making any trading decisions.
$SHOP: Higher Low and Flat Base Set-UpOverview of Recent Price Action
SHOP recently experienced a pullback of approximately 25% from its all-time high (ATH). Such retracements are a typical pattern for stocks that have been in a sustained long-term uptrend. The recent dip allowed the stock to reset its base, which means that any subsequent upward movement could mark the beginning of a new stage two uptrend.
Technical Strength and Higher Low Formation
Notably, SHOP has established a higher low, indicating that the stock may be regaining strength. This technical development suggests a potential shift in momentum, which could attract additional buying interest as the stock stabilizes and positions itself for a possible breakout.
Position Entry and Current Set-Up
A half-sized position was initiated yesterday as SHOP reclaimed the 21-day Exponential Moving Average (EMA). An additional allocation was made today after the stock surpassed the 50-day Moving Average (DMA). Currently, SHOP is trading just below a flat base, with the anticipation that it may soon break out above this level.
Potential Price Target
While specific price targets are not typically set, it is reasonable to expect that the stock could attempt to challenge its previous all-time high. If SHOP achieves this, it would represent a gain of about 12% from the breakout point.
Risk Disclaimer
Readers are strongly encouraged to conduct their own analysis and adhere to their personal trading strategies. It is crucial to understand that all investments carry inherent risks. Making informed decisions is essential when allocating capital within the financial markets.

EURUSD approaching the support _longEURUSD is trading in a channel and soon price may come to support and pullback from here . let us see how it plays out .

GBPNZD higher bearish expecting
OANDA:GBPNZD we are have break of PA, later and break of H&S pattern, today we are have RBA from which expecting impact on this trade.
Here having strong bearish expectations.
SUP zone: 2.31100
RES zone: 2.28500, 2.27900

XAGUSD – 4H OutlookBias: Short-term corrective move after hitting major supply zone.
XAGUSD just tapped a strong 4H supply zone around 62.70 – 63.00, and price immediately rejected with a clear wick. This confirms sellers are active at this level.
Structure-wise, silver has been moving in a parabolic impulse, and now the chart is showing the first signs of exhaustion. If the rejection holds, market likely forms a lower high before shifting into a deeper correction.
Key Levels
62.70–63.00 (Supply Zone – Strong Rejection)
61.98 (First support / retest area)
60.62 (Major 4H structure support)
59.31 (Bigger correction target)
What I Expect Next
Price retests the supply zone → forms a lower high
Pullback continuation toward 61.98
Break below opens the door to 60.62
Full correction target sits near 59.30
Momentum indicators also show bearish divergence + Stoch RSI cooling off, supporting a temporary downturn before any bigger trend continuation.
Summary
XAGUSD likely enters a short-term correction phase after rejecting a key supply area. I expect price to form a lower high and continue down toward the 60–59 zone unless buyers reclaim and hold above 63.

Ethereum Analysis + Correlation of Bitcoin + Advanced TAHow can you analyze Ethereum deeply using volume, visible range, and RSI, together with technical and correlation analysis in the crypto space?
How does correlation work between Bitcoin and Ethereum?
And additionally, how do I personally approach technical analysis, where to look right now on Ethereum itself, and which direction the market and the crypto space are moving?
If this video reaches 10 likes or more, I will do an update on that.
Until then, I wish you the best.
And if you like the video, don’t forget to comment, like, and share.
Also, leave me a comment below on which asset I should talk about next, or which strategies or problems you are currently facing in trading.
Happy to help, just share it in the comments.
And let me know as well if you like this type of video, Face sharing.

NVDA SELLIf you have not SELL NVDA, than be prepare to SELL NVDA riding it back down to 93.00 to 77.00 as Profit Targets, Stop Loss will be determine later!
If anyone likes long mumbo jumbo garbage analysis, than this is NOT for you.
Also, if you are afraid of risk, failure, and want only a 100% sure thing, than
run as fast as you can from the market, because the market is NOT a sure thing,
so it is definitely NOT for you.
WARNING: This is just opinions of the market and its only for journaling purpose. This information and any publication here are NOT meant to be, and do NOT constitute, financial, investment, trading, or other types of advice or recommendations. Trading any market instrument is a RISKY business, so do your own due diligence, and trade at your own risk. You can loose all of your money and much more.

AMD OutlookHere it goes.
Yes, some of yall might see this and say "uh yeah crazy analysis, you just drawn up all the possible scenarios" since all the market can do is go up, down or consolidate.
Well, no.
This is about expected behaviour and bias.
As long as we are inside the top box, following the yellow line I'd trade rotations from the extremes.
If we break below, following the red line , I'd expect our next stop to be between 152-174.
This is where I would fill spot bags, get calls, whatever. It's a great zone for accumulation.
If we break, following the green line , above I'd continue to be long. Keep an eye on the macro-economics. Especially deals with China and the further progression of Companies like Moore Threads pose a threat to NASDAQ:NVDA and AMD.
Same with the TPUs from $GOOG.
Anyways, that's just my two cents.
Happy Trading.


Strong Support and Resistance Area: 533.90-793.86
Hello, fellow traders!
Follow us to get the latest information quickly.
Have a great day!
-------------------------------------
(BNBUSDT 1D Chart)
The 533.90-793.86 area is a strong support and resistance area. A decline below this area is highly likely to trigger a long-term downtrend.
Therefore, if support is found around the 533.90-793.86 range, it would be a buying opportunity.
Since the HA-Low indicator formed at 871.15, if support is found around the 833.78-871.15 range, this would also be a buying opportunity.
Resistance levels are:
1st: 1028.57-1088.90
2nd: 1220.98-1302.65
The first and second levels above are resistance levels.
-
If the price holds above 793.86, it is expected to rise to around the circled range shown on the chart above.
BNB should be traded differently from BTC or ETH.
In other words, while you can continue to invest in BTC and ETH to purchase them, you should hold altcoins like BNB, XRP, and SOL by increasing the number of coins that represent profits.
Therefore, if the price rises after purchasing, you should sell the original purchase amount, leaving only the number of coins that represent profits.
This is because in a bear market, the price drops more sharply than expected.
BTC and ETH also show significant declines during bear markets, similar to altcoins. However, they tend to rebound faster than altcoins, allowing for continued investment and purchase.
However, to stabilize your psychological state, it's important to take some profits while you're in profit.
-
Thank you for reading to the end.
I wish you successful trading.
--------------------------------------------------
