Filecoin (FIL): Looking For Break of 100&200 EMA | Bullish SetupFIL is sitting right above the support zone again, and this area keeps showing good reactions. As long as price holds here, the R:R setup stays interesting, but buyers still need to step in stronger.
For any bullish continuation, buyers have to secure both the 100 and 200 EMAs. Those two have been acting as the main barrier, so a clean reclaim above them becomes the confirmation that opens the move toward the bullish CME target higher. Until that happens, FIL is just building up near support and waiting for momentum to shift.
Swallow Academy
X-indicator

NASDAQ SHORT VERY BEARISHTri-star doji printed, a rare and strong reversal pattern - extremely bearish.

USDCHF pullback ahead of Fed rate decision The USDCHF remains in a bullish trend, with recent price action showing signs of a breakout within the broader uptrend.
Support Zone: 0.7980 – a key level from previous consolidation. Price is currently testing or approaching this level.
A bullish rebound from 0.7980 would confirm ongoing upside momentum, with potential targets at:
0.8060 – initial resistance
0.8070 – psychological and structural level
0.8090 – extended resistance on the longer-term chart
Bearish Scenario:
A confirmed break and daily close below 0.7980 would weaken the bullish outlook and suggest deeper downside risk toward:
0.7960 – minor support
0.7935 – stronger support and potential demand zone
Outlook:
Bullish bias remains intact while the USDCHF holds above 0.7980 A sustained break below this level could shift momentum to the downside in the short term.
This communication is for informational purposes only and should not be viewed as any form of recommendation as to a particular course of action or as investment advice. It is not intended as an offer or solicitation for the purchase or sale of any financial instrument or as an official confirmation of any transaction. Opinions, estimates and assumptions expressed herein are made as of the date of this communication and are subject to change without notice. This communication has been prepared based upon information, including market prices, data and other information, believed to be reliable; however, Trade Nation does not warrant its completeness or accuracy. All market prices and market data contained in or attached to this communication are indicative and subject to change without notice.

SPY Fed Cut Breakout?SPY is still riding a clean 1D uptrend, holding above the 20, 60 and 120-day moving averages, with multiple upside BOS confirming bullish structure. The recent MSS in November and the emerging Double Top around 688 had already injected some caution, but the latest 25 bps Fed cut changes the backdrop. Easier policy generally supports risk assets, yet the key is always the market’s reaction: does price accept higher levels, or do we see a “sell the news” fade from resistance? For now, SPY remains trapped between supply near 688 and demand around 655, the neckline of the recent pullback.
My primary path leans bullish with the Fed cut acting as a tailwind. A decisive daily close above 688–689 would invalidate the Double Top narrative, signaling that buyers have fully absorbed supply at this zone. If that breakout holds, upside continuation toward 695 and then 705–719 comes into focus, as long as price stays above the 20-day MA near 675.
If instead SPY fails to clear 688 and closes back below 680 and then 675, it would suggest the cut was already priced in and sellers are fading strength. In that scenario, I’d watch 670, then 660, with 655 as the critical neckline. A daily close below 655 would confirm the Double Top and open room for a deeper correction. This is a study, not financial advice. Manage risk and invalidations.
Thought of the Day 💡: News is the spark, structure is the map—trade the reaction, not the headline.
-------------------------
Thanks for your support!
If you found this idea helpful or learned something new, drop a like 👍 and leave a comment, I’d love to hear your thoughts!

USDCAD corrective pullback, support retest?The USDCAD remains in a bullish trend, with recent price action showing signs of a corrective pullback within the broader uptrend.
Support Zone: 1.3797 – a key level from previous consolidation. Price is currently testing or approaching this level.
A bullish rebound from 1.3797 would confirm ongoing upside momentum, with potential targets at:
1.3923 – initial resistance
1.3950 – psychological and structural level
1.3980 – extended resistance on the longer-term chart
Bearish Scenario:
A confirmed break and daily close below 1.3797 would weaken the bullish outlook and suggest deeper downside risk toward:
1.3774 – minor support
1.3750 – stronger support and potential demand zone
Outlook:
Bullish bias remains intact while the USDCAD holds above 1.3797. A sustained break below this level could shift momentum to the downside in the short term.
This communication is for informational purposes only and should not be viewed as any form of recommendation as to a particular course of action or as investment advice. It is not intended as an offer or solicitation for the purchase or sale of any financial instrument or as an official confirmation of any transaction. Opinions, estimates and assumptions expressed herein are made as of the date of this communication and are subject to change without notice. This communication has been prepared based upon information, including market prices, data and other information, believed to be reliable; however, Trade Nation does not warrant its completeness or accuracy. All market prices and market data contained in or attached to this communication are indicative and subject to change without notice.

Aptos (APT): Entering The Local Lows | Looking For BounceAPT kept breaking lows step by step and finally tapped the main local low. This is the first place where buyers can try to build something, but we don’t have any real shift yet — just a reaction from the zone.
What we need now is a clean break of structure to confirm the reversal attempt. Until that BOS comes, this is only a bounce from support, but the area itself is strong enough to watch for the early signs of buyers stepping back in.
Swallow Academy

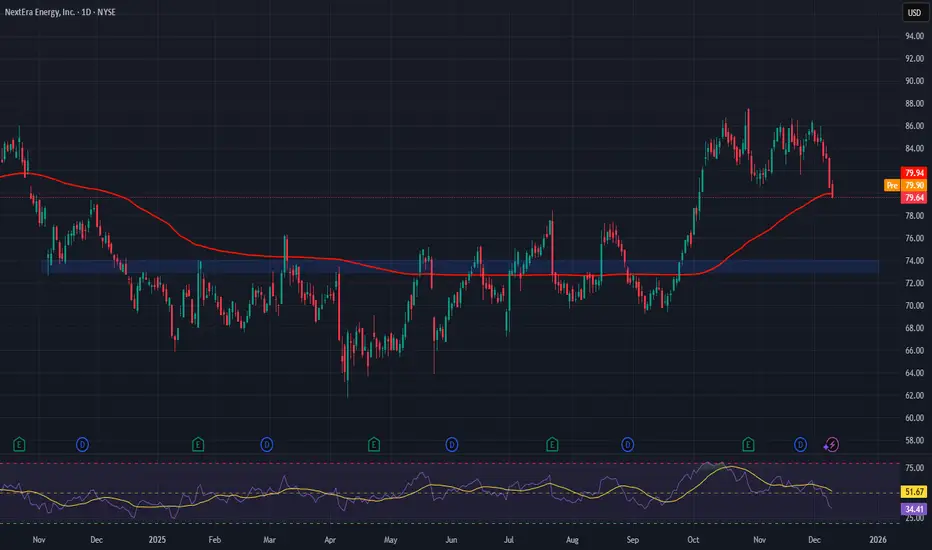
NextEra Energy (NEE) — Clean Power Scale for the AI GridCompany Overview
NextEra Energy NYSE:NEE is the world’s largest clean-energy utility, with leadership across wind, solar, nuclear, storage, and grid infrastructure—a core enabler of the accelerating clean power transition.
Key Catalysts
AI-Powered Demand: Hyperscalers (e.g., Google) are signing long-term carbon-free PPAs, making NEE a top supplier to data centers & cloud growth.
Pipeline Expansion: 3.2 GW added in Q2’25, including 1+ GW for hyperscalers, reinforcing first-mover scale in renewables and storage.
Capex Visibility: $74.6B plan through 2029 for grid upgrades, batteries, and renewable capacity, supporting multiyear rate base and EPS growth.
Reliability + Cost Curve: Scale, operational discipline, and declining LCOE sustain moat in clean generation and grid services.
Why It Wins
Direct exposure to the AI electricity boom
Largest U.S. renewables fleet + storage integration
Structural tailwinds from electrification & policy support
Investment Outlook
Bullish above: $73–$74
Target: $120–$122 — driven by hyperscaler demand, an expanding project backlog, and high-confidence capex deployment.
📌 NEE — powering the AI era with the world’s premier clean-energy platform.
Bitcoin vs Silver RatioBitcoin vs Silver Ratio
A similar structure has been formed in the BTCUSD/XAGUSD ratio on the weekly chart (as in our previous analysis of Nasdaq vs Silver monthly chart)
A clear breakout could be seen, and BTC seems to have already entered a bear market priced in silver
Interpretation
1. Ratio Declines: Silver benefits
2. Ratio Appreciates: Bitcoin benefits
Similar 3 possibilities - if the ratio keeps on declining:
1. Either Silver will rise further, with higher strength than Bitcoin
2. Bitcoin will continue to fall
3. Both the above situations simultaneously


AMD OutlookHere it goes.
Yes, some of yall might see this and say "uh yeah crazy analysis, you just drawn up all the possible scenarios" since all the market can do is go up, down or consolidate.
Well, no.
This is about expected behaviour and bias.
As long as we are inside the top box, following the yellow line I'd trade rotations from the extremes.
If we break below, following the red line , I'd expect our next stop to be between 152-174.
This is where I would fill spot bags, get calls, whatever. It's a great zone for accumulation.
If we break, following the green line , above I'd continue to be long. Keep an eye on the macro-economics. Especially deals with China and the further progression of Companies like Moore Threads pose a threat to NASDAQ:NVDA and AMD.
Same with the TPUs from $GOOG.
Anyways, that's just my two cents.
Happy Trading.

ZEC USDT SHORT SIGNAL---
📢 Official Trade Signal – ZEC/USDT
📉 Position Type: SHORT
💰 Entry Price: 442.33
---
🎯 Take-Profit Targets (Partial Exits):
• TP1: 428.46
• TP2: 415.37
• TP3: 407.28
• TP4: 398.00
---
🛑 Stop-Loss: 454.46
📊 Timeframe: 15m
⚖️ Risk/Reward Ratio: ≈ 3.65 (based on TP4)
💥 Suggested Leverage: 5× – 10×
---
🧠 Technical Analysis Summary
ZEC is exhibiting bearish momentum following a rejection from a key resistance area. The market structure on the 15-minute chart suggests a shift downward, with lower highs indicating increasing selling pressure. The identified take-profit levels align with projected liquidity zones and previous support areas.
The critical downside targets are:
428.46 → 415.37 → 407.28 → 398.00
A sustained break below TP1 (428.46) is expected to accelerate the move toward the subsequent targets.
---
⚙️ Trade Management Rules
✔ Take partial profits at each TP level
✔ Move stop-loss to entry point once TP1 is hit
✔ Trail stop-loss downward as price moves in your favor
✔ Do not re-enter if stop-loss (454.46) is triggered
✔ Confirm bearish structure on the chart before entering
---
📌 TradingView Hashtags
#ZECUSDT #ZEC #CryptoSignal #ShortTrade
#TradingView #FuturesTrading #TechnicalAnalysis
---
Let me know if you need any adjustments or a Persian version.

DOT USDT LONG SIGNAL---
📢 Official Trade Signal – DOT/USDT
📈 Position Type: LONG
💰 Entry Price: 2.179 (Limit Order)
---
🎯 Take-Profit Targets (Partial Exits):
• TP1: 2.218
• TP2: 2.248
• TP3: 2.300
• TP4: 2.393
• TP5: —
---
🛑 Stop-Loss: 2.084
📊 Timeframe: 15m
⚖️ Risk/Reward Ratio: ≈ 2.25 (based on TP4)
💥 Suggested Leverage: 3× – 5×
---
🧠 Technical Analysis Summary
DOT shows potential bullish momentum after stabilizing near a key support zone around 2.179.
A successful break above immediate resistance could trigger a move toward higher timeframe liquidity areas.
The 15m chart structure suggests a possible shift upward, with clear targets aligned with previous swing highs and orderbook liquidity levels.
Critical upside targets:
2.218 → 2.248 → 2.300 → 2.393
A sustained move above TP1 (2.218) may accelerate momentum toward 2.300 and 2.393.
---
⚙️ Trade Management Rules
✔ Take partial profit at each TP level
✔ Move stop-loss to entry point once TP1 is reached
✔ Trail stop-loss as price progresses toward higher targets
✔ No re-entry if stop-loss (2.084) is triggered
✔ Confirm bullish structure on 15m chart before entering
---
📌 TradingView Hashtags
#DOTUSDT #DOT #CryptoSignal #LongTrade
#TradingView #FuturesTrading #TechnicalAnalysis
---
Let me know if you would like this translated to Persian or adjusted in any way.

LONG on BTCUSD (Bitcoin) at 91,050 LONG on BTCUSD (Bitcoin) at 91,050 Targets:
TP1: 91,800
TP2: 92,500
TP3: 93,000+ (running to 93k zone) Stop Loss: 90,000 (below the daily demand zone)
Leverage: 10–20x (adjust to your risk) Reason: Strong bounce from the 4H + Daily order block, bullish structure still intact, volume increasing on the retest. Expecting continuation to the upside. NOT financial advice
DYOR – Trade at your own risk – Only risk what you can afford to lose!#Bitcoin #BTC #BTCUSD #Crypto #Cryptocurrency #BitcoinTrading #TradingSignals #CryptoTrading #Bullish #Altseason #Binance #BybitWho’s buying the dip with me? Smash if you’re in!
Drop your entry below Good luck legends, let’s eat!

APT USDT LONG SIGNAL---
📢 Official Trade Signal – APT/USDT
📈 Position Type: LONG
💰 Entry Price: 1.7780
---
🎯 Take-Profit Targets (Partial Exits):
• TP1: 1.8100
• TP2: 1.8480
• TP3: 1.8880
• TP4: 1.9214
• TP5: 1.9532
• TP6: 2.0000
---
🛑 Stop-Loss: 1.7200
📊 Timeframe: 15m
⚖️ Risk/Reward Ratio: ≈ 2.34 (based on TP6)
💥 Suggested Leverage: 5× – 10×
---
🧠 Technical Analysis Summary
APT is showing signs of bullish momentum after holding above a key support area near 1.7750. The 15m chart suggests a potential upward shift if price breaks above immediate resistance around 1.8100. Higher lows and increasing buy pressure could propel APT toward the identified liquidity zones above.
The key upside targets are structured as follows:
1.8100 → 1.8480 → 1.8880 → 1.9214 → 1.9532 → 2.0000
A confirmed break above TP1 (1.8100) may accelerate upward movement toward 1.8880 and beyond.
---
⚙️ Trade Management Rules
✔ Take partial profit at each TP level
✔ Move SL to entry once TP1 is reached
✔ Trail stop-loss upward as price advances
✔ Do not re-enter if SL (1.7200) is triggered
✔ Confirm bullish structure on 15m chart before entering
---
📌 TradingView Hashtags
#APTUSDT #APT #CryptoSignal #LongTrade
#TradingView #FuturesTrading #TechnicalAnalysis
---
Let me know if you'd like this adjusted for a different style or translated into Persian.

sol usdt long signal---
📢 Official Trade Signal – SOL/USDT
📈 Position Type: LONG
💰 Entry Price: 137.92
---
🎯 Take-Profit Targets (Partial Exits):
• TP1: 139.80
• TP2: 141.72
• TP3: 144.00
• TP4: 145.98
• TP5: —
• TP6: —
---
🛑 Stop-Loss: 131.15
📊 Timeframe: 15m
⚖️ Risk/Reward Ratio: ≈ 1.19 (based on TP4)
💥 Suggested Leverage: 5× – 10×
---
🧠 Technical Analysis Summary
SOL shows potential bullish momentum after testing a key support zone around 137–138.
Market structure on the 15m chart indicates a possible shift upward if resistance near 140 is broken.
Buying pressure may increase upon confirmation of higher lows and a clear break above local resistance.
The critical upside targets:
139.80 → 141.72 → 144.00 → 145.98
A sustained move above 139.80 (TP1) could accelerate momentum toward higher liquidity zones near 144 and 146.
---
⚙️ Trade Management Rules
✔ Partial profit at each TP level
✔ Move SL to entry (break-even) once TP1 is hit
✔ Trail SL as price advances toward higher targets
✔ No re-entry if SL (131.15) is triggered
✔ Confirm bullish structure before entering
---
📌 TradingView Hashtags
#SOLUSDT #SOL #CryptoSignal #LongSetup
#TradingView #FuturesTrading #TechnicalAnalysis
---
Let me know if you'd like this translated to Persian or adjusted for a different platform.

New GBP/USD Upside Move: Can Bulls Maintain Control?Asset: GBP/USD — “THE CABLE”
Type: Forex Market Trade Opportunity Guide (Swing / Day Trade)
Market Bias: Bullish Momentum Plan 📈✨
🔥 TRADE SETUP OVERVIEW
A strong bullish continuation plan has been validated following a TMA breakout above 1.33400, signaling renewed upside interest and a potential drive toward higher resistance levels.
🎯 ENTRY PLAN
Entry: Any price level after the confirmed breakout above 1.33400
The breakout structure supports momentum buyers and short-term trend followers.
🛡️ STOP LOSS (RISK GUIDELINE)
Suggested SL: 1.32600
⚠️ This is a flexible stop level.
Dear Ladies & Gentlemen (Thief OG’s), adjust your SL according to your personal risk appetite & strategy.
This plan is for market guidance — not a fixed rule.
🎯 TARGET — ESCAPE BEFORE POLICE ARRIVES 🚓🤣
Strong resistance + overbought region + potential liquidity trap zone
Main TP: 1.34400
Again: This is a guideline. Use your own TP decisions based on strategy & risk management.
📊 TECHNICAL OUTLOOK
TMA breakout confirms bullish shift 📈
Price moving above short-term dynamic zones supports continuation
Dollar softness & GBP strength align with trend direction
Structure favors clean trend leg toward upside liquidity pockets
🔗 RELATED PAIRS TO WATCH + CORRELATION NOTES
🇺🇸💵 1. USD/CHF (Inverse Correlation to GBP/USD)
Typically moves opposite GBP/USD
If USD/CHF is falling, it supports Cable bullish bias
Watch for USD weakness confirmation
🇺🇸💵 2. DXY – U.S. Dollar Index (Direct Driver)
A softening dollar boosts GBP/USD
If DXY breaks supports → bullish continuation for Cable
🇪🇺🇬🇧 3. EUR/GBP (Inverse to GBP Strength)
If EUR/GBP is falling → GBP gaining strength → supports GBP/USD bullish continuation
4. AUD/USD (Positive Correlation)
Both Cable & Aussie often climb together when USD weakens
If AUD/USD is showing bullish continuation → Cable gets confirmation
5. NZD/USD (Risk-On Correlation)
Similar risk sentiment behaviour
If NZD/USD is also breaking highs → bullish risk flow → strengthens GBP/USD bias
🧭 FINAL SUMMARY
The Cable is showing a clean bullish structure after the TMA breakout. Market sentiment, USD behavior, and correlated pairs are aligning in favor of a continuation move toward overhead resistance. Manage risk smartly, adjust levels responsibly, and follow your strategy.

Nifty chart short term view Nifty chart showing liquidity downside area and will take this area and will go upside....br careful and don't sell without any confirmation...wait for upside when 15 minutes candle close above 9ema ...it will be confirmation...


Bullish Flag Formation on QNTQNT formed a bullish flag, the movement reached the liquidity area that was at the bottom
It is more likely that an upward movement and a pattern execution are expected, reaching the liquidity level formed above
Full breakdown with levels and graphs on the website

BTC vs. The Fed: The "Neutral Coil" Before the ExplosionDescription: Today represents the collision of a massive macro catalyst (FOMC) and a technically "coiling" market. As professional traders, we do not gamble on the outcome of the speech; we identify the breakout levels that the speech will trigger.
1. The Macro Setup: Priced to Perfection According to the CME FedWatch Tool, the market has priced in an 89.6% probability of a rate cut.
The Trap: When certainty is this high, the "upside" of the news is often limited (priced in), while the downside risk of a "hawkish surprise" is violent. The market is leaning one way, which makes the reaction unpredictable.
2. The Technical Reality: Dead Neutral Replacing complex algorithms with standard, time-tested indicators reveals a market that is holding its breath.
RSI (14): Currently sitting at 48.45. This is effectively 50—dead neutral. Bulls and bears are in perfect equilibrium waiting for a trigger.
Bollinger Bands: Price is chopping directly on the 20 SMA (Middle Band). We are neither overbought nor oversold. We are in "fair value" territory, which is typically where trends go to pause before a volatility expansion.
ADX (Trend Strength): The ADX has dropped to 25, signaling that the previous directional trend has exhausted itself.
3. The Levels to Watch (The Trade) Because the technicals are neutral, we must wait for price to leave this "value zone" to confirm the winner.
Bullish Confirmation: We need a decisive Daily Close above the 0.382 Fib level ($97,600) and the upper resistance knot. Reclaiming this level opens the door to test the $100k psychological barrier.
Bearish Invalidation: If the Fed disappoints, watch the recent swing lows around $84,800. A loss of this support invalidates the recovery and exposes the lower Bollinger Band.
Summary: Do not front-run the Fed. The indicators (RSI 48, ADX 25) are telling us there is no trend right now. Wait for the volatility to break the range, then follow the momentum.
DISCLAIMER: Trading involves significant risk. This analysis is for educational purposes only and is not financial advice. Do your own due diligence.

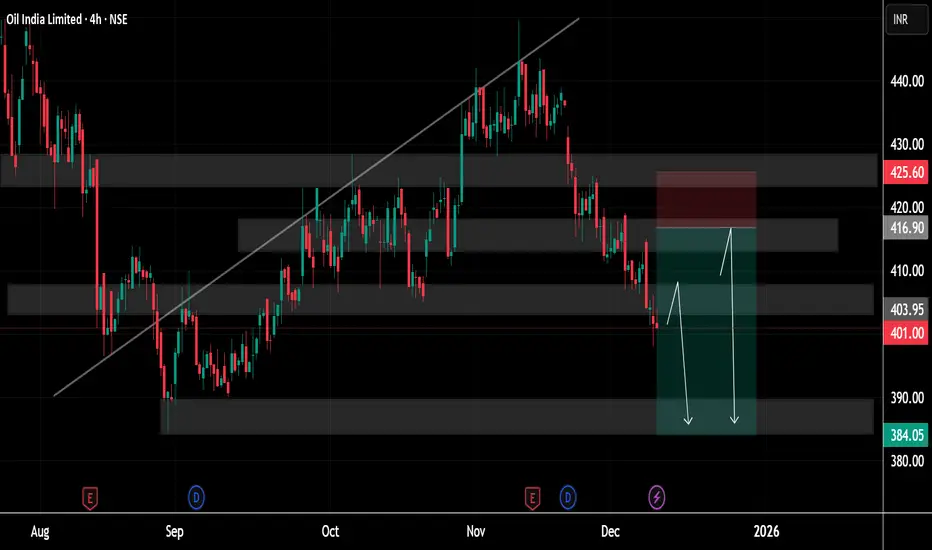
Crude Oil Price Update – Clean & Clear ExplanationCrude Oil highlighting how the market has shifted from a previously rising trend into a phase of weakness. Earlier, the price followed an upward sloping trendline, reflecting steady buying strength, but eventually the price broke below that trendline, signalling the start of a broader correction. Since then, the chart has formed a series of lower highs and lower lows, showing the transition from bullish momentum to a more bearish structure.
Several supply and demand zones are clearly marked on the chart with shaded regions. These zones help identify where buying or selling pressure is strongest. The upper zone near 425–430 represents a major supply area where sellers have previously stepped in and pushed the price down multiple times. Just below it, the 416–420 region shows another resistance area that reinforces the overhead selling pressure.
On the downside, the price is currently trading around the 401 level, where it is testing a mid-level demand zone. The chart shows projected arrows indicating the possibility of the price dipping deeper into the broader demand area around 384–390. This zone has historically acted as a strong support, where buyers could attempt to defend the price again.
The highlighted risk-to-reward box suggests a potential short setup, where traders might expect further downside movement until the price reaches the lower support zone. However, there is also a secondary upward arrow indicating that if the price finds strong support, it may bounce back toward the mid-range resistance near 416, before facing sellers again.
Overall, the chart represents a long-term picture of price correction inside a well-defined supply and demand structure, where the market is currently showing bearish momentum but may find stability and buyers closer to the lower demand zones. The structure reflects how the market is balancing between downward pressure and potential reversal zones, giving a clear roadmap of key levels for future movement.
If you find it helpful please like and comments for this post and share thanks.
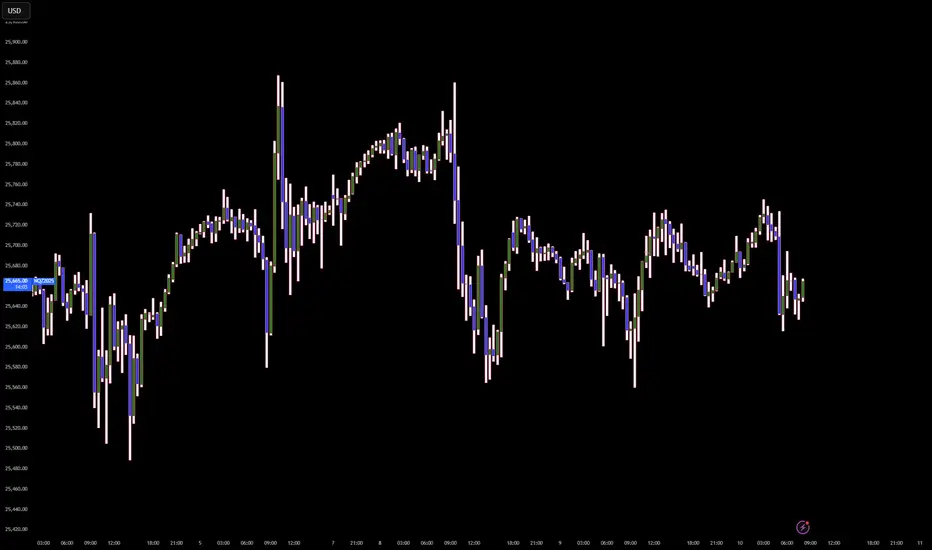
Algo's Logic: Why price moves ''crazy'' with red folder news?WHY PRICE MOVES LIKE THIS
The market is not a chaotic auction of buyers and sellers seeking fair value; it is a highly engineered delivery system designed to seek and destroy liquidity. The current consolidation you see is not indecision; it is a 'Liquidity Coil'. The algorithm is purposefully compressing price action ahead of the 'Red Folder' events to engineer a 'Straddle Inducement'.
By keeping the range tight, the Interbank Price Delivery Algorithm (IPDA) encourages retail traders to place tight buy-stops above the range and tight sell-stops below it. This creates two massive pools of liquidity—fuel for the machine. The news event is not the cause of the move; it is the 'Key' that unlocks this volatility. The initial move is almost always a 'Judas Swing'—a fraudulent manipulation designed to trigger one side of these stops (usually the sell-stops below) to harvest the necessary liquidity to fuel the *real* move in the opposite direction. We do not trade the news; we trade the algorithmic reaction to the liquidity harvest.
THE THESIS
The algorithm is currently in a 'Suspended State' of pre-event accumulation utilizing the impending volatility of the Macro Data Injection to engineer a classic 'Judas Swing' manipulation. The narrative is strictly governed by the 'Seek and Destroy' protocol: The market will utilize the news release to aggressively harvest the internal Sell-Side Liquidity (SSL) resting below the 25,550.00 shelf to fuel the terminal expansion towards the external Buy-Side Liquidity (BSL) at 25,900.00.
THE EXECUTION VECTOR
Entry: 25,525.00 (Buy Limit / Post-News Reclaim)
Stop loss: 25,380.00 (145.00 points)
Take profit: 25,950.00 (425.00 points)
Risk to reward ratio: 2.93R
THE CAUSAL RATIONALE
The Pre-News Narrative (The Trap)
Current price action (25,650.00) is a 'Volatility Compression' zone. The algorithm is holding price in a narrow range. Do not trade the drift. The drift is the bait. The algorithm is waiting for the 08:30 AM / 10:00 AM timestamp to unlock the high-velocity engine. The 'Red Folders' are simply the authorized time windows for the Market Makers to reprice the asset.
The News Event (The Judas Swing)
Upon the data release, expect an immediate, violent displacement. The highest probability vector is a 'False Bearish Breakout' (The Judas Goat). The algorithm will likely spike price DOWN into the 25,550.00 - 25,500.00 region. This serves two purposes:
1. Trigger the sell-stops of the overnight longs.
2. Induce breakout sellers to provide the necessary Buy-Side liquidity for the Smart Money to fill their long orders at a discount.
The Post-News Expansion (The Real Move)
Once the SSL is harvested and the 25,500.00 region (Bullish Order Block / FVG) is mitigated, look for an impulsive reclaim of the 25,600.00 level. This 'Sponsorship' signal confirms that the low is in, and the algorithm will switch to a 'Low Resistance Liquidity Run' targeting the clean highs at 25,900.00.
THE INVALIDATION (THE OMEGA POINT)
The bullish news model is ontologically corrupted if the news candle displaces below 25,380.00 and *sustains* acceptance there (15-minute close). A simple wick is not invalidation; it is a feature. But a closure below this level implies the macro data has triggered a 'Risk-Off' regime shift, targeting deeper discount arrays at 25,000.00.
KEY TRAJECTORY WAYPOINTS
Target 1: 25,750.00 | Type: Equilibrium / Initial Rebound | Probability: 90%
Target 2: 25,900.00 | Type: External Buy-Side Liquidity | Probability: 75%
Target 3: 26,100.00 | Type: Blue Sky Expansion | Probability: 40%
THE SHADOW REALITY
A 30% probability exists for the 'Bull Trap' scenario. In this reality, the news spikes price UP first into 25,850.00. If the first move is UP, fade it. The algorithm rarely gives the true move first during high-impact news.
Breaking; Aimei Health Technology Co., Ltd (AFJK) Spiked 1000%The price of Aimei Health Technology Co., Ltd (NASDAQ: NASDAQ:AFJK ) saw a noteworthy uptick of 1000% in yesterday's market session. However, the reign was short-lived as the asset is down 45% in premarket trading today.
The last recorded RSI is 93, which is clearly overbought setting the stage for a cool off to the $50 support zones.
About AFJK
Aimei Health Technology Co., Ltd does not have significant operations. The company intends to effect a merger, share exchange, asset acquisition stock purchase, reorganization, or similar business combination with one or more businesses. It also intends to acquire small cap businesses in the biopharmaceutical, medical technology and device industries, as well as in the diagnostic and other services sector. Aimei Health Technology Co., Ltd was incorporated in 2023 and is based in New York, New York.
