Ethereum (ETH): Once 200EMA Will Be Broken We Will Go Parabolic200 EMA is the zone we are looking for to be broken, which would result in a trend switch and a continuation of upside movement.
We had a successful MSB and retest, which is major confirmation for the reversal that we had on lower zones; now we need that break of 200 EMA. Looks bullish
Swallow Academy
X-indicator

Bitcoin Pre‑FOMC: 92.3k Reclaim or 84k Reload__________________________________________________________________________________
Market Overview
__________________________________________________________________________________
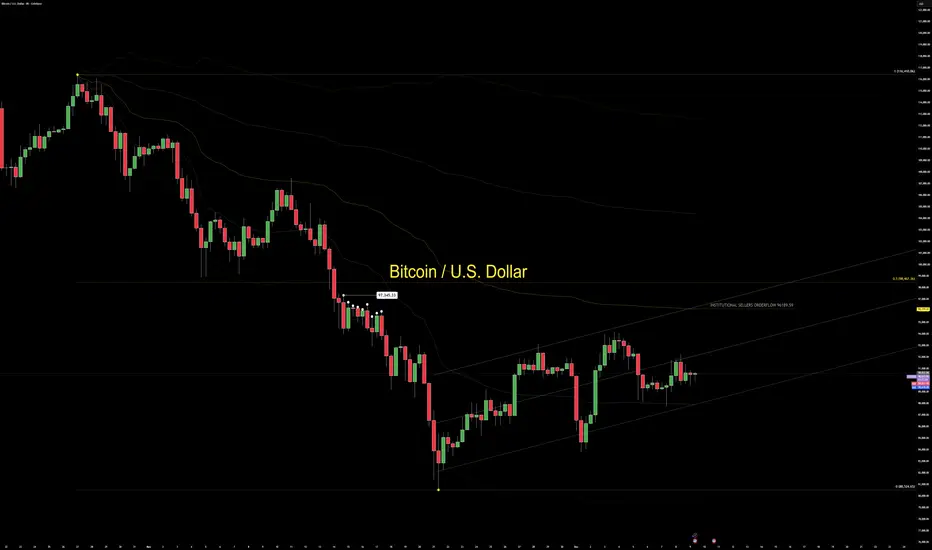
Bitcoin remains in a controlled range beneath 92,285–94,213, with sellers defending overhead supply while buyers cluster around the mid-to-high 80Ks. Momentum is two‑sided but tilts cautious as macro risk remains event‑driven into the Fed.
Momentum: Range with a bearish tilt under 92,285; rallies fade at HTF resistance while 88–84k buys time for consolidation.
Key levels:
- Resistances (4H/1D): 92,285–94,213; 98,330 (weekly underside).
- Supports (4H/1D): 89,258–88,122; 83,871–84,405 (dense cluster with D Pivot Low).
Volumes: Mostly normal on 1–6H with occasional 15m spikes; overall moderate.
Multi-timeframe signals: 12H Down vs 1D Up; 4H attempts up but stalls at 92,3k; net NEUTRAL SELL bias until reclaim.
Harvest zones: 75,700 (Cluster A) / 83,600–84,400 (Cluster B) — ideal dip‑buy areas for inverse pyramiding if a flush prints a ≥2H reversal.
Risk On / Risk Off Indicator context: Neutral sell bias; it confirms the cautious momentum and favors disciplined fades at resistance unless 92,3k is reclaimed.
__________________________________________________________________________________
Trading Playbook
__________________________________________________________________________________
Strategically, treat this as a range with overhead supply; lean patient and reactive, not predictive.
Global bias: NEUTRAL SELL while price is capped below 92,285; invalidation of the cautious stance on a sustained reclaim and hold above 92,285.
Opportunities:
- Buy: 84,0–84,6k cluster only on ≥2H bullish reversal; scale toward 90,2–90,6k, then 92,3–94,2k.
- Breakout: Long on break & retest of 92,3k with breadth; target 94,2k then 98,3k.
- Tactical sell: Fade 92,3–94,2k rejection with weak breadth; manage to 90,4k then 88,3–88,0k.
Risk zones / invalidations: Break and daily/12H hold above 94,6k would invalidate the near‑term short bias; loss of 83,6–83,9k would invalidate the long-at‑84k thesis.
Macro catalysts (Twitter, Perplexity, news):
- FOMC decision and guidance are the near‑term pivot; a dovish tilt could clear 92,3k, a firm tone risks a re‑test of 88k/84k.
- ETF flows slightly negative — a mild headwind to risk‑on.
- External dashboard: Risk On / Risk Off Indicator in sell mode; credit‑sensitive gauges soft, early‑cycle tech mixed — mid‑cycle feel.
Harvest Plan (Inverse Pyramid):
- Palier 1 (12.5%): 75,700 (Cluster A) + reversal ≥2H → entry
- Palier 2 (+12.5%): 72,500–71,200 (-4/-6% below Palier 1) → reinforcement
- TP: 50% at +12–18% from PMP → recycle cash
- Runner: hold if break & hold first R HTF (92,285)
- Invalidation: < HTF Pivot Low (83,900) or 96h no momentum
- Hedge (1x): Short first R HTF on rejection + bearish trend → neutralize below R
__________________________________________________________________________________
Multi-Timeframe Insights
__________________________________________________________________________________
Across frames, the market grinds in a capped range: higher timeframes hold key resistance while midframes lean downtrend, keeping the tape tactical.
12H/6H/2H/30m/15m (Down bias): Price capped below 92,3k with frequent fades; supports at 89,0–88,1k and the 84k cluster attract mean‑reversion bounces.
1D/4H (Up attempt but constrained): Structure can repair if 92,3k breaks and holds; until then, path of least resistance is sideways‑to‑down inside the range.
1H (Mixed): Local supply at 90,9–91,3k acts as a lid; reclaiming this band is often a precursor to testing 92,3k.
__________________________________________________________________________________
Macro & On-Chain Drivers
__________________________________________________________________________________
Macro is event‑driven into the Fed, with mixed risk gauges and soft crypto fund flows tempering trend conviction.
Macro events: Fed decision and press conference in focus; a dovish read supports a 92,3k reclaim while a firm stance risks extending the range or probing 88k/84k. Global yields firmed on ECB tone; gas prices soft aid disinflation.
External Macro Analysis: The Risk On / Risk Off Indicator leans sell; credit‑risk gauges cautious; early‑cycle tech mixed — a mid‑cycle profile that aligns with a neutral‑sell technical bias unless 92,3k flips.
Bitcoin analysis: ETF net outflows are a mild headwind; corporate bids provide dip demand but not trend control. 92k is the ceiling to clear; 88k is pivotal support.
On-chain data: Ownership concentration rising as small holders ebb; whale transfers noted but directional intent unclear; realized volatility remains muted, consistent with “controlled vol.”
Expected impact: Macro/on‑chain context supports a patient, reactive stance — bullish if 92,3k is reclaimed with volume, cautious if 88k breaks toward the 84k cluster.
__________________________________________________________________________________
Key Takeaways
__________________________________________________________________________________
Range with a cautious tilt persists beneath 92,3k as the market awaits the Fed.
- Trend: Neutral to bearish inside 92,285–94,213 resistance; buyers defend 88–84k.
- Best setup: Buy only on confirmed 84k reversal or 92,3k break‑and‑retest; fade weak rejections into 92,3–94,2k.
- Macro: FOMC guidance is the catalyst that can resolve the range and validate or negate the 92,3k reclaim.
Stay patient and surgical — in this Tarkov‑style map, the best loot is in defended zones, not in blind pushes.

DowJones Key support at 47530 Key Support and Resistance Levels
Resistance Level 1: 48132
Resistance Level 2: 48276
Resistance Level 3: 48420
Support Level 1: 47530
Support Level 2: 47366
Support Level 3: 47185
This communication is for informational purposes only and should not be viewed as any form of recommendation as to a particular course of action or as investment advice. It is not intended as an offer or solicitation for the purchase or sale of any financial instrument or as an official confirmation of any transaction. Opinions, estimates and assumptions expressed herein are made as of the date of this communication and are subject to change without notice. This communication has been prepared based upon information, including market prices, data and other information, believed to be reliable; however, Trade Nation does not warrant its completeness or accuracy. All market prices and market data contained in or attached to this communication are indicative and subject to change without notice.

S&P500 pullback as inflation risks remain tilted to the upsideThe S&P 500 fell 0.35%, snapping a four-day winning streak, as hawkish ECB commentary from Isabel Schnabel pushed global yields higher and weighed on risk appetite. Schnabel signalled comfort with expectations for another rate hike, warned that inflation risks remain tilted to the upside, and suggested the neutral rate may be rising due to AI and public investment. In response, euro overnight index swaps for Dec-2026 rose 8bps, contributing to the broader risk-off tone.
Equity losses in the US were broad-based, with 10 of 11 sectors lower, led by communication services (-1.77%) and materials (-1.66%). The Magnificent 7 fell 0.91% for its worst session in over two weeks, although semiconductors outperformed, helped by Nvidia (+1.72%). Despite the decline, the index remains less than 1% below its late-October record high, but momentum clearly cooled as yields climbed.
In after-hours trade, Nvidia gained a further ~2% after Donald Trump approved sales of its H200 AI chip to China, subject to a 25% government surcharge and sales only to “approved customers”—a potentially significant earnings tailwind if Chinese buyers are ultimately permitted to proceed.
This communication is for informational purposes only and should not be viewed as any form of recommendation as to a particular course of action or as investment advice. It is not intended as an offer or solicitation for the purchase or sale of any financial instrument or as an official confirmation of any transaction. Opinions, estimates and assumptions expressed herein are made as of the date of this communication and are subject to change without notice. This communication has been prepared based upon information, including market prices, data and other information, believed to be reliable; however, Trade Nation does not warrant its completeness or accuracy. All market prices and market data contained in or attached to this communication are indicative and subject to change without notice.

UBER Investment ThesisUBER is shifting from a ride hailing and food delivery platform into something that looks more like core logistics infrastructure and that evolution is becoming a bigger part of my bull thesis.
The stock is trading around $91, up solidly over the past year, and the chart shows a clear uptrend. Right now price is consolidating just below the prior 52-week highs, which feels more like a healthy pause than a top, especially when you look at the revenue acceleration and margin expansion underneath.
The big fundamental piece to keep an eye on is Uber Direct. This is Uber's white-label last-mile network for retailers, where the company essentially rents out its driver and courier infrastructure to e-commerce and retail players who then use it under their own brand. Think of it like Amazon's AWS moment. Uber captures full logistics revenue without the usual customer acquisition costs or marketplace risk because the retailer is already bringing the demand. This infrastructure-style revenue sits on top of the existing Mobility and Delivery volumes, so as the network scales, incremental margins should expand. That margin expansion feeds through to earnings and, over time, should support a higher multiple.
From a trading perspective, this setup argues for buying dips within the trend as long as price holds above key support levels like recent swing lows and major moving averages, and as long as earnings revisions stay positive. If execution stays on track, upside over the next 12 to 24 months could come from continued double-digit revenue growth, rising EBITDA margins, and optionality around autonomous vehicles and new logistics partnerships. In that scenario, the stock could move toward the $120 to $125 area.
On the risk side, watch for any break for supports around $80, especially if it coincides with negative news on regulation, autonomous vehicle partnerships or a slowdown in logistics growth. If that happens, it makes sense to tighten stops or step aside until the fundamental story and the price action line back up.

Bharti Airtel (BHARTIARTL) [NSE] Stock Analysis
Fundamentals remain strong: After a strong year of earnings, double-digit YoY growth, rising data consumption, and 5G rollout, the fundamentals are good. They support long-term growth. Analysts maintain a bullish outlook, with target prices above ₹2,600.
Technically, the price is above both the 50-day EMA and the 200‑day EMA, indicating a bullish structure. RSI is strong, indicating momentum.
Strategy: Wait for the stock to dip toward the 50‑day EMA and confirm a bounce with volume/momentum indicators before entering. Avoid chasing current highs; the setup favours a conservative entry on a pullback. Also, look for the RSI to cross above its MA.
Risks: Competitive pressure, regulatory changes, capex for 5G, and broader market volatility could impact near-term performance. So always protect your downside, either with an SL or a hedge strategy.
#Airtel #Stockmarket #riskmanagement

gold is buyyou can buy gold on green support
Globally, gold still looks attractive because of supportive macroeconomic factors. A recent report by Bank for International Settlements (BIS) warned of a “double bubble” – with both gold and stocks rising sharply — suggesting many investors are turning to gold as a safe-haven as equity valuations climb.

Gold is still compressed and waiting for a breakout1️⃣ Trendline
Main ascending trendline (lower): Still holding firmly → the medium-term bullish structure remains intact. Every pullback continues to react positively at this trendline.
Short-term ascending trendline (upper – mild slope): Price is moving very close to this line → showing signs of consolidation / price compression before the next directional move.
2️⃣ Resistance
4,240 – 4,245 (blue zone): Strong resistance. Price has tested this area multiple times without a clear breakout → selling pressure is still present.
4,380: Distant resistance / extended target if price successfully breaks above the resistance zone.
3️⃣ Support
4,210 – 4,215 (Fibo 0.618): Key short-term support, aligned with the short-term uptrend → a decisive zone for near-term direction.
4,135 – 4,130 (Fibo 0.5 + main ascending trendline): Strong structural support. A breakdown below this area would significantly weaken the bullish trend.
4️⃣ Primary scenarios
Holding above 4,210 – 4,215: Continued consolidation → wait for a breakout above 4,270 to confirm bullish continuation.
Break below 4,165: Price may pull back toward 4,135 – 4,140 to test demand.
👉 Overall trend: Bullish, but currently at a sensitive zone. A resistance breakout is needed to confirm continuation.
📈 Trading Plan
BUY GOLD: 4,130 – 4,132
Stop Loss: 4,122
Take Profit: 100 – 300 – 500 pips
SELL GOLD: 4,213 – 4,215
Stop Loss: 4,223
Take Profit: 100 – 300 – 500 pips

Bitcoin (BTC): Seeing Bullish Signs | Need To Re-Claim 100 EMAThe 100 EMA has been tested multiple times on BTC, yet buyers did not manage to fully secure this area. What we see is a continuation of attempts to break this zone completely and secure it, and as buyers are showing volume, we are looking for it to happen.
Setup looks decent; the zone of liquidity is our stop zone, where the major target is the 200 EMA as of now!
Swallow Academy

XAUUSD -1H SetupWatching two key demand areas for potential buy signals. Bullish outlook remains valid as long as price does not close below the marked zone.

BTCUSD — Tuesday Behavior Map | Waiting for DollarMarket Context
BTCUSD is holding tight ahead of key U.S. dollar data.
The dollar sits in oversold conditions, and BTC has spent several days absorbing buy orders at the same prices.
Price is not breaking down. It is holding and inviting participation.
This behavior often appears when the market wants traders committed before the real move develops.
Wrong Assumption
The common interpretation is that repeated long setups inside absorption must signal a safe buying zone.
In an event week, this assumption breaks down.
When the market offers the same type of entry before major USD data, the setups are usually valid only for short-term trades, not for comfortable swing exposure.
Absorption before a catalyst is positioning, not direction.
CORE5 Lens
MSM (Structure):
Short-term structure on the daily remains bullish inside the range.
On the monthly, BTC trades inside a larger bearish leg, extended toward sell-side conditions. A natural rotation toward fairer prices would not be unusual.
DGM (Geometry):
BTC sits deep in that monthly leg.
An eventual move toward the 98.467 region aligns with normal geometry, not a trend change by itself.
VFA (Volume):
Range-volume behavior supports a potential rotation higher.
Order flow around 96k–97k shows active participation from larger players without confirmation of intention.
OFD (Order Flow):
Price sprinted away from the 98.467–97.345 zone without a retest.
This left a clean liquidity pool above.
In FOMC week, the market can spike through that zone before deciding the true direction.
PEM (Execution Behavior):
Data releases can move price far intraday, but they cannot force a daily close against the underlying algorithm without real participation behind it.
Professional focus stays on the daily close, not the intraday reaction.
Execution Context
Event-week structure behaves differently.
Daily and 8H levels carry the real information.
Intraday rotations are thinner and more reactive because larger players wait for the catalyst.
Spikes inside the range are normal and do not reveal intent.
The meaningful signal appears only after participation returns post-data.
This is a week where structure is valid, signals are fragile, and confirmation comes from the higher-timeframe close.
Takeaway
BTC is not signaling direction.
It is preparing for new information.
— CORE5DAN
Institutional Logic. Modern Technology. Real Freedom.
TESLA TO BTC & TOTALThis analysis compares NASDAQ:TSLA performance relative to BINANCE:BTCUSDT .
As you can see, Tesla’s stock is showing a bullish stance against Bitcoin and appears to be at the beginning of its Elliott Wave 3.
This chart delivers Four key messages:
1.Bitcoin is expected to decline while Tesla moves higher
2.Bitcoin is expected to drop while Tesla moves into a range
3.Both are expected to decline, but Tesla is likely to fall less than Bitcoin
4.Both rise, but Tesla gains more.
I’d be happy if you shared your thoughts.
NASDAQ:TSLA
BINANCE:BTCUSDT
CRYPTOCAP:TOTAL
BINANCE:BTCUSD

XAUUSD, Expecting Buy till 4220XAUUSD, I am Expecting Buy till 4220 area where H1 FVG is available, price is rejected by H1 Overlapping PD array
good luck


EYES ON BTCUSD SHORTBITSTAMP:BTCUSD
Optional sells on btcusd short term, both btc and usd sentiment shows both of 'em are berish but btc looks more bearish. so i'm expcting a sell from 91938 down to 89k

CVNA after the rebalancing - still stalking a shortIsn’t it remarkable how effectively Andrews Pitchforks perform?
After CVNA was rebalanced following its addition to the S&P 500, price moved directly to the centerline. From here, I’m watching for a short setup.
I’m even more encouraged, as this creates additional opportunity and $'s in profit. §8-)


EURCHF uptrend continuation supported at 0.9370The EURCHF remains in a bullish trend, with recent price action showing signs of a breakout within the broader trend.
Support Zone: 0.9370 – a key level from previous consolidation. Price is currently testing or approaching this level.
A bullish rebound from 0.9370 would confirm ongoing upside momentum, with potential targets at:
0.9408 – initial resistance
0.9430 – psychological and structural level
0.9450 – extended resistance on the longer-term chart
Bearish Scenario:
A confirmed break and daily close below 0.9370 would weaken the bullish outlook and suggest deeper downside risk toward:
0.9350 – minor support
0.9335 – stronger support and potential demand zone
Outlook:
Bullish bias remains intact while the EURCHF holds above 0.9370 A sustained break below this level could shift momentum to the downside in the short term.
This communication is for informational purposes only and should not be viewed as any form of recommendation as to a particular course of action or as investment advice. It is not intended as an offer or solicitation for the purchase or sale of any financial instrument or as an official confirmation of any transaction. Opinions, estimates and assumptions expressed herein are made as of the date of this communication and are subject to change without notice. This communication has been prepared based upon information, including market prices, data and other information, believed to be reliable; however, Trade Nation does not warrant its completeness or accuracy. All market prices and market data contained in or attached to this communication are indicative and subject to change without notice.

Bitcoin coming swing move from <89000 To 95000/96000>In this video, I am looking at the short term fundamentals (FOMC), that could be impacting Bitcoin higher from <89000-90000> level to 95000 ^ possibly 96/97000.
A 4Hr trigger has already occured to take the move. I will attempt to support the entry by showing how to take a 15/45min trigger to long going into FOMC in the next video.
Profitable Trading.
Summerset
____________________
High Risk Investment Warning:
Financial products are traded on margin, and carry an extremely high degree of risk. It is very possible to lose all your capital trading them. Financial Products such CFDs (Contracts for Price Difference) are considered the most volatile and risky of the majority of financial assets, and as such will NOT be suitable for everyone to trade. Most importantly, CFDs are derivative products of, / (and are) impacted by several financial issues and asset classes. Because several complex fundamentals become intertwined. It becomes very hard, even for professionals to assess and acutely understand ALL the risks involved. Under volatile market conditions, Losses could well exceed the account’s initial deposits. Therefore Please think very carefully whether such trading portfolios' suit you. Take into consideration all of your personal relevant circumstances as well as your personal resources, and DO NOT POST your entire account balance to meet margin requirements. Clients can minimize their level of risk exposure by requesting a change in leverage limits. For more information on this please refer to your broker’s Risk Disclosure. Further, do not wavier seeking independent expert and legal advice on trading issues and their suitability to yr geographical location.
-------------------------------------------------------------

EURAUD further selling pressure below 1.7630 resistanceThe EURAUD currency pair continues to display a bearish outlook, in line with the prevailing downward trend. Recent price action suggests a corrective pullback, potentially setting up for another move lower if resistance holds.
Key Level: 1.7630
This zone, previously a consolidation area, now acts as a significant resistance level.
Bearish Scenario (rejection at 1.7630):
A failed test and rejection at 1.7630 would likely resume the bearish momentum.
Downside targets include:
1.7500 – Initial support
1.7456 – Intermediate support
1.7380 – Longer-term support level
Bullish Scenario (breakout above 1.7630):
A confirmed breakout and daily close above 1.7630 would invalidate the bearish setup.
In that case, potential upside resistance levels are:
1.7660 – First resistance
1.7690 – Further upside target
Conclusion
EURAUD remains under bearish pressure, with the 1.7630 level acting as a key inflection point. As long as price remains below this level, the bias favours further downside. Traders should watch for price confirmation around that level to assess the next move.
This communication is for informational purposes only and should not be viewed as any form of recommendation as to a particular course of action or as investment advice. It is not intended as an offer or solicitation for the purchase or sale of any financial instrument or as an official confirmation of any transaction. Opinions, estimates and assumptions expressed herein are made as of the date of this communication and are subject to change without notice. This communication has been prepared based upon information, including market prices, data and other information, believed to be reliable; however, Trade Nation does not warrant its completeness or accuracy. All market prices and market data contained in or attached to this communication are indicative and subject to change without notice.

Breaking: Wave Life Sciences Ltd. (WVE) Spike Ovr 150%In what came as a shock, Wave Life Sciences Ltd. (WVE) broke out of a bullish symmetrical triangle surging almost 150%, extending the gains to premarket session.
NASDAQ:WVE shares are up 4% in Tuesday's premarket session aiming for a move to the $50 resistant. With increased momentum NASDAQ:WVE stock is poised to continue its bullish sojourn.
In another news, Wave Life Sciences Ltd. (Nasdaq: WVE), announced today that it has commenced an underwritten public offering of $250 million in aggregate of its ordinary shares, and, to certain investors that so choose in lieu of ordinary shares, pre-funded warrants to purchase ordinary shares. In connection with the offering, Wave intends to grant the underwriters a 30-day option to purchase ordinary shares in an amount up to an additional 15% of the total amount of ordinary shares and shares underlying pre-funded warrants sold in the public offering on the same terms and conditions. All of the securities in the offering will be sold by Wave Life Sciences.
About WVE
Wave Life Sciences Ltd., a clinical-stage biotechnology company, designs, develops, and commercializes ribonucleic acid (RNA) medicines through PRISM, a discovery and drug development platform. The company’s RNA medicines platform, PRISM, combines multiple modalities, chemistry innovation, and deep insights into human genetics to deliver scientific breakthroughs that treat both rare and prevalent disorders.

EFG Holding (HRHO) – Weekly Long Setup: Breakout PotentialEFG Holding (HRHO) – Weekly Analysis
Price is currently moving inside a long-term ascending channel, respecting both trendline support and Ichimoku cloud structure. After the recent correction from the 28.90 zone, the price is stabilizing above the trendline and inside the cloud — a typical consolidation before a potential continuation move.
📌 Entry Zone
Entry #1: Around 26.40 (current market price)
Entry #2 (Aggressive): 24
🎯 Take-Profit Targets
TP1: 29.90
TP2: 31.91
TP3: 34.93
Targets match major resistance levels + previous swing highs on the weekly chart.
🛡️ Stop-Loss
Below 23.20 (trendline + Ichimoku cloud support)
🔍 Technical Signals
Price holding the Weekly Kumo (Ichimoku) → bullish structure maintained
Supertrend still positive on weekly timeframe
MACD showing early signs of momentum recovery
StochRSI in oversold reversal zone → possible upside push
📈 Bias
Bullish as long as price remains above the ascending trendline and weekly cloud.
This setup becomes stronger if we get a weekly close above 29.00, confirming continuation toward TP2 & TP3.
⚠️ Disclaimer
This is not financial advice. Purely educational technical analysis based on chart structure.

XAUUSD Buy Signal ScalpingGOLD. Buy 4204
TP¹ 4408
TP² 4211
TP³ 4214
TP⁴ 4217
SL...4194
Not a financial advice
USE PROPER MONEY MANAGEMENT CONSISTENCY
