Xabcd

EURJPY bearish batEURJPY H1 chart formed bearish bat XABCD harmonic pattern, and the price is at a resistance zone. The RSI looks like overbought, so don't think it can break this resistance.

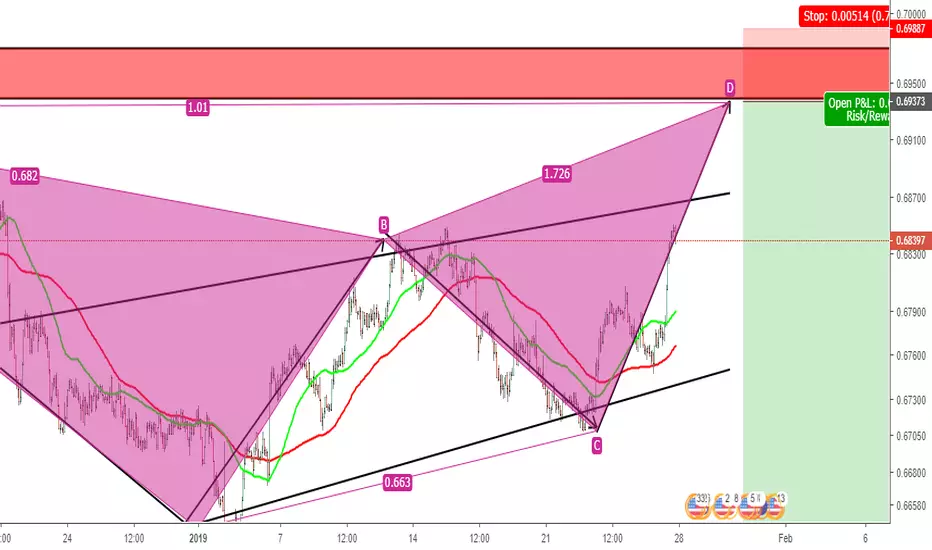
USD/JPY: XABCDHi Guys,
below I will post the link to XABCD made by GOLD but upside down. US dollar, JPY and Gold have strong correlations. These correlations makes GOLD move one way and USD/JPY the opposite.
Thank you for your support and for sharing your ideas.
Disclaimer:
Please note that I am not a professional trader and these are my personal ideas only. The information contained in this presentation is solely for educational purposes and does not constitute investment advice. The risk of trading in securities markets can be substantial. You should carefully consider if engaging in such activity is suitable to your own financial situation. CozzamaraDaZena is not responsible for any liabilities arising from the result of your market involvement or individual trade activities.

19 HK: Potential xABCD formation for -22% downsideSwire Pacific is the holding company for a HK property developer, Cathay Pacific the airline and Swire Offshore amongst other things. Since its last results announcement, HK property prices, the Chinese economy and oil prices have all cratered. Not exactly a rosy picture for the grand old Hong. Price action is potentially completing a Gartley pattern into a massive weekly downtrend line of a descending triangle which suggest lower demand for the stock on each rally. If this turns out to be a reversal (240M MACD has started to cross over), look for the stock to retest the bottom of the descending triangle at $70 which implies a -22% downside potential with well defined stop levels.

CRM: xABCD formation completion, -30% downsidePotential xABCD formation at c.$154 which also happens to be the 78.6% retracement level of the XA leg. If we extrapolate an ABCD down, the downside projection would be c.$106 which coincides with the 2012 uptrend line. If you like MA crosses, CRM is in the throes of a death cross.

nzd/usd falling wedge + double bottom pattern nzd/usd has created a past falling wedge pattern which shot up in price. Price than went to create a double bottom which I'm hoping will touch resistance and start to decelerate.
XABCD pattern has been places to show where price might fall back from.
bullish batI don't trade this pair, but I trade EUR/TRY and this is same. XABCD bullish bat pattern forming on the chart, and its oversold, so there's a nice entry for long positions.

bullish batXABCD pattern forming bullish bat on the chart, and the RSI shows us its oversold. Maybe the price will drop more to 6.07, then Euro strengthening against Turkish Lira.

Bitcoin technical analysis. BTC-USD on January 14, 2019
#BTC
On the 12-hour scale, the market has been oversold for several days already; the Stoch RSI can bounce and move up. The formation of the XABCD pattern is also seen, which may lead the price to the area 3466 corresponding to the level of Fib 0.786, which, as a rule, is often reversal and then we should expect a rebound.
Globally, the market is now very neutral: for positive, we need to rise above Fib 0.618 (about 3662, the blue area on the chart), while we are lower there is a chance to touch Fib 0.786 (about 3466, the red area on the chart) and if this support will withstand market pressure, then we will observe a noticeable rebound, if we fix under it, then we should expect a move to the area below. As long as there are no reasons for a global decline, perhaps the market will be able to form a double bottom and we will get a stronger and more significant rebound.
Not a call to action. Vision on now, we are still out of position, we have placed orders, we are waiting for entry

XABCD pattern on ONTETH?Hi guys, this is my first published idea, so please be nice :)
I think there is a nice XABCD pattern on the ONTETH chart, I am following it for 1 - 2 days and it seems to go right and I wanted to share it with you. I don't know myself very good with writing chart on Trading View, so I hope I've made a good draw and you can see it too.
This could be a nice reversal sign of the current bearish trend of Ontology.
Of course, I don't know if this will really happen and this is NOT a trading advice!

my first: XABCD pattern on EURJPY 15M, The numbers?!First time drawing a XABCD pattern, please give your thoughts in the comments below. As you can see from a - c issnt between 0.382 - 0.886 fibs
I don't have experiance with this pattern and haven't set a trade. My goal for this analysis is to learn the pattern and share my thoughts and learning from other exp. XABCD traders. Please comment below!


IOSTBTC Expected decrease and bounceAt the 1-hour timeframe chart it can be seen that a straight Head & Shoulders pattern has been formed and a half of bearish XABCD too.
Technical indicators are also bearish: Stoch RSI is going to hit overbought zone, while DMI shows low, while moving averages suggest a further reverse.
We recommend to fix profit from this bounce around 0.00000128 and rebuy again at 0.00000117


BTCUSD long to correction | XABCD + WAVESBTC is headed for a correction waves ABC, after it made bullish DIV on longer time frame. Short Fuel is on reserve already. Another point is greed - no one wants to be greedy in this times. Thats giving me propability of 70% to 30% for short-term bulls. Dont oversize or over levarage your position, dont make broker happy ;). I will be glad for thumbs up and you can also join our community on Telegram - Teenagers of Liberty

NZD/USD Bearish Crab Pattern:Waiting For Bearish ConfirmationWe see that the NZD/USD has completed a Bearish Crab Pattern on the hourly chart. '
RSI Divergence points towards potential reversal
Triple Top confirms upper resistance
Possible Short trade at .684 resistance level

XABCD pattern on GBP/USD.Just a simple XABCD pattern on GBP/USD . We will be looking to go long and will be aiming for a target zone of 1.32122. We will be opening the position if the market reaches the 1.3080 zone.

ONTBTC double bottom, bullish XABCD and the breakoutAnalysis of ONT started with bullish reverse of indicators. Then the price found and bounced from double bottom which is situated at the lower trend line of the Triangle. Lastly the price bounced and made a breakout up from the drawn point may start a bull run, in case of subsequent consolidation the price should form another XABCD and bounce from the upper side of the Triangle. Our targets will be reached in the mid term

ZECBTC High risk but profitable opportunityThe price penetrates Ichimoku cloud where the lines intersect each other. Moreover the green cloud is above the red which means the trend reversed and our buying zone acts now like a strong support.
At the 4-hour timeframe there is Bullish XABCD pattern which can help to break through descending triangle. Nevertheless there is no strong fundamental and technical background for subsequent growth, indicators are bearish. There should be a downtrend to the triangle zone again when the price reaches all our target.
However mentioned at the chart bounce can bring a good profit in the short term
4 signals including ZEC and BAT were posted in the Premium channel 2 hours ago. The rest 2 signals are kept in secret as the are based on insider info and can bring huge x2-3 gains. Do not miss the opportunity

EURUSD XABCD ANALYSISEURUSD forms an XABCD motif, marked with a double top and engulfing candle pattern on the daily. the price forecast will drop in fib. retc 1.68

BATBTC XABCD and bullish divergenceWe tracked BAT for a long time and the current moment seems to be the best to enter this position. Hidden bullish divergence is revealed due to higher lows at oscillator chart and lower lows at the price chart.
Indicators are bullish: Stoch RSI is in the oversold state, DMI shows possibility of sharp rise. Fundamentals are also great. The price is going to enter Ichimoku clouds and the pattern will be finished. Then it should reconsolidate via ladder pattern thus provide us opportunity to swing trade and rebuy lower and then it will hit the rest targets.
Free target is on the chart. Stay tuned!


OMGBTC Bullish XABCDOMG is a coin with great fundamentals its price went dip due to overall market capitalization decrease. The price bounced however an uptrend was broken and the price found a new support forming bullish XABCD pattern. Indicators become bullish which enhances the probability of this scenario.
We expect a gradual rise which will finish the pattern and then corrective consolidation. We will reenter this position when it finishes. Updates will be provided in the Premium channel
