Silver Price Retreats from a 14-Year HighSilver Price Retreats from a 14-Year High
As the XAG/USD chart shows, yesterday silver climbed above $41.40 per ounce. The last time silver traded at this level was in September 2011. The rise in XAG/USD was supported by gold surging to a record high, which we reported yesterday.
Furthermore, Goldman Sachs analysts have issued a gold price forecast for mid-2026, according to which XAU/USD could rise to:
→ $4,000 under the base case;
→ $5,000 if 1% of the private US Treasury market flows into gold. This scenario would imply a loss of Federal Reserve independence, higher inflation, and the US dollar weakening as a so-called reserve currency.
Technical Analysis of XAG/USD
Analysing XAG/USD fluctuations, we can identify two ascending channels:
→ Medium-term (shown in blue): in play since early summer;
→ Short-term (shown in purple): reflecting increased demand over the past two weeks.
Within this context, it is evident that silver has encountered a resistance cluster formed by the upper boundaries of these channels. For short- and medium-term traders, this suggests that XAG/USD may be considered overvalued → potentially triggering a wave of profit-taking on long positions.
Signs of demand exhaustion include:
→ A bearish divergence on the RSI indicator;
→ The aggressive decline from the upper channel boundary (highlighted by the orange arrow).
Bulls may find support at the median line and lower boundary of the purple channel.
Given the above, we might assume that the purple channel could still sustain silver’s upward momentum by inertia. At the same time, the formation of a bearish reversal pattern (e.g. a double top) near the upper blue boundary could occur, followed by a correction towards the psychological $40 level (where a buyer imbalance was previously observed).
This article represents the opinion of the Companies operating under the FXOpen brand only. It is not to be construed as an offer, solicitation, or recommendation with respect to products and services provided by the Companies operating under the FXOpen brand, nor is it to be considered financial advice.
XAG USD (Silver / US Dollar)

XAGUSDExamining the old bullish trend in silver promises continued bullish swings, which, given the price slope, can be considered a price target of $41.


Silver XAGUSD Overextended With Range-Bound Price Action🥈 XAGUSD (Silver) is overextended in my view 📈. Price has recently pushed into new highs 🔼 and is now moving sideways in a range 📊—often a sign that larger entities 💼 may be working their orders.
⚖️ This could be a form of distribution, as silver has moved into a zone of thin liquidity 🌊. To facilitate bigger positions, institutions may need to generate liquidity by keeping price sideways ⏸️ before the next move.
📉 My current bias is for a retracement back into equilibrium ⚖️ and towards an unresolved bullish imbalance 🔍 that remains below.
⚠️ This is for educational purposes only, not financial advice 📚

Is usoil still bullish?
Hi my dears
How are you?
Usoil seems to have the potential to move higher. I think it has the potential to reach $65.80 in the coming weeks if and only if the conditions in the picture are met.
What do you think?
Check out my analysis.

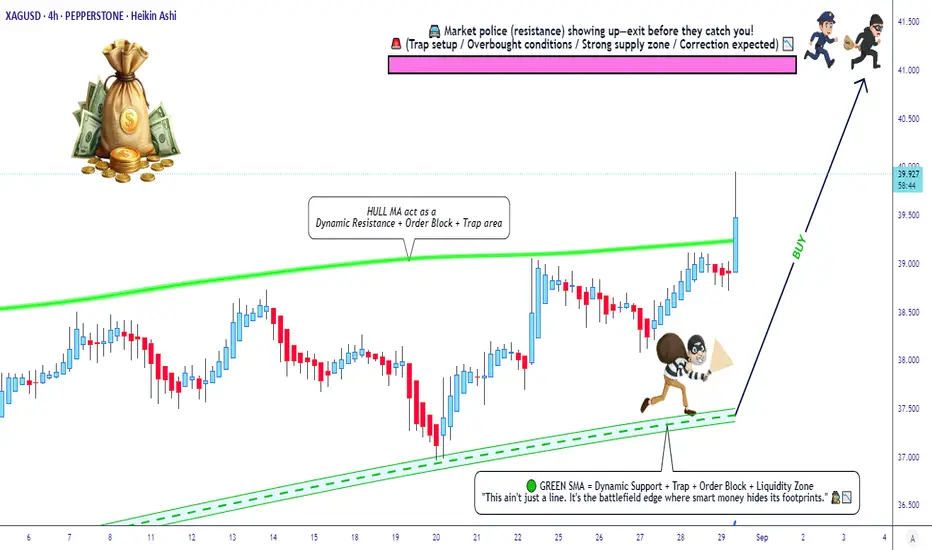
XAG/USD Market Robbery Plan – Entry, SL, and Escape Route💎 XAG/USD Silver vs U.S Dollar Heist Plan (Swing/Scalping Trade) 💰🚀
🌟Hello Money Makers, Robbers & Thief OG’s🌟
The vault is open… and this time it’s SILVER (XAG/USD)! ⚡
Based on our 🔥Thief Trading Style🔥, here’s the robbery blueprint:
📈 Entry (The Break-In):
The thief doesn’t wait at the door… we layer in quietly. Place multiple buy limit orders at:
(39.900)
(39.700)
(39.500)
(Feel free to add more layers if you want to expand the robbery bag 🏦).
Any pullback = our silent entry.
🛑 Stop Loss (Thief Escape Route):
This is Thief SL @38.700.
But remember, dear Ladies & Gentleman (Thief OG’s), adjust SL according to your own risk appetite & position size.
🎯 Target (The Police Barricade 🚓):
Police waiting heavy at 42.000 – so don’t get caught!
Our escape van target is set @ 41.000 💰.
Grab the loot and vanish before the chase starts! 🏃♂️💨
💎 Thief Notes:
Silver shines but can trap greedy robbers. Always layer in wisely, manage risk, and respect the Thief Code.
⚠️ Trading Alert:
Beware of sudden news explosions 📢 – they trigger alarms in the market vault! Use trailing SL if the loot gets heavy.
🔥💵 Support our robbery squad 💥Hit the Boost Button💥 to fuel the getaway car 🚘💨.
Every like = more strength for our crew. Stay sharp, stay stealthy, and keep robbing the market with Thief Trader Style! 🏆🥷💰
#SilverHeist #XAGUSD #ForexThief #SwingTrade #ScalpingPlan #LayeringStrategy #ThiefTrader #MarketRobbery #BullishSilver #SmartTrading
SILVER (XAGUSD): The Next Resistance
Here is my latest structure analysis for Silver.
With a current bull, run the price successfully violated
39.0 - 39.5 supply area that turned into a demand zone now.
The closest strong supply zone that I see is based on a major
rising trend line and 41.0 psychological level.
It looks like the price may easily reach that soon.
❤️Please, support my work with like, thank you!❤️
I am part of Trade Nation's Influencer program and receive a monthly fee for using their TradingView charts in my analysis.

Silver - Expecting Bullish Continuation In The Short TermM15 - Strong bullish momentum.
No opposite signs.
Until the two Fibonacci support zones hold I expect the price to move higher further.
If you enjoy this idea, don’t forget to LIKE 👍, FOLLOW ✅, SHARE 🙌, and COMMENT ✍! Drop your thoughts and charts below to keep the discussion going. Your support helps keep this content free and reach more people! 🚀
--------------------------------------------------------------------------------------------------------------------

SILVER (XAG/USD)-RESISTANCE AND SUPPORT (READ CAPTION)Hello!
Resistance: 40.700
Support: 40.500
Demand Zone: 39.600
Risk Level (Invalidation): 41.200
Silver is currently consolidating between 40.500 support and 40.700 resistance.
If buyers defend the support, price may attempt a move toward resistance.
A breakout above 40.700 could extend the bullish momentum.
If support fails, the next strong demand zone is at 39.600, where buyers may step back in.
For risk management, 41.200 is the invalidation level — if price moves above this, bearish setups become unsafe
For more safe chart updates and analysis, you can follow my profile.

SILVER RELATIVE TO GOLD/SILVER RATIO - 3 possible deep correction.
target price : 20.50$/oz.
trade invalidation level : daily close above 33.00$/oz.
good luck.

SILVER Will Keep Growing! Buy!
Hello,Traders!
SILVER is trading in an
Uptrend and the price
Made a bullish breakout
Of the key horizontal
Level of 39.53$ and the
Breakout is confirmed so
We are bullish biased
And we will be expecting
A further bullish continuation
Buy!
Comment and subscribe to help us grow!
Check out other forecasts below too!
Disclosure: I am part of Trade Nation's Influencer program and receive a monthly fee for using their TradingView charts in my analysis.

Gold | Oil | Dollar | Silver | Natural Gas Price ForecastGold | Oil | Dollar | Silver | Natural Gas Price Forecast
COMEX:GC1!
COMEX:SI1!
AMEX:UNG
NYMEX:CL1!

SILVER: Bearish Continuation is Expected! Here is Why:
The recent price action on the SILVER pair was keeping me on the fence, however, my bias is slowly but surely changing into the bearish one and I think we will see the price go down.
Disclosure: I am part of Trade Nation's Influencer program and receive a monthly fee for using their TradingView charts in my analysis.
❤️ Please, support our work with like & comment! ❤️

Gold September Seasonality (Last 10 Years: 2015–2024)Gold is heading into September after a monster run in 2024/25. Unlike the “September slump” you hear about in crypto, gold’s last decade shows mostly mild, tactical moves in September—often driven by real yields, the dollar, and physical demand cycles. Once any early-month wobble plays out, dips have tended to be opportunities within the prevailing trend.
📊 Gold September Seasonality (Last 10 Years: 2015–2024)
Yearly September Returns
Year 📈 Return
2024 🟢 +4.99%
2023 🔴 −3.73%
2022 🔴 −2.32%
2021 🔴 −4.59%
2020 🔴 −3.70%
2019 🔴 −2.55%
2018 🔴 −1.93%
2017 🔴 −1.44%
2016 🟢 +1.02%
2015 🔴 −0.27%
📌 At-a-glance stats (2015–2024)
📉 Mean (10-yr): −1.45%
⚖️ Median: −2.13%
🔴 Red months: 8 out of 10
❌ Worst September: 2021 (−4.59%)
✅ Best September: 2024 (+4.99%)
📅 Recent Performance (last 3 years)
2024: 🟢 +4.99% → strongest September in the set
2023: 🔴 −3.73% → higher real yields weighed on bullion
2022: 🔴 −2.32% → strong USD + aggressive Fed hikes
➡️ Average of last 3 years: 🔴 −0.35%
➡️ Average of last 5 years (2020–2024): 🔴 −1.87%
________________________________________
🔎 Key Insights
• Gentle September bias: Over the last decade, September has skewed slightly negative for gold (mean −1.45%), but the drawdowns are modest compared to risk assets.
• Cycle matters more than calendar: 2020–2023 saw consistent reds as the dollar firmed and real yields rose; 2024 flipped green as rate-cut expectations and central-bank demand underpinned prices.
• Long-term seasonality ≠ last-decade reality: Multi-decade studies often show gold firming into late summer/early autumn (festival/jewelry demand, restocking), but the last 10 years were dominated by policy and yields—diluting that classic pattern.
________________________________________
🚀 Macro & Market Context
• 2019–2020: Trade tensions into COVID—gold corrected in Sep ’19 (−2.6%) and more so in Sep ’20 (−3.7%) after August’s spike to new highs.
• 2021: Fed taper talk + rising real yields → weakest September (−4.6%).
• 2022: King Dollar & rapid hikes → another red September (−2.3%).
• 2023: Real yields kept pressure on bullion (−3.7%).
• 2024: Sentiment flipped on policy expectations and persistent central-bank demand → solid +5.0% September.
________________________________________
🧭 Takeaway
Gold’s September over the last decade has leaned slightly bearish, but mostly in controlled, single-digit moves. The signal isn’t “sell September,” it’s “watch real yields, the USD, and physical flows.” When those line up, the calendar fade loses its bite—as 2024 showed.

SILVER Set To Fall! SELL!
My dear followers,
I analysed this chart on SILVER and concluded the following:
The market is trading on 39.719 pivot level.
Bias - Bearish
Technical Indicators: Both Super Trend & Pivot HL indicate a highly probable Bearish continuation.
Target - 39.114
About Used Indicators:
A super-trend indicator is plotted on either above or below the closing price to signal a buy or sell. The indicator changes color, based on whether or not you should be buying. If the super-trend indicator moves below the closing price, the indicator turns green, and it signals an entry point or points to buy.
Disclosure: I am part of Trade Nation's Influencer program and receive a monthly fee for using their TradingView charts in my analysis.
———————————
WISH YOU ALL LUCK

SILVER BULLISH BREAKOUT|LONG|
✅SILVER is going up currently
And the price broke the key structure level of 39.52$
Which is now a support, and after the pullback
And the retest, I think the price will go up
LONG🚀
✅Like and subscribe to never miss a new idea!✅

Silver Acceleration PhaseGold and Silver are entering acceleration mode.
Silver tends to run into hyperdrive during gold's last major leg up. Gold could push to 3,800+ here, while Silver could run up to 45+.
The miners are very happy. Most of their technicals look amazing.
PAAS and FMS in particular are my favorites currently and look like they want to moon soon.

Silver Eyes 40-Resistance for a Record High BreakoutIn line with gold’s momentum and the industrial demand for silver—particularly from the growing tech and AI sectors—a clear hold above the 40 mark may extend gains toward 42, aligning with the upper border of the uptrending channel respected since 2023. A breakout beyond that border may offer a more comfortable bullish outlook for silver, with potential upside toward 46 and 50, in line with the 2011 peaks and possibly beyond.
On the downside, should momentum pull back, a clean break below 37 may extend losses toward the channel’s mid-zone near 35, where a potential rebound could emerge. If not, the next key level I’m eyeing is the lower boundary of that channel near the 30 mark, which may offer another long-term bullish positioning opportunity on the silver chart.
— Razan Hilal, CMT

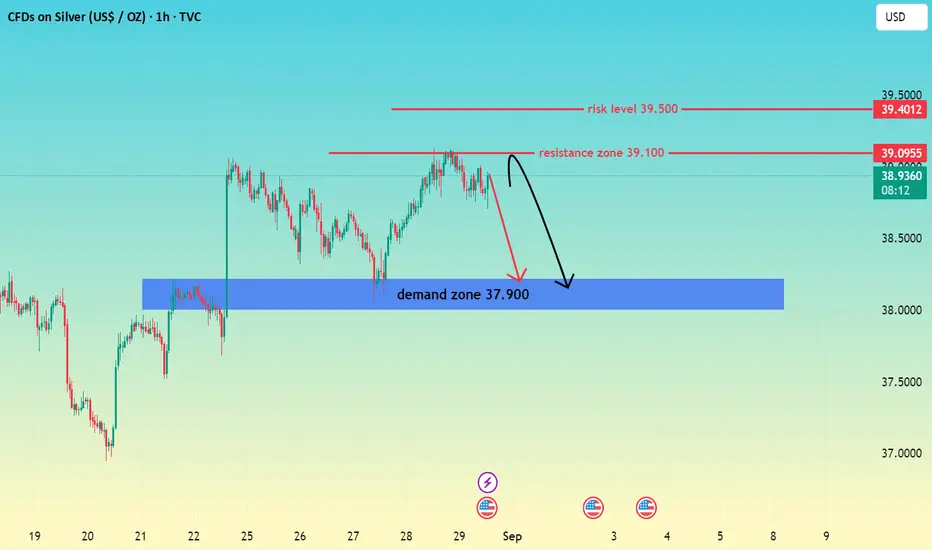
SILVER AT RESISTANCE ZONE-READ CAPTIONHi trade's
Silver price is currently approaching the resistance zone near 39.100, while the risk level remains at 39.500.
If price respects this resistance, we may see a rejection and a move back toward the demand zone at 37.900.
However, if buyers push above 39.500, the bearish setup becomes invalid.
This setup highlights a short opportunity from resistance with demand zone as the key target. Risk management is crucial, as a breakout above 39.500 may shift the trend
Resistance 39.100
Demand 37.900
Risk 39.500
Silver breakout support at 3830The Silver remains in a bullish trend, with recent price action showing signs of a continuation breakout within the broader uptrend.
Support Zone: 3830 – a key level from previous consolidation. Price is currently testing or approaching this level.
A bullish rebound from 3830 would confirm ongoing upside momentum, with potential targets at:
3965 – initial resistance
4000 – psychological and structural level
4040 – extended resistance on the longer-term chart
Bearish Scenario:
A confirmed break and daily close below 3830 would weaken the bullish outlook and suggest deeper downside risk toward:
3800 – minor support
3755 – stronger support and potential demand zone
Outlook:
Bullish bias remains intact while the silver holds above 3830. A sustained break below this level could shift momentum to the downside in the short term.
This communication is for informational purposes only and should not be viewed as any form of recommendation as to a particular course of action or as investment advice. It is not intended as an offer or solicitation for the purchase or sale of any financial instrument or as an official confirmation of any transaction. Opinions, estimates and assumptions expressed herein are made as of the date of this communication and are subject to change without notice. This communication has been prepared based upon information, including market prices, data and other information, believed to be reliable; however, Trade Nation does not warrant its completeness or accuracy. All market prices and market data contained in or attached to this communication are indicative and subject to change without notice.

SILVER Potential Short! Sell!
Hello,Traders!
SILVER keeps growing
And we are bullish biased
Mid-term but the price will
Soon hit a horizontal resistance
Of 39.52$ from where a local
Bearish pullback is to
Be expected
Sell!
Comment and subscribe to help us grow!
Check out other forecasts below too!
Disclosure: I am part of Trade Nation's Influencer program and receive a monthly fee for using their TradingView charts in my analysis.

SILVER (XAGUSD): Classic Trend-Following Setup
I see a very classic bullish model on Silver:
after a strong bullish wave, the market started to correct
within a bullish flag pattern.
Its resistance breakout always provides a reliable confirmation to buy.
I expect a rise to 39,16 now.
❤️Please, support my work with like, thank you!❤️
I am part of Trade Nation's Influencer program and receive a monthly fee for using their TradingView charts in my analysis.

Bullish Bounce Off 50% Fib Retracement?Silver (XAG/USD) has bounced off the support level, which is a pullback support that aligns with the 50% Fibonacci retracement and could rise from this level to our take profit.
Entry: 38.14
Why we like it:
There is a pullback support that lines up with the 50% Fibonacci retracement.
Stop loss: 37.58
Why we like it:
There is a pullback support that is slightly above the 78.6% Fibonacci retracement.
Take profit: 39.39
Why we like it:
There is a swing high resistance that aligns with the 127.2% Fibonacci extension.
Enjoying your TradingView experience? Review us!
Please be advised that the information presented on TradingView is provided to Vantage (‘Vantage Global Limited’, ‘we’) by a third-party provider (‘Everest Fortune Group’). Please be reminded that you are solely responsible for the trading decisions on your account. There is a very high degree of risk involved in trading. Any information and/or content is intended entirely for research, educational and informational purposes only and does not constitute investment or consultation advice or investment strategy. The information is not tailored to the investment needs of any specific person and therefore does not involve a consideration of any of the investment objectives, financial situation or needs of any viewer that may receive it. Kindly also note that past performance is not a reliable indicator of future results. Actual results may differ materially from those anticipated in forward-looking or past performance statements. We assume no liability as to the accuracy or completeness of any of the information and/or content provided herein and the Company cannot be held responsible for any omission, mistake nor for any loss or damage including without limitation to any loss of profit which may arise from reliance on any information supplied by Everest Fortune Group.
