Stop!Loss|Market View: EURUSD🙌 Stop!Loss team welcomes you❗️
In this post, we're going to talk about the near-term outlook for the EURUSD currency pair☝️
Potential trade setup:
🔔Entry level: 1.15381
💰TP: 1.14051
⛔️SL: 1.16279
"Market View" - a brief analysis of trading instruments, covering the most important aspects of the FOREX market.
👇 In the comments 👇 you can type the trading instrument you'd like to analyze, and we'll talk about it in our next posts.
💬 Description: A breakout of the support area of 1.15000 - 1.16000 remains the main and more reliable sell scenario. More aggressive sell scenarios suggest entering near the current price, that is, from the local maximum of 1.16600. It is anticipated that the price will rapidly approach the 1.14000 area if the support area indicated is broken, as buyers liquidate their positions that have accumulated in large quantities below this level.
Thanks for your support 🚀
Profits for all ✅
❗️ Updates on this idea can be found below 👇
XAG USD (Silver / US Dollar)

SilverTechnical Analysis – XAG/USD (Silver)
After a strong downtrend, the price of silver (XAG/USD) shows clear signs of seller exhaustion at the 48,000 level, which now acts as key support. A breakout of the downtrend line indicates a possible reversal and renewed buying momentum.
As long as the price remains above support, the outlook favors an upward movement toward the resistance at 51,500–52,000, where the next point of liquidity and selling interest is located.
*A close below 47,800 would invalidate the bullish scenario.

XAGUSD - Signal#XAGUSD - Signal
H4 - Formation of the 3rd wave + breakout of the trend line. Stop behind the high of the 2nd wave.
Entry: 47.72828
TP: 46.31355 - 45.58804 - 44.36677 - 41.16757
Stop: 49.09465

Silver’s Bull Run Isn’t Over Yet – Here’s Why!Hey traders, today is a great time to revisit the Silver vs. Gold debate .
Fundamentally, Silver ( OANDA:XAGUSD ) is currently hitting some pretty impressive levels. In fact, we’ve just seen Silver break above its All-Time High(ATH), surpassing $50, driven by strong industrial demand and global economic uncertainties .
What does this mean for us? Well, while Gold ( OANDA:XAUUSD ) remains the classic safe haven, silver’s dual role—both as a precious metal and a key industrial commodity—gives it a unique edge right now. The recent breakout suggests that silver might actually be an even more compelling bullish play than gold in the current market environment.
So if you’re feeling bullish, there’s a solid fundamental case for silver shining a bit brighter these days. Let's keep an eye on how it moves.
---------------------------------------------------------
Let’s dive into the 4-hour timeframe for silver . Recently, with the help of a head and shoulders pattern , silver began a correction and reached its target .
At the moment, it looks like Silver has completed its pullback to a heavy resistance zone($49.82-$43.00) and is now moving near a Potential Reversal Zone(PRZ) and a Support line .
From an Elliott Wave perspective , it seems that silver has completed its main wave 3(New ATH=$49.82) and is currently working through its main wave 4 , which so far looks like a Zigzag Correction .
I expect that Silver will resume its upward movement and climb at least up to about $50.77(First Target) .
Second Target: $52.61
Stop Loss(SL): $45.82(Worst)
Please respect each other's ideas and express them politely if you agree or disagree.
Silver/ U.S. Dollar Analyze (XAGUSD), 4-hour time frame.
Be sure to follow the updated ideas.
Do not forget to put a Stop loss for your positions (For every position you want to open).
Please follow your strategy and updates; this is just my Idea, and I will gladly see your ideas in this post.
Please do not forget the ✅' like '✅ button 🙏😊 & Share it with your friends; thanks, and Trade safe.

Silver support retest at 4737The Silver remains in a bullish trend, with recent price action showing signs of a corrective pullback within the broader uptrend.
Support Zone: 4737 – a key level from previous consolidation. Price is currently testing or approaching this level.
A bullish rebound from 4737 would confirm ongoing upside momentum, with potential targets at:
4980 – initial resistance
5066 – psychological and structural level
5166 – extended resistance on the longer-term chart
Bearish Scenario:
A confirmed break and daily close below 4737 would weaken the bullish outlook and suggest deeper downside risk toward:
4667 – minor support
4600 – stronger support and potential demand zone
Outlook:
Bullish bias remains intact while the silver holds above 4737. A sustained break below this level could shift momentum to the downside in the short term.
This communication is for informational purposes only and should not be viewed as any form of recommendation as to a particular course of action or as investment advice. It is not intended as an offer or solicitation for the purchase or sale of any financial instrument or as an official confirmation of any transaction. Opinions, estimates and assumptions expressed herein are made as of the date of this communication and are subject to change without notice. This communication has been prepared based upon information, including market prices, data and other information, believed to be reliable; however, Trade Nation does not warrant its completeness or accuracy. All market prices and market data contained in or attached to this communication are indicative and subject to change without notice.

Stop!Loss|Market View: NZDUSD🙌 Stop!Loss team welcomes you❗️
In this post, we're going to talk about the near-term outlook for the USDCAD currency pair☝️
Potential trade setup:
🔔Entry level: 0.57463
💰TP: 0.56839
⛔️SL: 0.57955
"Market View" - a brief analysis of trading instruments, covering the most important aspects of the FOREX market.
👇 In the comments 👇 you can type the trading instrument you'd like to analyze, and we'll talk about it in our next posts.
💬 Description: The New Zealand dollar continues to trade in a mid-term downtrend. Currently, this currency pair, as a commodity currency, is one of the most promising buying instruments for the USD, with further strengthening expected in the near future. Current prices are favorable for potential selling, but a false breakout near 0.57550 is possible, which would provide an even more reliable sell signal.
Thanks for your support 🚀
Profits for all ✅
❗️ Updates on this idea can be found below 👇

SILVER LIKELY TO GO HIGHER|LONG|
✅SILVER is currently trading within a bullish dealing range between the demand and supply areas. After engineering liquidity beneath internal equal lows, strong displacement confirms bullish order flow. Expect continuation toward external liquidity above 50.50$. Time Frame 4H.
LONG🚀
✅Like and subscribe to never miss a new idea!✅

Gold | Oil | Dollar | Silver | Natural Gas Price ForecastGold | Oil | Dollar | Silver | Natural Gas Price Forecast
AMEX:BOIL AMEX:KOLD NYMEX:CL1! COMEX:GC1!

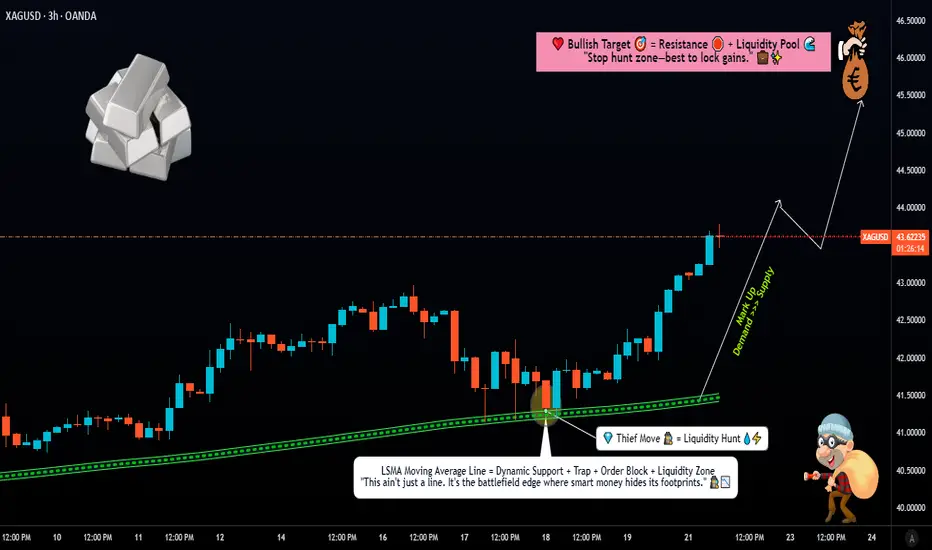
Silver Rally in Play – Prepare Layered Entries!🔥 Silver Heist: XAG/USD Day Trade Wealth Map 🤑💰
🎉 Ladies & Gentlemen, Welcome to the Thief’s Vault! 🚨 Get ready to swipe some shiny profits with this XAG/USD (Silver vs. US Dollar) bullish breakout plan! Our Metal Market Wealth Strategy Map is locked and loaded for a day trade adventure. Let’s dive into the heist with a polished, professional, yet sneaky fun vibe! 😎
📈 The Setup: Bullish Bandits on the Move! 🐂
🔍 Market Context: Silver (XAG/USD) is flashing bullish vibes 📡 with a confirmed Least Squares Moving Average (LSMA) pullback. The price has swept liquidity at the dynamic moving average support, giving bull traders the upper hand. 💪
🚀 Why It’s Hot: The bulls are charging as the price respects the dynamic support, signaling strength and a potential breakout. The market’s screaming, “Time to stack those silver bars!” 🪙
🏦 The Heist Plan: Thief-Style Layered Entries 🎯
🛡️ Entry Strategy: We’re using the infamous Thief Layering Strategy! 🕵️♂️ Place multiple buy limit orders to catch the price at key levels. Suggested entry layers:
$42.50
$43.00
$43.50
💡 Pro Tip: Feel free to add more layers based on your risk appetite! Stack those orders like a master thief. 😏
📝 Entry Note: You can enter at any price level within the bullish zone, but layering gives you the edge to scale in like a pro. 📊
🛑 Stop Loss: Protect the Loot! 🔒
🛑 Thief SL: Set your stop loss at $41.50 to keep your capital safe from market traps. 🕳️
📣 Note: Dear Thief OG’s (Ladies & Gentlemen), this SL is my suggestion, but it’s your heist, your rules! Adjust based on your risk tolerance and make those profits yours. 💸
🎯 Take Profit: Cash Out Like a Boss! 💼
🎯 Target: We’re aiming for $46.00, where strong resistance, overbought conditions, and potential traps await. 🪤 Lock in profits before the market pulls a fast one!
📣 Note: Dear Thief OG’s, this TP is my call, but you’re the master of your vault! Take profits at your discretion and secure the bag. 🤑
🔗 Related Pairs to Watch 👀
🔎 #XAUUSD (Gold vs. US Dollar): Gold and silver often move in tandem due to their precious metal correlation. A bullish XAU/USD could reinforce our XAG/USD setup. 🪙
🔎 USD Index (#DXY): A weaker US dollar typically boosts precious metals. Watch for DXY weakness to confirm bullish momentum in XAG/USD. 📉
🔎 #AUDUSD: The Aussie dollar has a positive correlation with silver due to Australia’s commodity-driven economy. A rising AUD/USD could signal strength in XAG/USD. 🇦🇺
🔑 Key Points & Correlations
🔔 Liquidity Sweep: The recent pullback to the LSMA support cleared out weak hands, setting the stage for a bullish surge. 🚀
🔗 Correlation Insight: Silver’s price action often mirrors gold (XAU/USD) due to their shared safe-haven status. A declining DXY or rising AUD/USD can amplify this setup’s potential. 📊
⚖️ Risk Management: Use the layered entry strategy to spread risk and maximize reward. Always respect your stop loss to avoid getting caught in a market trap! 🕵️♂️
⚠️ Disclaimer
This is a Thief-Style Trading Strategy crafted for fun and educational purposes. Trading involves risks, and I’m not a financial advisor. Always do your own research and trade at your own risk. 😎
✨ If you find value in my analysis, a 👍 and 🚀 boost is much appreciated — it helps me share more setups with the community!
#️⃣ #XAGUSD #Silver #DayTrading #ThiefStrategy #Bullish #TradingView #SilverTrading #DayTrade #ThiefTrader #LSMA #ForexStrategy #MetalMarket #TradingIdeas #LayeredEntries #BullishSetup #TradingView
Market Insight: Silver’s Next Move Hinges on MA Breakout!🎯 XAG/USD: The Great Silver Heist - Bearish Breakout Setup! 💰
📊 ASSET OVERVIEW
Pair: XAG/USD (Silver vs U.S. Dollar)
Market: Precious Metals
Strategy Type: Swing/Day Trade
Bias: 🐻 BEARISH
🎭 THE HEIST PLAN (Trading Setup)
🔴 Entry Zone: The Breakout
Level: $49.50 (MA Breakout Zone)
Signal: Waiting for price to break below moving average support
Confirmation: Clean break with volume + momentum shift
🛑 Stop Loss: The Safety Vault
Level: $52.00
Purpose: Protection for potential pullback scenarios
Note: This SL accommodates a possible bounce before continuation down
⚠️ Risk Disclaimer: Fellow traders, this stop loss is MY risk tolerance. YOU decide your own risk parameters. Trade what YOU can afford to lose. Your money, your rules! 🎰
🎯 Target: The Escape Route
Primary Target: $47.00
Why This Level?
🚧 Strong resistance zone acting as support (role reversal)
📈 Overbought conditions on lower timeframes
Potential bull trap zone - perfect profit extraction point
⚠️ Profit Disclaimer: This is MY target based on MY analysis. YOU make your own profit decisions. Lock gains when YOUR strategy says so. Always secure the bag at YOUR comfort level! 💼
🔍 TECHNICAL ANALYSIS BREAKDOWN
Key Factors:
Moving Average Breakdown - Price rejecting MA as new resistance
Market Structure - Lower highs forming on H4/D1 timeframes
Resistance Cluster - Multiple confluences at $52 area
Volume Profile - Decreasing buy pressure
What I'm Watching:
📉 Sustained close below $49.50
📊 Volume confirmation on breakdown
🕒 Time alignment with USD strength cycles
💱 RELATED PAIRS TO MONITOR (Correlation Watch)
Metals Family:
XAU/USD (Gold) - Moves in tandem with silver ~70% correlation
GC1! (Gold Futures) - Leading indicator for precious metals sentiment
HG1! (Copper Futures) - Industrial metals correlation
USD Strength Plays:
TVC:DXY (Dollar Index) - Inverse correlation with metals
FX:EURUSD - Risk-on/risk-off sentiment gauge
FX:USDJPY - Safe haven flow indicator
Key Point: When DXY 📈 = Precious metals 📉 typically. Watch Fed policy signals and real yields for directional bias!
🎪 THE "THIEF STYLE" STRATEGY PHILOSOPHY
This setup follows the "steal profits when the market sleeps" approach:
🎯 Identify overextended moves
⏰ Wait for breakout confirmation
💨 Execute with precision
🏃 Escape before the reversal
It's all about timing, patience, and taking what the market gives!
Conduct your own research (DYOR)
Use proper risk management
Never risk more than you can afford to lose
Consider consulting a licensed financial advisor
💼 No Guarantees: No trading outcome is guaranteed. Markets are unpredictable. Trade responsibly!
📢 ENGAGEMENT FOOTER
✨ "If you find value in my analysis, a 👍 and 🚀 boost is much appreciated — it helps me share more setups with the community!"
🏷️ HASHTAGS
#XAGUSD #Silver #PreciousMetals #BearishSetup #SwingTrading #DayTrading #ForexTrading #MetalsTrading #TechnicalAnalysis #BreakoutStrategy #SilverTrading #USD #DXY #ForexSignals #TradingIdeas #ChartAnalysis #PriceAction #RiskManagement #ForexCommunity #TradingView #MarketAnalysis
🎬 End of Analysis | Trade Safe, Trade Smart! 🎬

Siver may reach ATH again but not gold. 26/Oct/25 XAGUSD based on wave substructure silver may reach ATH again next week with price touching the upper trendline ( red) 3rd time at 55 +/-

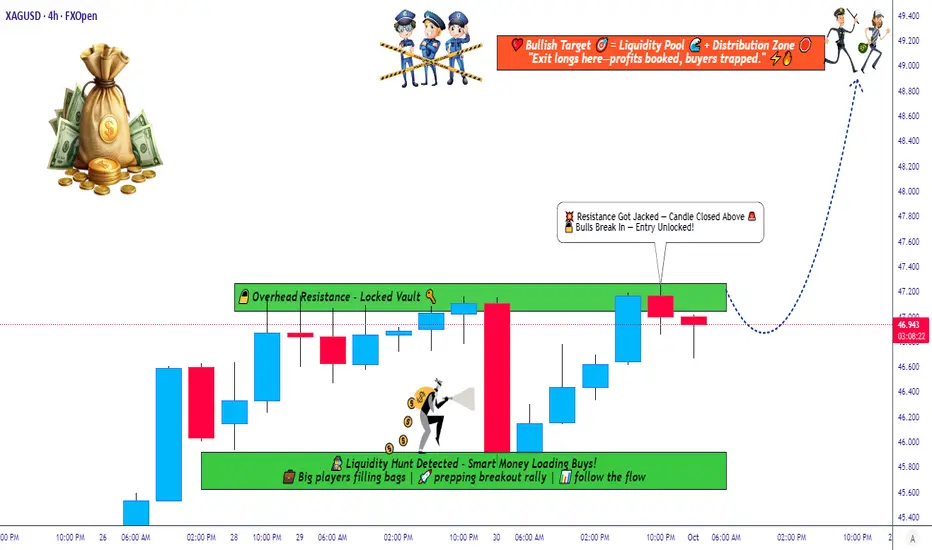
Silver Strategy Map — Thief Layers, Smart Targets, and Risk Zone📊 XAG/USD “Silver vs U.S Dollar” — Metals Market Wealth Strategy Map (Swing/Day Trade)
🔑 Plan: Bullish Setup
This setup follows the “Thief Strategy”, which means using layered limit entries to scale into the trade. Instead of going all-in at one level, we “steal the entries” across multiple layers.
💰 Layered Buy Limit Entries (Example Setup):
46.200
46.400
46.600
46.800
47.000
👉 You can increase layers as per your own plan and risk style.
🛑 Stop Loss (Protective Exit): 45.600
(This is my thief SL — but you’re free to adjust as per your own risk appetite.)
🎯 Target Zone: 49.000
⚠️ Around 49.300, we see a “Police Barricade” (heavy resistance + overbought conditions + potential trap).
That’s where profits should be taken — escape with gains before the trap closes!
Why This Setup?
Support Zones: Strong accumulation zones forming near 45.600–46.000.
Trend Bias: Silver remains bullish in the medium-term metals market outlook.
Layering Strategy Advantage: Reduces entry risk and allows better average fill.
Profit Zone: 49.000 aligns with strong supply area + RSI extension risk.
🔗 Correlation & Related Pairs to Watch
OANDA:XAUUSD (Gold vs USD): Gold often leads Silver’s moves — watch Gold for early signals.
TVC:DXY (US Dollar Index): A weaker USD usually boosts metals.
TVC:PLATINUM & CAPITALCOM:PALLADIUM : Industrial metals correlation — strong moves here can influence Silver sentiment.
TVC:SILVER Futures: Always track COMEX Silver contracts for volume confirmation.
✨ “If you find value in my analysis, a 👍 and 🚀 boost is much appreciated — it helps me share more setups with the community!”
📌 Disclaimer: This is a Thief-style trading strategy, created just for fun and educational sharing. Not financial advice — trade at your own risk.
#XAGUSD #Silver #Metals #TradingStrategy #SwingTrade #DayTrade #ThiefStrategy #Gold #DXY #Forex #Commodities
SILVER Local Long! Buy!
Hello,Traders!
SILVER SMC based analysis shows price reacting from the horizontal demand area where liquidity has been swept and bullish order flow may soon resume. Expecting a possible push upward toward the next target level once internal structure confirms a shift. Time Frame 5H.
Buy!
Comment and subscribe to help us grow!
Check out other forecasts below too!
Disclosure: I am part of Trade Nation's Influencer program and receive a monthly fee for using their TradingView charts in my analysis.

Silver corrective pullback support at 4737The Silver remains in a bullish trend, with recent price action showing signs of a corrective pullback within the broader uptrend.
Support Zone: 4737 – a key level from previous consolidation. Price is currently testing or approaching this level.
A bullish rebound from 4737 would confirm ongoing upside momentum, with potential targets at:
4980 – initial resistance
5066 – psychological and structural level
5166 – extended resistance on the longer-term chart
Bearish Scenario:
A confirmed break and daily close below 4737 would weaken the bullish outlook and suggest deeper downside risk toward:
4667 – minor support
4600 – stronger support and potential demand zone
Outlook:
Bullish bias remains intact while the silver holds above 4737. A sustained break below this level could shift momentum to the downside in the short term.
This communication is for informational purposes only and should not be viewed as any form of recommendation as to a particular course of action or as investment advice. It is not intended as an offer or solicitation for the purchase or sale of any financial instrument or as an official confirmation of any transaction. Opinions, estimates and assumptions expressed herein are made as of the date of this communication and are subject to change without notice. This communication has been prepared based upon information, including market prices, data and other information, believed to be reliable; however, Trade Nation does not warrant its completeness or accuracy. All market prices and market data contained in or attached to this communication are indicative and subject to change without notice.

Stop!Loss|Market View: GOLD🙌 Stop!Loss team welcomes you❗️
In this post, we're going to talk about the near-term outlook for GOLD ☝️
Potential trade setup:
🔔Entry level: 3995.914
💰TP: 3646.967
⛔️SL: 4195.976
"Market View" - a brief analysis of trading instruments, covering the most important aspects of the FOREX market.
👇 In the comments 👇 you can type the trading instrument you'd like to analyze, and we'll talk about it in our next posts.
💬 Description: The current accumulation of 4005 - 4143 has formed the basis for a further decline toward 3600 - 3700. Two sell scenarios are being looked for, the more likely of which involves a potential trade on a breakout of the lower border. An alternative scenario involves the formation of a false breakout at the upper border of this accumulation.
Thanks for your support 🚀
Profits for all ✅
❗️ Updates on this idea can be found below 👇

#XAGUSD(SILVER):Is Bull Run Over? Major Correction On the Way? Dear Traders,
Silver has experienced a significant decline since the DXY began to recover. The price is likely to continue falling and we believe this may be the commencement of a major decline. We anticipate a smooth drop based on previous price reactions.
**Potential Entry Zone:**
- Enter when the price reaches the FVG area marked with a white box. The initial take profit can be set at $45 and the swing trade at $40.
**Support:**
- We would appreciate your support by liking and commenting on our ideas which will encourage us to post more in the future.
Team Setupsfx

POSSIBLE XAGUSD SHORT SETUPANALYSIS
Last week:
>FRD(first red day) on Fri last week closing below Thurs low facilitating a CISD
This week:
>Mon price closed as an inside day
>Tues price closed in breakout(CIB) making the second day of bearish orderflow.
>Wed price closed in breakout as well however the price action was more of a range hence perceived as reaccumulation(acc)
>Thur: anticipating a purge and revert off Wed high and continuation of the bearish trend

Stop!Loss|Market View: BTCUSD🙌 Stop!Loss team welcomes you❗️
In this post, we're going to talk about the near-term outlook for the BTCUSD ☝️
Potential trade setup:
🔔Entry level: 107751.78
💰TP: 96726.16
⛔️SL: 114171.76
"Market View" - a brief analysis of trading instruments, covering the most important aspects of the FOREX market.
👇 In the comments 👇 you can type the trading instrument you'd like to analyze, and we'll talk about it in our next posts.
💬 Description: The main scenario for sell via a breakout of the lower border of the global accumulation of 110,000 - 122,000 remains. The price has already tested the lower border 4 times, indicating clear seller initiative. Following a downward breakout, the price is expected to approach at least the 100,000. A target near 90,000 is also looked for.
Thanks for your support 🚀
Profits for all ✅
❗️ Updates on this idea can be found below 👇

Stop!Loss|Market View: GBPUSD🙌 Stop!Loss team welcomes you❗️
In this post, we're going to talk about the near-term outlook for the GBPUSD currency pair☝️
Potential trade setup:
🔔Entry level: 1.33425
💰TP: 1.32176
⛔️SL: 1.34167
"Market View" - a brief analysis of trading instruments, covering the most important aspects of the FOREX market.
👇 In the comments 👇 you can type the trading instrument you'd like to analyze, and we'll talk about it in our next posts.
💬 Description: For the pound, sell priorities are still in place. A retest of the 1.32870 support area is expected here in the near future. Sell trade is looked for from current prices (as the primary scenario), but manipulation (a false breakout) should be expected in the event of a further retest of the 1.34500 resistance area, after which a sell should be looked for again at more favorable prices. The 1.30000 level is considered a medium-term target.
Thanks for your support 🚀
Profits for all ✅
❗️ Updates on this idea can be found below 👇

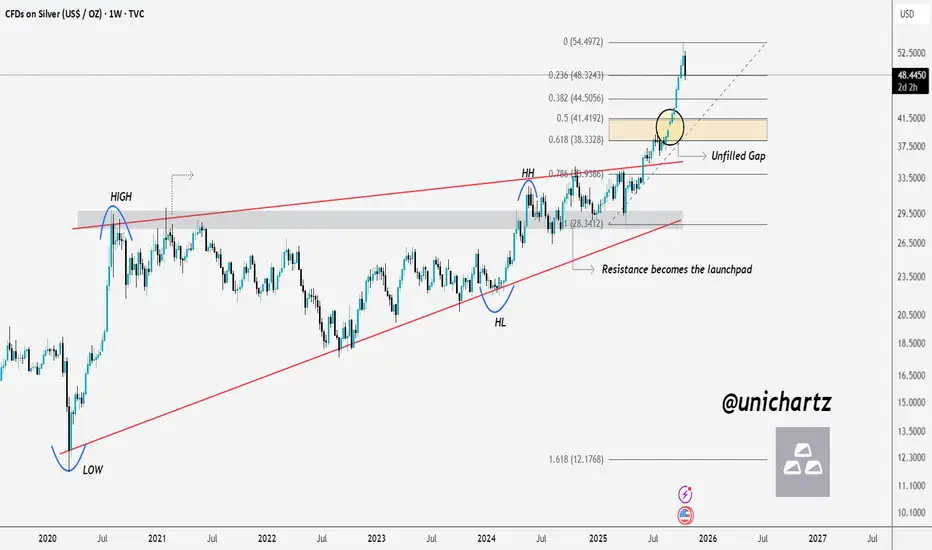
Correction Incoming – Silver Eyes Fib ZoneSILVER Weekly Analysis 🪙
At first, Silver faced strong rejection from the resistance zone, but once it finally broke out, the price came back to retest that same resistance — which then turned into a powerful launchpad, sending prices to new all-time highs.
Currently, the price is showing early signs of a correction. I’m expecting a possible retest of the Golden Fib Zone (0.5–0.618), where there’s also an unfilled gap near the 0.5 level. A move toward that area would make sense before the next major leg higher.
Resistance becomes the launchpad.
DYOR, NFA
Thanks for reading! Appreciate your support and engagement 🙏
Silver Price Falls Below $50Silver Price Falls Below $50
According to the XAG/USD chart, silver has fallen below the $50 mark after setting a historic high on 17 October, when the price briefly climbed above $54.40 for the first time.
Since then, the market has turned lower:
→ Silver formed a bearish ABCD pattern and broke below the key $50 psychological level.
→ A similar move occurred in gold, which dropped this week from around $4,375 to nearly $4,000 per ounce.
As many media outlets have noted:
→ The decline in precious metals appears to be a correction within a broader uptrend;
→ The fundamental outlook remains strong.
However, the aggressive nature of the sell-off raises concern.
→ On one hand, the drop may have been driven by an overheated rally and heavily leveraged long positions.
→ On the other, the speed of the decline suggests the autumn metals rally could be nearing exhaustion.
Technical Analysis of the XAG/USD Chart
An analysis of XAG/USD reveals several key turning points, allowing the construction of a widened ascending channel. This week’s drop has stretched the channel downward, effectively turning the former lower boundary into the new median line.
Bullish perspective:
→ The new lower boundary of the expanded channel acts as strong support.
→ A bullish RSI divergence has formed.
→ Price action near point D this morning resembles a potential Triple Bottom pattern.
Bearish perspective:
→ Selling pressure this week has been highly effective, with bears managing to break through:
$52.60, which has now flipped from support to resistance;
The $50 psychological level.
Given the above, it is reasonable to assume that bulls may attempt to use the lower boundary of the expanded channel to restart the autumn uptrend. However, after such a sharp sell-off, confidence may remain fragile. Should $50 now act as resistance, bears could target the next support near $45.88.
This article represents the opinion of the Companies operating under the FXOpen brand only. It is not to be construed as an offer, solicitation, or recommendation with respect to products and services provided by the Companies operating under the FXOpen brand, nor is it to be considered financial advice.

SILVER (XAGUSD): Correction is Over?!
Silver shows some strength after a test of a key intraday support.
A formation of a rejection candle followed by a buying imbalance
suggests a highly probable rise.
Goal - 50.15
❤️Please, support my work with like, thank you!❤️
I am part of Trade Nation's Influencer program and receive a monthly fee for using their TradingView charts in my analysis.

Stop!Loss|Market View: SILVER🙌 Stop!Loss team welcomes you❗️
In this post, we're going to talk about the near-term outlook for SILVER ☝️
Potential trade setup:
🔔Entry level: 46.91212
💰TP: 41.26205
⛔️SL: 50.07903
"Market View" - a brief analysis of trading instruments, covering the most important aspects of the FOREX market.
👇 In the comments 👇 you can type the trading instrument you'd like to analyze, and we'll talk about it in our next posts.
💬 Description: Metals have fixed intraday decline records early this week. For now, the likelihood of continued declines is higher, and a reversal is more likely. A strong factor for continued declines in silver would be the formation of an accumulation between levels 47 and 48. In this case, a drop to level 38 could be expected. The declines in metals are explained with profit-taking, thereby strengthening the USD.
Thanks for your support 🚀
Profits for all ✅
❗️ Updates on this idea can be found below 👇
