SILVER Hitting ALL-TIME-HIGH 50$! EPIC!
Guys!
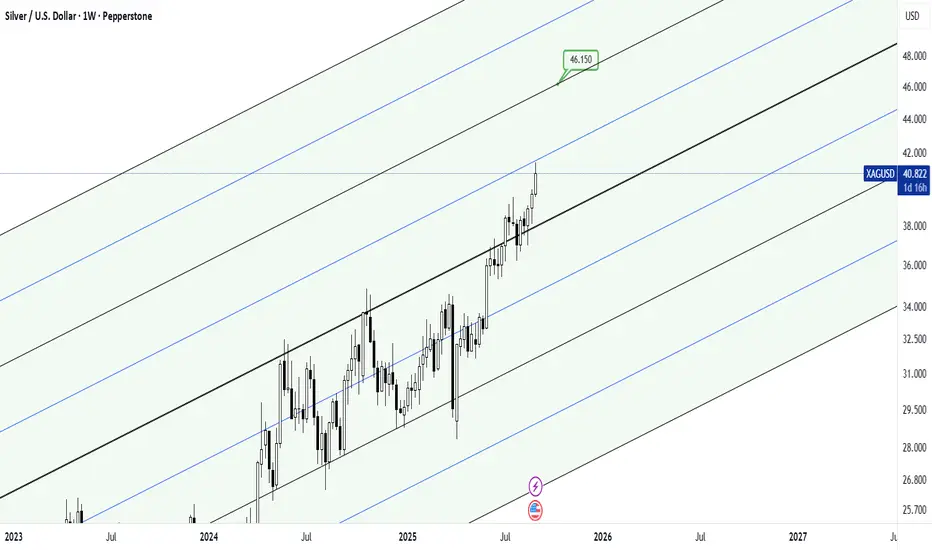
While everyone was obsessed with Gold for obvious reasons, Silver quietly made 300%!!! since 2020, and more than 65% in 2025 alone. Bitcoin? How about Silver baby?! And I am not surprised. I've been telling everyone who'd listen that Silver is epically Undervalued and here we are at an all-time-high again. From where we are bound to see a good correction.
But make no mistake! Silver will keep growing, along with Gold in the coming years and the coming I will treat the coming correction as a way to buy MORE Silver!
Precious metals are out past, present and future with no real replacement, and I oh boy will I be buying the dip!
XAG USD (Silver / US Dollar)

SILVER What Next? SELL!
My dear followers,
I analysed this chart on SILVER and concluded the following:
The market is trading on 4606.0 pivot level.
Bias - Bearish
Technical Indicators: Both Super Trend & Pivot HL indicate a highly probable Bearish continuation.
Target - 4537.7
Safe Stop Loss - 4644.6
About Used Indicators:
A super-trend indicator is plotted on either above or below the closing price to signal a buy or sell. The indicator changes color, based on whether or not you should be buying. If the super-trend indicator moves below the closing price, the indicator turns green, and it signals an entry point or points to buy.
Disclosure: I am part of Trade Nation's Influencer program and receive a monthly fee for using their TradingView charts in my analysis.
———————————
WISH YOU ALL LUCK

XAG/USD | Silver Rally Continues – Bulls Eye $44.60 & $44.80! By analyzing the Silver chart on the 2-hour timeframe, we can see that after correcting down to $43.34, the price gained demand again and rallied more than 2.5%, reaching $44.47.
Currently, silver is trading around $44.16. If the price breaks above $44.49, we could see another push higher, first retesting $44.47, and then aiming for $44.60 and $44.80 as the next targets.
Please support me with your likes and comments to motivate me to share more analysis with you and share your opinion about the possible trend of this chart with me !
Best Regards , Arman Shaban

Silver: Healthy Correction, 43.70 Support in FocusAs explained in my previous analysis, Silver extended its bullish move toward 45.00.
Naturally, after such a strong advance, the market is now undergoing a correction, with price trading around 44.30 at the time of writing.
The key point: this correction doesn’t look like a trend reversal, but rather a normal pause within the broader bullish context.
Why I remain bullish:
• Corrections are expected after sharp rallies – they allow the market to “reset.”
• The 43.70 support zone stands out as a key level where buyers could step back in.
• Market structure remains intact, with higher highs and higher lows still in place.
Trading Plan:
I continue to favor buying dips into support, with 43.70 being the ideal entry zone. As long as that level holds, Silver is well-positioned for another push higher, potentially retesting the 45.00 zone and beyond.

Silver - Expecting Bullish Continuation In The Short TermH1 - Strong bullish momentum.
No opposite signs.
Until the two Fibonacci support zones hold I expect the price to move higher further.
If you enjoy this idea, don’t forget to LIKE 👍, FOLLOW ✅, SHARE 🙌, and COMMENT ✍! Drop your thoughts and charts below to keep the discussion going. Your support helps keep this content free and reach more people! 🚀
--------------------------------------------------------------------------------------------------------------------

XAGUSD SILVER📈 Silver (XAGUSD) – Long Setup (4H)
Technical View
Price has broken out of a rectangle consolidation on the 4H chart.
Breakout is supported by bullish momentum candles.
Market structure showing higher highs (HHs) and higher lows
Trading Plan
Entry: On successful breakout retest / bullish confirmation candle.
Targets:
🎯 TP1:
🎯 TP2:
🎯 TP3:
Risk Management Rule
Once TP1 is hit, immediately move SL to entry (break-even).
Partial profits can be booked at TP1; let the rest run toward TP2 and TP3.

SILVER XAGUSD30 min TF Short Scalp
Silver is very bulish Just a pull back is what we can capture , very risky trade but Head & shoulder pattern is making it look good
Trade will be active once complete Bearish candle close below the neckline
Must book partial profit, Once achieve 50 % towards TP put your SL to tp , and partial profits

SILVER ELLIOTTWAVE ANALYSIS TVC:SILVER Near completion of Wave 5 Rally. Time for take some profits in Longs. Longs at extreme Risk now.
A deeper correction might be on cards.


SILVER (XAGUSD): Strong For Weeks! Continue To Buy! It!In this Weekly Market Forecast, we will analyze the XAGUSD (SILVER) for the week of Sept. 22 - 26th.
Silver has been strong for weeks. The industries continue strong demand from solar, electric vehicles and electronics. That, combined with supply constraints, continues to lend support to silver.
Bullish FVGs, bullish BOSs, and OLHC candles point to higher prices.
No reason to short this market.
Enjoy!
May profits be upon you.
Leave any questions or comments in the comment section.
I appreciate any feedback from my viewers!
Like and/or subscribe if you want more accurate analysis.
Thank you so much!
Disclaimer:
I do not provide personal investment advice and I am not a qualified licensed investment advisor.
All information found here, including any ideas, opinions, views, predictions, forecasts, commentaries, suggestions, expressed or implied herein, are for informational, entertainment or educational purposes only and should not be construed as personal investment advice. While the information provided is believed to be accurate, it may include errors or inaccuracies.
I will not and cannot be held liable for any actions you take as a result of anything you read here.
Conduct your own due diligence, or consult a licensed financial advisor or broker before making any and all investment decisions. Any investments, trades, speculations, or decisions made on the basis of any information found on this channel, expressed or implied herein, are committed at your own risk, financial or otherwise.

FOMC 100% Breakout (Check) - Key Resistance and 6500 Gamma PinFOMC was in fact a NOISE candle
So I measured the candle, projected a 100% breakout bullish and bearish
Bulls took the bait and ran higher, but still resistance @ 6700 seen today and hopefully
a short-term window to see a bit of a slide lower into some technical levels
EMA support levels
-watching the 21 period daily EMA
-watching the 50 period daily EMA
6550 FOMC candle lows from last week
6500 Gamma Pin with JP Morgan's quarterly collar trade
This is the first day in several weeks where I've seen some actual follow through
in negative gamma option flows
If futures grinds prices lower, the cascade may take hold and we can see a 100-200 point
selloff quickly in the S&P
I still like scooping up premium and buying the dips, but hopefully at more attractive levels
like 4-5% lower or even 8-10% lower
Let's see how it plays out. I'll be in the markets grinding per usual.
Thanks for watching!!!

Silver Daily TF AnalysisSilver Daily Analysis
Bulls Eye
- In previous analysis of XAGUSD, it was specified that a breakout above Fib Extension 1.272 level will likely fuel further upside momentum.
- On the upside, the next milestone sits near $44.0
Current Situation
- Silver has breached the ascending channel, and testing the record highs made during Aug 2011 - 44.20
- A confluence of resistance becoming hurdle for further bull side rally - including
1) the record high mark itself
2) the upper trendline of the channel
3)the fib extension level 1.414
4) The upper Bollinger band
Projections
- Prices are likely to correct, to retest the Fib Extension 1.272 (41.32), confluence with middle Bollinger band.
- However, if prices breaches the immediate, but crucial resistance at 44.20, then it might rise high towards 46.00

Silver Price Outlook: H4 Technical Charts Point to Bearish MomenSilver prices are flashing early warning signs of weakness as the 4-hour (H4) technical charts reveal a shift in momentum. After weeks of choppy price action, the metal appears to be setting up for a potential downside move in the coming days. Here’s a detailed look at the key drivers and levels to watch.
Technical Picture: H4 Chart Breakdown
Trend Structure
Silver has slipped below its short-term ascending trendline, signaling a possible break in bullish momentum.
Recent candles show lower highs and lower lows, a classic indication of bearish pressure building.
Key Moving Averages
The 50-period EMA has crossed below the 100-period EMA, reinforcing a near-term bearish bias.
Price is also trading under the 21-period EMA, suggesting that sellers are in control.
Momentum Indicators
The Relative Strength Index (RSI) is trending downward, currently hovering near the 40–45 zone—still above oversold territory, leaving room for further declines.
MACD histogram is widening on the negative side, with a fresh bearish crossover confirming selling momentum.

Silver is once again on a path that will lead to higher goals!Given the trend that began at the beginning of 2020, it seems that this precious metal has found a special place among investors and is consolidating itself in this position.
It should be noted that for whatever reason this consolidation occurs, the goals above $ 100 per ounce of silver are achievable.
The lagging behind the price of silver in comparison to the growth of the price of gold indicates attractive investment opportunities and, to quote us "noble Iranians", "maybe too soon is too late!"
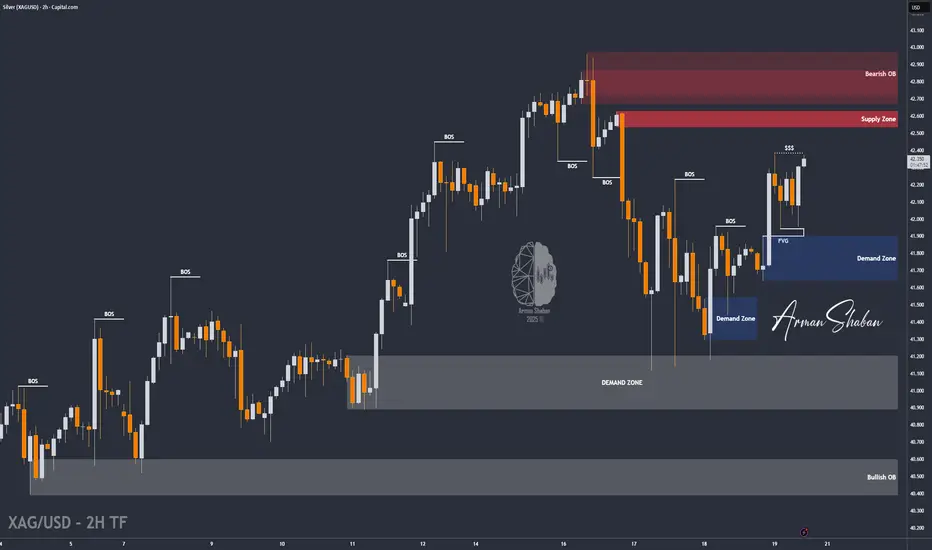
XAG/USD | Bull or Bear ? (READ THE CAPTION)By analyzing the Silver chart on the 2-hour timeframe, we can see that the price is currently trading around $42. The resistance at $42.4 is just ahead, and I expect it to be broken soon, which could push silver to higher levels.
The next target and supply zone is between $42.5–$42.65. All supply and demand zones are marked on the chart — make sure to watch them closely and follow the price reaction. This analysis will be updated again!
Please support me with your likes and comments to motivate me to share more analysis with you and share your opinion about the possible trend of this chart with me !
Best Regards , Arman Shaban
Silver Bullish breakout support at 4300The Silver remains in a bullish trend, with recent price action showing signs of a continuation breakout within the broader uptrend.
Support Zone: 4300 – a key level from previous consolidation. Price is currently testing or approaching this level.
A bullish rebound from 4300 would confirm ongoing upside momentum, with potential targets at:
4440 – initial resistance
4507 – psychological and structural level
4575 – extended resistance on the longer-term chart
Bearish Scenario:
A confirmed break and daily close below 4300 would weaken the bullish outlook and suggest deeper downside risk toward:
4246 – minor support
4180 – stronger support and potential demand zone
Outlook:
Bullish bias remains intact while the silver holds above 4300. A sustained break below this level could shift momentum to the downside in the short term.
This communication is for informational purposes only and should not be viewed as any form of recommendation as to a particular course of action or as investment advice. It is not intended as an offer or solicitation for the purchase or sale of any financial instrument or as an official confirmation of any transaction. Opinions, estimates and assumptions expressed herein are made as of the date of this communication and are subject to change without notice. This communication has been prepared based upon information, including market prices, data and other information, believed to be reliable; however, Trade Nation does not warrant its completeness or accuracy. All market prices and market data contained in or attached to this communication are indicative and subject to change without notice.

Silver Price Hits 14-Year HighSilver Price Hits 14-Year High
As shown on the XAG/USD chart, today the price of silver has climbed above $43.60 per ounce for the first time since 2011.
This may reflect expectations that the recent Federal Reserve interest rate cut will provide a boost to the global economy, where demand for silver is strengthening due to the growth of sectors such as solar energy, electric vehicles, and electronics. In addition, XAG/USD gains further support from gold, which today set a new record high above $3,720.
Technical Analysis of the XAG/USD Chart
When analysing XAG/USD price movements earlier this month, we:
→ drew an ascending blue channel;
→ noted that silver had encountered a resistance block;
→ suggested a possible corrective scenario towards the psychological $40 level.
Since then, the black line (S) has:
→ proved itself as a strong support level, preventing a decline towards $40;
→ provided enough local pivot points to update the slope of the blue channel.
As of today, silver has broken above the upper boundary of this channel (highlighting strong demand). At the same time:
→ the RSI indicator is in overbought territory;
→ the price is positioned at the upper boundary of a steeper short-term uptrend, plotted from fluctuations over the past month (shown in orange).
Thus, we could assume that XAG/USD is currently vulnerable to a correction following a nearly 10% rally since the beginning of the month, as buyers are likely tempted to take profits.
Should a pullback occur in the near term, silver may find support:
→ around $42.35 – a level that has repeatedly switched roles between resistance and support;
→ at the lower boundary of the orange channel.
Looking further ahead, we may well witness fresh records for both silver and gold before year-end – particularly if the news flow continues to fuel trader expectations of additional Fed rate cuts and inflation concerns persist.
This article represents the opinion of the Companies operating under the FXOpen brand only. It is not to be construed as an offer, solicitation, or recommendation with respect to products and services provided by the Companies operating under the FXOpen brand, nor is it to be considered financial advice.

XAUUSD H2 XABCD SHORT/LONG sequence with price targets🔸Hello traders, let’s review the 2-hour chart for GOLD (XAUUSD). Price action has been volatile, but the market continues to respect harmonic levels. We are tracking a clean XABCD harmonic structure, offering both higher-risk and lower-risk opportunities depending on your trading style.
🔸Speculative XABCD structure defined by the following pivots:
X = 3625 A = 3689 B = 3639 C = 3709 D/PRZ = 3603
This setup still pending PRZ/D point, giving us potential reversal scenarios.
Advanced short entry is from C at 3709 with target exit at D/PRZ 3603 – higher-risk setup still pending
🔸Trade Analysis and overview:
Advanced short is still available from point C at 3709 with exit target at PRZ/D 3603. This is a higher-risk play, still pending
Now we shift focus to the lower-risk reversal setup: buying near the D/PRZ level at 3603. Harmonic patterns often suggest strong bounce potential from the PRZ, making this a solid buy/hold opportunity.
🔸Strategy & Targets:
BUY/HOLD from PRZ/D = 3603
TP1 = 3700 (first profit zone / re-test of structure)
TP2 = 3750 (extended target into higher resistance)
Manage risk with proper SL placement beneath PRZ.
🔸Key Notes:
Pattern suggests a bullish reversal from current zone.
Traders should remain patient as volatility around PRZ is common.
This is a swing trade setup, so allow time for structure to develop toward TP levels.
🎁If you find this analysis useful:
Hit the like button to show support 🙌
Drop a comment and let us know your view on GOLD!

Gold | Oil | Dollar | Silver | Natural Gas Price ForecastCatch the latest commodities trading insights! This week's market analysis includes a look at both sides of the coin for oil, gold and silver. Plus, get some helpful technical analysis and trading tips to guide your decisions.
Gold | Oil | Dollar | Silver | Natural Gas Price Forecast
COMEX:GC1! COMEX:SI1! NYMEX:CL1! AMEX:UNG

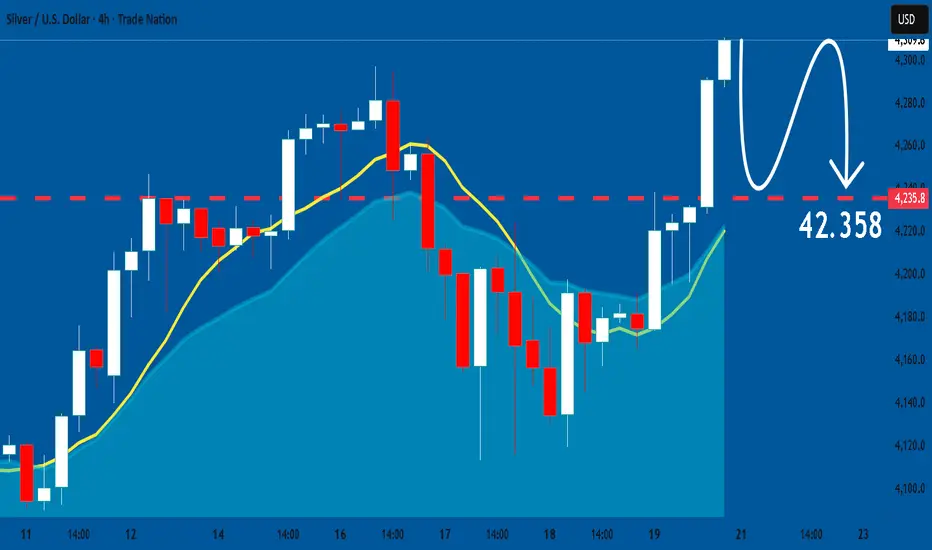
SILVER The Target Is DOWN! SELL!
My dear friends,
Please, find my technical outlook for SILVER below:
The instrument tests an important psychological level 43.096
Bias - Bearish
Technical Indicators: Supper Trend gives a precise Bearish signal, while Pivot Point HL predicts price changes and potential reversals in the market.
Target - 42.342
About Used Indicators:
Super-trend indicator is more useful in trending markets where there are clear uptrends and downtrends in price.
Disclosure: I am part of Trade Nation's Influencer program and receive a monthly fee for using their TradingView charts in my analysis.
———————————
WISH YOU ALL LUCK

SILVER: Market Sentiment & Price Action
Remember that we can not, and should not impose our will on the market but rather listen to its whims and make profit by following it. And thus shall be done today on the SILVER pair which is likely to be pushed down by the bears so we will sell!
Disclosure: I am part of Trade Nation's Influencer program and receive a monthly fee for using their TradingView charts in my analysis.
❤️ Please, support our work with like & comment! ❤️
XAGUSD Holds 41.40 Strong – Bulls Ready for 43 AgainAs I’ve often highlighted in my previous Silver outlooks, OANDA:XAGUSD usually offers cleaner technical setups than Gold, with less “noise” and fewer manipulation spikes. This time is no exception.
After touching the 43.00 zone, Silver entered a corrective phase, sliding down to 41.40 – a key confluence support. Price tested this level no less than four times, and each time buyers stepped in, eventually pushing the market higher.
Much like in Gold, this drop from the highs should not be mistaken for a trend reversal. Instead, it’s a healthy correction inside a strong uptrend. Based on the price action, we can now argue that the correction is likely complete.
📊 Trading plan:
• My strategy is to buy dips, ideally around the 41.80 zone.
• First target remains the 43.00 resistance area.
• Invalidation (negation) comes only with a daily close below 41.50.
In short, Silver has shown resilience at support, and unless 41.50 breaks, I stay with the bulls. 🚀

Silver breakout support retest The Silver remains in a bullish trend, with recent price action showing signs of a continuation breakout within the broader uptrend.
Support Zone: 4144 – a key level from previous consolidation. Price is currently testing or approaching this level.
A bullish rebound from 4144 would confirm ongoing upside momentum, with potential targets at:
4260 – initial resistance
4320 – psychological and structural level
4375 – extended resistance on the longer-term chart
Bearish Scenario:
A confirmed break and daily close below 4144 would weaken the bullish outlook and suggest deeper downside risk toward:
4065 – minor support
4020 – stronger support and potential demand zone
Outlook:
Bullish bias remains intact while the silver holds above 4144. A sustained break below this level could shift momentum to the downside in the short term.
This communication is for informational purposes only and should not be viewed as any form of recommendation as to a particular course of action or as investment advice. It is not intended as an offer or solicitation for the purchase or sale of any financial instrument or as an official confirmation of any transaction. Opinions, estimates and assumptions expressed herein are made as of the date of this communication and are subject to change without notice. This communication has been prepared based upon information, including market prices, data and other information, believed to be reliable; however, Trade Nation does not warrant its completeness or accuracy. All market prices and market data contained in or attached to this communication are indicative and subject to change without notice.
