Gold Faces Rejection at Resistance Zone – Potential Bearish CorrAnalysis:
The gold price (XAU/USD) is currently testing a strong resistance zone near $4,235–$4,240, where previous bullish momentum appears to be slowing down. Sellers are showing interest in this area, suggesting a potential bearish reversal or correction phase.
A clear support zone lies around $4,140–$4,150, which serves as the target for the expected downward move. If price breaks below this support, further declines could extend toward the next demand zone.
However, if gold breaks and closes above the resistance zone with strong volume, it could invalidate this bearish setup and open the path to new highs.
Key Points:
Resistance Zone: $4,235 – $4,240
Support Zone: $4,140 – $4,150
Short-term Bias: Bearish correction expected
Target: Support zone near $4,145
Xauusddaily

HOW MANY BUYER TRAPS BEFORE NEW ATH GOLD ?📈 Analysis of Gold Trading Plan (SMC/Order Flow)
🔍 Current Market Context
Structure: The market has shown a strong bullish trend, marked by a Break of Structure (BOS) and a Liquidity Done Sweep around the $4,145 price level.
Liquidity:
The market performed a "First Sweep Here" (initial liquidity grab) after the rally, signaling a readiness for a correction.
The main liquidity target for the upward move (Big Boy Liquidity) is set above the $4,240 level.
Recent Price Action: After hitting the peak and the initial sweep, the price experienced a sharp decline, creating a correction zone.
🎯 Proposed Trading Plan
The plan focuses on two main scenarios: a Short-term Sell (SELL SCALP) and a Primary Buy (BUY GOLD).
1. Primary Buy Scenario (BUY GOLD)
This is the main scenario to continue the bullish trend (Long).
Entry Zone: BUY GOLD 4126 - 4124.
This zone is likely a critical Order Block or an unmitigated Demand Zone, positioned just below the previous liquidity sweep and acting as a strong support/Displaced/Fair Value Gap (FVG) area.
Stop Loss (SL): SL 4120.
This stop-loss level protects the long position, placed just below the key entry zone to avoid being shaken out by minor liquidity grabs.
The indicated Stoploss Buyer area (around $4,145 - $4,150) suggests the price drop might aim to sweep prior buyers' liquidity before bouncing from the $4,124 - $4,126 zone.
Take Profit (TP): The ultimate target is the Liquidity Limit Big Boy (above $4,240).
2. Short-term Sell Scenario (SELL SCALP)
This is a short-term trading opportunity (Scalping) during the corrective move.
Entry Zone: SELL SCALP 4208 - 4210.
This area likely represents a Supply Zone or a bearish Order Block following the sharp drop, where hidden selling pressure resides.
Stop Loss (SL): SL 4212.
This is a very tight stop loss, placed just above the entry zone.
Take Profit (TP): The target is the BUY GOLD 4126 - 4124 area (the primary buy entry zone).
⚠️ Key Considerations
Timeline: This plan requires the price to move according to the predicted scenario (drop to the buy zone before rallying).
Confirmation: Traders should wait for structural confirmation on a lower timeframe (e.g., a Change of Character - CHoCH or a bullish BOS) at the 4126 - 4124 buy zone before entering the trade to improve the probability of success.
Risk Management: Using the suggested Stop Loss (SL) is mandatory for capital protection.

gold await breakout#XAUUSD price still bullish which decline holds between D1 high to 4252 for main selling rejection.
We await for 2 times breakout below 4220 to buy till 4252 which holds bearish retrace.
Above 4252 breakout sell, target 4180-4150 which holds reverse on buy, SL 4266.
Above the rectangle 4268-72 H1 closure holds bullish continuation till 4310.

"Trading is a lonely journey, but the most rewarding""Trading is a lonely journey."
I had heard that saying a long time ago, but only when I stepped onto this path did I truly understand what it meant. On the first day I placed a trade, I thought everything was simple , just a few clicks, a few flickering green and red numbers, and I could make money. But the deeper I went, the more I realized that behind the screen was a cold, silent world where I was the only one facing myself.
No one understands the feeling of watching your account evaporate in just a few seconds. Nor can anyone share the tiny joy of a winning trade, because most outsiders only see the results — not the sleepless nights, not the heartbeats racing with every moving candle. Gradually, I learned to stay quiet : no more bragging about profits, no more complaining about losses. Trading taught me that emotions are the cruelest enemy.
There are days I stare at the chart until my eyes ache, my head spinning from those merciless price waves. I ask myself, “Am I really going in the right direction? Is trading even meant for me?” But then, in silence, I open my laptop again - analyze, take notes, place orders, as if it’s a habit I can’t let go of. Every loss hurts, but it also makes me stronger . I’ve learned to accept being wrong, to be disciplined, and to live with loneliness.
Trading isn’t just a battle with the market, it’s a battle with your own ego . It’s lonely, yes, but not meaningless. In that silence, I can hear my own thoughts more clearly ,my limits, and my desire to rise beyond them. Maybe only those who have walked this path can truly understand: behind every click lies countless emotions, unseen scars that only traders carry.
Trading is a lonely journey — but it’s also one of the most valuable journeys of all.
Try harder my friend! ;)
ANFIBO_
Gold Remains Range-Bound — Focus on Selling ReboundsAs time passes, the 4-hour moving average resistance continues to shift lower, with the key resistance area now around 4004/4030. From the current candlestick structure, bearish momentum still dominates. On the daily chart, the MA30 serves as the crucial pivot level, while MA20 can be used to gauge broader trend direction. In other words, only a firm hold above the MA30 would give bulls a chance to compete, and a full trend reversal would require a confirmed breakout above the MA20.
Key short-term support remains at 3948-3921, followed by the previous low near 3885. If these levels fail to hold, attention should shift to the 3800 psychological level and support from the daily MA60.
On the news front, geopolitical tensions continue to escalate, which has provided some safe-haven demand for gold. However, given the strong rally over the past two months, gold’s traditional safe-haven appeal has weakened, and volatility has increased, giving it characteristics closer to a risk asset at times. Therefore, geopolitical factors should be referenced cautiously, with primary focus remaining on core price structure and trading logic.
Meanwhile, uncertainty around whether there will be a rate cut in December also contributes to the current consolidation. Until there is clear direction, trading should remain cautious—focus on opportunities you clearly understand and avoid greed. When the market structure becomes unclear, stay patient and reduce unnecessary trades to manage risk.

ElDoradoFx – GOLD (XAUUSD) ANALYSIS (04/11/2025, LONDON SESSION)1. Market Overview
Gold enters the London session trading just below the $4,000 handle, recovering after an early Asian dip to $3,970. The market remains in a range-to-accumulation phase, consolidating beneath descending structure resistance ($4,008–$4,016) and above key support ($3,985–$3,970). Momentum indicators suggest early bullish restoration, but price action remains capped under the 200EMA, awaiting a confirmed breakout to define London’s direction.
⸻
2. Technical Breakdown
🔹 Daily (D1)
Gold holds above the 100EMA, keeping the medium-term structure bullish. RSI at ~50.5 indicates neutrality after a corrective pullback from $4,046. As long as price stays above $3,985, the bullish structure remains intact.
🔹 H1
The pair trades within a descending channel, testing dynamic resistance at $4,004–$4,008. The 50EMA is flattening near the 200EMA, hinting at a potential cross for trend continuation. MACD is stabilizing with higher histogram lows, a bullish sign of momentum recovery.
🔹 15M–5M
Short-term structure shows a series of higher lows (3,970 → 3,982 → 3,993) but faces a clear supply ceiling at 4,004–4,010. RSI around 55–60; MACD positive, suggesting accumulation pressure and reduced selling volume.
⸻
3. Fibonacci Analysis (Swing 3,970 → 4,008)
• 38.2% = 3,993
• 50.0% = 3,989
• 61.8% = 3,985
🎯 Golden Zone: 3,993 – 3,985 → Active demand area for potential long entries.
⸻
4. High-Probability Trade Scenarios
📈 BUY SCENARIO (Primary Bias)
• Buy Zone: 3,993 – 3,985 (Golden Zone)
• Confirmation: Bullish CHoCH or engulfing candle in zone with RSI > 50
• Targets: 4,004 → 4,016 → 4,028 → 4,046
• Stop Loss: Below 3,970
📊 Justification: The Golden Zone aligns with previous liquidity sweep and ascending channel support — strong probability for continuation if defended during London volatility.
💥 Breakout BUY Setup
• Trigger: Break & close above 4,008
• Retest Entry: 4,004–4,006
• Targets: 4,016 → 4,028 → 4,046 → 4,060
• Stop Loss: Below 3,995
📉 SELL SCENARIO (Countertrend)
• Sell Zone: 4,004 – 4,016 (EMA confluence & descending structure)
• Confirmation: Bearish rejection or RSI divergence > 65
• Targets: 3,989 → 3,970 → 3,945
• Stop Loss: Above 4,020
📊 Justification: A rejection from this area would indicate failed breakout momentum, creating a high R:R short toward range support.
⚠️ Break & Retest SELL Setup
• Trigger: Break below 3,970
• Retest Entry: 3,978–3,974
• Targets: 3,965 → 3,945 → 3,920
• Stop Loss: Above 3,985
⸻
5. Fundamental Watch
• UK/EU Data: Light calendar — focus remains on USD strength and DXY (106.10).
• US Factors: Factory Orders and Fed speakers later today; could affect volatility mid-London to NY overlap.
• Sentiment: Gold remains technically bullish but constrained by short-term dollar resilience and yield stabilization.
⸻
6. Key Technical Levels
Type Levels Notes
Resistance 4,004 / 4,016 / 4,028 / 4,046 Supply + 200EMA zone
Support 3,993 / 3,985 / 3,970 / 3,965 Fibo + structural base
Golden Zone 3,993 – 3,985 Main liquidity pivot
Break Buy Trigger Above 4,008 Confirmed bullish continuation
Break Sell Trigger Below 3,970 Bearish momentum confirmation
⸻
7. Analyst Summary
Gold is building pressure within a compressed wedge, where the Golden Zone (3,993–3,985) represents the pivot of the day.
Momentum indicators lean bullish, but the 200EMA and trendline resistance near 4,004–4,008 remain the key barriers.
A clean breakout above 4,008 opens the path to 4,028–4,046, while failure to hold above 3,985 may trigger a retracement to 3,965–3,945.
⸻
8. Final Bias Summary
✅ Primary Bias: Bullish above 3,985
⚠️ Neutral Zone: 3,985–4,004 (wait for breakout confirmation)
❌ Bearish Only Below: 3,970
🎯 Expert Outlook: Focus on buying dips near the Golden Zone with confirmation; avoid premature entries before breakout validation.
⸻
🥇 ElDoradoFx PREMIUM 3.0 – PERFORMANCE 03/11/2025 💸
📊 Smart Entries | Clean Profits | No Drawdown
━━━━━━━━━━━━━━━
🪙 GOLD RESULTS
🟢 BUY +120 PIPS
🟢 BUY +30 PIPS
🔻 SELL +90 PIPS
🟢 BUY +40 PIPS
🟢 BUY LIMIT +200 PIPS
🔻 SELL +20 PIPS
🟢 BUY +40 PIPS
🟢 BUY +20 PIPS
🟢 BUY +40 PIPS
💰 GOLD TOTAL: +600 PIPS
━━━━━━━━━━━━━━━
📱 BTC/USD WEEKEND TRADES
🚀 BUY +900 PIPS
🚀 BUY +1,300 PIPS
📱 BTC TOTAL: +2,200 PIPS
━━━━━━━━━━━━━━━
📊 COMBINED GAIN: +2,800 PIPS
✅ 11 Trades → 11 Wins | 0 SL | 0 BE
🎯 Accuracy: 100%
━━━━━━━━━━━━━━━
🔥 Flawless start to November — precision entries, strong momentum, and clear profit execution across GOLD and BTC!
👏 Congratulations if you profited! ✅✅✅🚀🚀🚀

GOLD (XAU/USD): SELL/BUY Zones Await ISM Data!I. MACRO OVERVIEW (The Tug-of-War):
Gold is currently in a tight consolidation, caught between two powerful macro narratives:
⬆️ BULL CASE (Buy Pressure): Safe-Haven demand is buoyed by US Political Risk (government shutdown concerns) and global uncertainty (e.g., Nvidia chip export curb).
⬇️ BEAR CASE (Sell Pressure): Persistent USD Strength as hawkish Fed commentary continues to push back on rate cut expectations, capping Gold's upside.
🔥 CATALYST: All eyes on the US ISM Manufacturing PMI release tonight. This data point will be the decisive trigger for Gold's next short-term direction.
II. TRADING PLAN (Actionable Zones):
We are zoning in on two high-probability Liquidity Zones where we will await a Price Action Confirmation before entry:
🔴 SELL SCENARIO
SELL ZONE (Supply/FVG): $4,050 - $4,055
Rationale: Targeting a strong rejection where Smart Money is likely to distribute.
SL: $4,065
TP Targets: $4,045 - $4,035 - $4,025 - $4,015
🟢 BUY SCENARIO
BUY ZONE (POI/Demand): $3,952 - $3,948
Rationale: Looking for sustained support and reaction at a major Point of Interest.
SL: $3,940
TP Targets: $3,958 - $3,968 - $3,978 - $3,988
🚨 FINAL CHECK:
Risk Management is Paramount. Always wait for a strong Price Action Confirmation (e.g., strong rejection candles) within the designated zones before triggering an entry. DO NOT trade the news.
#XAUUSD #Gold #ISM #PriceAction #TechnicalAnalysis #Forex #TradingPlan #SmartMoneyConcept #USD #SafeHaven #TradingSignals

GOLD: HAWKISH FED Pushing the Market? $4,085 is the Test!Hey community, Gold is sitting at a critical junction. The alignment of the Fed’s pressure and a key Supply Zone is creating a high-conviction trade setup. Let's break it down.
I. FUNDAMENTALS: The Macro Headwinds 📰
Key Driver (The Bears' Argument): The Fed’s latest "hawkish" signals, with regional Presidents opposing further rate cuts, have significantly cooled market easing expectations. This solidifies the strong USD, creating heavy short-term pressure on non-yielding Gold.
Performance & Record High: Despite the immediate pressure, Gold surged 53% this year, hitting an all-time high of $4,381.21/oz on October 20th, showcasing underlying bullish demand.
Long-Term View: Morgan Stanley still supports Gold’s long-term climb (targeting $4,300/oz average by H1 2026), driven by expected rate cuts and economic instability.
Geopolitics: Trade news (e.g., discussions on US-China tariffs) adds noise, but the Fed's interest rate stance remains the dominant factor.
II. TECHNICAL ANALYSIS: The Supply & Demand Zones 🎯
The prevailing structure on the H4 chart confirms a strong DOWNTREND (Bearish Bias). The recent rally is a correction, necessary to retest key supply before the next decline.
1. The Primary SELL Setup (Following the Trend)
Optimal Supply Zone: $4,059 - $4,085. This is the key reversal zone where smart money is likely waiting to fill sell orders (discount zone for shorts).
Strategy: Wait for price to reach the $4,059 - $4,085 zone. Look for a strong rejection or pattern shift on lower timeframes to confirm the SHORT entry.
Ultimate Target (TP): The strong Demand Zone at $3,939 - $3,952.
2. The Counter-Trend BUY Zone (Bounce Potential)
Strong Demand Area: $3,939 - $3,952. This is a major structural level where Gold is likely to find strong support.
Strategy: If Gold sells off into this area, watch for buying pressure to catch a potential bounce.
🔑 FINAL TRADE CONCLUSION
Best Strategy: Wait and SHORT at the $4,059 - $4,085 Supply Zone. This is where fundamental pressure (Fed) and technical resistance perfectly align.
What's your take? Will the strength of the USD hold Gold down from here? Drop a comment! 👇
#XAUUSD #GOLD #FED #TechnicalAnalysis #ForexTrading #SupplyAndDemand #Bearish #TradingStrategy #PriceAction #MarketAnalysis

Next week's trading strategy and analysisPolicy aspect: The loose tone of the Federal Reserve remains unchanged, and the liquidity dividend continues to be released.
The expectation for interest rate cuts remains flexible: The Federal Reserve cut interest rates by 25 basis points to 3.75%-4.00% as scheduled in October. Although Powell stated that an interest rate cut in December is "not inevitable", the CME FedWatch tool shows that the probability of a 25 basis point cut in December still reaches 67.8%, which is a decrease from 95.3% before Powell's speech, but the general direction of easing has not reversed. It is worth noting that the internal hawkish and dovish differences within the Federal Reserve have intensified (Milan advocates a 50 basis point cut, Schmid opposes a cut), and the meeting minutes of November may reveal more clues on easing, providing expected support for gold prices.
The termination of balance sheet reduction is a definite positive factor: The Federal Reserve clearly stated that it would end the reduction of the balance sheet on December 1 and fully reinvest the maturing bonds, releasing approximately 60 billion US dollars of liquidity to the market each month, equivalent to "implicit QE", directly reducing the holding cost of gold, and this policy dividend has not been fully priced.
There is room for economic data disturbances: The US government shutdown has led to the postponement of the release of several key data. Market judgments on the economic fundamentals are divided. If the ISM manufacturing PMI, non-farm payrolls, etc. data in the next week are not up to expectations (current expectations are PMI 49.2, non-farm payroll increase 170,000), it will further strengthen the expectation of easing.
Next week's trading strategy and analysis
buy:4000-4010
tp:4025-4035-4100
sl:3995

ElDoradoFx PREMIUM – GOLD ANALYSIS (31/10/2025, LONDON SESSION)1️⃣ Market Overview
Gold enters the London session consolidating near 4,008–4,010, after defending support at 3,985 and rejecting from 4,046. The market remains in a short-term bullish channel, but momentum is slowing as buyers struggle to reclaim the intraday high.
Currently, price sits above key EMAs (50 & 200) but faces overhead resistance between 4,034–4,046, which coincides with yesterday’s rejection zone. Today’s London open is expected to bring higher volatility and potential direction for the next leg — either continuation toward 4,060+ or a pullback toward 3,985.
⸻
2️⃣ Technical Breakdown
🔸 Daily (D1):
Price is holding steady above the 100EMA, printing a second consecutive candle above 4,000. RSI ~51 confirms a balanced market, while MACD histogram shows flattening red bars — signaling possible transition toward bullish momentum.
🔸 H1:
The structure shows higher lows from 3,915 and a rejection at 4,046, forming a small range. Price remains supported at the 50EMA (around 4,000) and ascending trendline. RSI 54; momentum moderate but favoring bulls as long as 3,985 holds.
🔸 15M–5M:
Gold trades in a tight wedge pattern with clear BOS and CHoCH confirmations. RSI oscillating between 55–60; MACD crossing positive, suggesting renewed buying pressure. However, the 4,034–4,046 zone remains a short-term barrier until a clean breakout occurs.
⸻
3️⃣ Fibonacci Analysis (Last Swing: 3,985 → 4,046)
• 38.2% = 4,022
• 50.0% = 4,015
• 61.8% = 4,008
🎯 Golden Zone for Re-entry: 4,022 – 4,008
⸻
4️⃣ High-Probability Trade Scenarios
📈 BUY SCENARIO (Main Bias)
✅ Entry Zone: 4,022 – 4,008 (Golden Zone)
🎯 Targets: 4,034 → 4,046 → 4,060 → 4,082
🛑 Stop Loss: Below 3,995
⚡ Confirmation: Bullish engulfing or CHoCH confirmation from 5M/15M near the Golden Zone.
💥 Breakout BUY Setup
• Trigger: Clean breakout & close above 4,046
• Retest Entry: 4,040–4,043
🎯 Targets: 4,060 → 4,082 → 4,100
🛑 Stop Loss: Below 4,030
⸻
📉 SELL SCENARIO (Countertrend)
⚠️ Entry Zone: 4,046 – 4,060 (Resistance & previous swing high)
🎯 Targets: 4,022 → 4,008 → 3,985 → 3,965
🛑 Stop Loss: Above 4,070
⚡ Confirmation: 15M bearish rejection candle or RSI divergence above 65.
📉 Break & Retest SELL
• Trigger: Break below 3,985 → Retest rejection at 3,995
🎯 Targets: 3,965 → 3,945 → 3,920
🛑 Stop Loss: Above 4,005
⸻
5️⃣ Fundamental Watch
• London expected to bring stronger liquidity after quiet Asia session.
• DXY near 106.20 — any recovery could limit gold’s upside.
• US Core PCE data later today may influence dollar strength ahead of NY session.
• Market remains risk-sensitive due to month-end positioning.
⸻
6️⃣ Key Technical Levels
Resistance: 4,034 / 4,046 / 4,060 / 4,082
Support: 4,022 / 4,008 / 3,995 / 3,985 / 3,965
Golden Zone: 4,022 – 4,008
Break Buy Trigger: > 4,046
Break Sell Trigger: < 3,985
⸻
7️⃣ Analyst Summary
Gold remains bullish-to-neutral above 3,995, forming a tight intraday range before a breakout.
If 4,046 breaks with volume, expect continuation to 4,060–4,082.
However, failure to clear 4,046 may invite short-term retracement toward 4,022–4,008 (Golden Zone) for re-entry.
The trend remains bullish while above 3,985, with downside risk only below that level.
⸻
8️⃣ Final Bias Summary
Bias: 🔼 Bullish (while above 3,985)**
Short-term Objective: Buy pullbacks toward 4,022–4,008
Invalidation: Below 3,985 → turns short-term bearish.
⸻

ElDoradoFx PREMIUM – GOLD ANALYSIS (31/10/2025, ASIA SESSION)1️⃣ Market Overview
Gold closed the US session above $4,020, marking a strong recovery from the weekly low of $3,915. Price has reclaimed the short-term bullish structure, trading near $4,024–$4,027, just under a critical resistance zone. Bulls maintain control as long as $3,990 holds, but the market is approaching a key decision point where a breakout could define the next major move.
⸻
2️⃣ Technical Breakdown
🔸 Daily (D1):
Price has bounced sharply from the 100EMA and printed the first higher daily close after multiple bearish sessions. RSI at 52.5 supports the early phase of bullish recovery. MACD histogram turning lighter red signals momentum shift. The next key resistance sits at $4,100, while support remains solid around $3,850–$3,900.
🔸 H1:
Bullish structure with clear higher lows from $3,915 and BOS confirmations up to $4,020. Price currently retesting the intraday trendline with confluence from 50EMA and Fib levels. RSI 62+, momentum still strong but slightly extended.
🔸 15M–5M:
Micro structure shows tight compression under $4,027 (key rejection area). Multiple CHoCH and BOS confirm upward control, but short-term RSI divergence hints at possible minor pullback before further continuation.
⸻
3️⃣ Fibonacci Analysis (Last Swing: 3,985 → 4,027)
• 38.2% = 4,011
• 50.0% = 4,006
• 61.8% = 4,000
🎯 Golden Zone for Re-entry: 4,011 – 4,000
⸻
4️⃣ High-Probability Trade Scenarios
📈 BUY SCENARIO (Main Bias)
✅ Entry Zone: 4,011 – 4,000 (Golden Zone)
🎯 Targets: 4,027 → 4,040 → 4,055 → 4,070
🛑 Stop Loss: Below 3,990
⚡ Confirmation: Bullish engulfing or CHoCH on 5M after Fib retracement.
💥 Breakout BUY Setup
• Trigger: Clean break & close above 4,027 → Retest 4,024–4,027
• Targets: 4,040 → 4,055 → 4,082
• Stop Loss: Below 4,015
⸻
📉 SELL SCENARIO (Countertrend)
⚠️ Entry Zone: 4,027 – 4,035 (H1 supply & ascending resistance)
🎯 Targets: 4,011 → 4,000 → 3,985 → 3,965
🛑 Stop Loss: Above 4,040
⚡ Confirmation: 5M bearish engulfing or RSI >70 with MACD crossover.
📉 Break & Retest SELL
• Trigger: Close below 3,985 → Retest rejection
• Targets: 3,965 → 3,945 → 3,920
• Stop Loss: Above 3,995
⸻
5️⃣ Fundamental Watch
• Asian session expected to open quietly, but momentum from US close favors continuation.
• DXY pulling back under 106 supports gold near-term.
• Market eyes upcoming US Core PCE and inflation data tomorrow — possible volatility buildup.
• Watch for end-of-month position adjustments and liquidity traps during Asia open.
⸻
6️⃣ Key Technical Levels
Resistance: 4,027 / 4,035 / 4,055 / 4,070
Support: 4,011 / 4,000 / 3,985 / 3,965 / 3,945
Golden Zone: 4,011 – 4,000
Break Buy Trigger: > 4,027
Break Sell Trigger: < 3,985
⸻
7️⃣ Analyst Summary
Gold remains in a bullish continuation structure, with 4,000–3,985 acting as critical support.
• If 4,027 breaks and holds → bullish extension toward 4,055–4,070.
• If 4,027 rejects → expect healthy retracement back to 4,011–4,000 before continuation.
Short-term trend remains bullish above 3,990, but traders should watch for potential exhaustion around 4,035–4,050.
⸻
8️⃣ Final Bias Summary
Bias: 🔼 Bullish (while above 3,990)**
Short-term Objective: Reclaim & hold 4,027 for continuation to 4,055+
Invalidation: Break below 3,985 → bearish correction resumption.
⸻
🥇 ElDoradoFx PREMIUM 3.0 – PERFORMANCE 30/10/2025 🥇
📊 Steady momentum & sharp entries throughout the session.
━━━━━━━━━━━━━━━
🔻 SELL +40 PIPS
🟢 BUY +210 PIPS
🔻 SELL +20 PIPS
🟢 BUY +40 PIPS
🟢 BUY +110 PIPS
🔻 SELL +110 PIPS
🔻 SELL +20 PIPS
🟢 BUY +20 PIPS
⚪️ BUY – BE
🔻 SELL +40 PIPS
━━━━━━━━━━━━━━━
💰 GOLD TOTAL PROFIT: +610 PIPS
📊 10 Trades → 9 Wins | 1 BE
🎯 Accuracy: 90%
━━━━━━━━━━━━━━━
🔥 High precision and clean follow-through from GOLD — trend confirmation and disciplined entries led to another strong day!
👏 Congratulations if you profited! ✅✅✅🚀🚀🚀

ElDoradoFx PREMIUM – GOLD ANALYSIS (30/10/2025, LONDON SESSION)1️⃣ Market Overview
Gold continues to trade in a corrective recovery phase after the sharp sell-off from 4,025. Current price sits near 3,970–3,975, just below a descending H1 trendline and confluence of the 200 EMA (yellow) and 100 EMA (white).
Momentum is improving but overall structure remains bearish-to-neutral, pending a confirmed breakout above 3,990.
The 3,915–3,925 demand zone has held for 3 consecutive sessions, suggesting a possible base formation before a larger move.
⸻
2️⃣ Technical Breakdown
Daily (D1)
• Structure: Retracement phase within bullish macro trend.
• RSI recovering to 49, showing loss of bearish momentum.
• MACD histogram contracting — bearish momentum fading.
• Support: 3,850–3,900
• Resistance: 4,005–4,055
H1
• Market formed higher lows from 3,916; however, still capped under descending trendline.
• EMA confluence (200, 100, 50) between 3,975–3,990 acts as near-term resistance.
• RSI around 55, indicating moderate bullish correction.
• Key structure: BOS at 3,960 → now forming liquidity near 3,978–3,990.
15M–5M
• Compression pattern forming (triangle structure) under 3,975–3,982.
• Multiple sweeps below 3,940 confirming liquidity grabs.
• Short-term structure remains bullish while above 3,945; intraday momentum aligns with EMA direction.
⸻
3️⃣ Fibonacci Analysis (Last Swing: 3,916 → 3,978)
• 38.2% = 3,954
• 50.0% = 3,947
• 61.8% = 3,940
🎯 Golden Zone for Re-entry: 3,954 – 3,940
Additional confluence: H1 structure support + liquidity pool at 3,940 = optimal buy zone.
⸻
4️⃣ High-Probability Trade Scenarios
🟩 Scenario A – Buy Retracement (Primary Bias)
• Buy Zone: 3,954 – 3,940 (Golden Zone)
• Confirmation: 5M/15M bullish engulfing or CHoCH after retest
• SL: Below 3,933
• TPs: 3,975 → 3,990 → 4,005 → 4,025
• Rationale: Structure support, Fib alignment, EMA confluence, and fading bearish momentum.
⸻
🟨 Scenario B – Break & Retest Buy
• Trigger: Break and close above 3,990 on 15M/H1
• Retest Zone: 3,985–3,990
• SL: 3,972
• TPs: 4,005 → 4,025 → 4,055 → 4,062
• Rationale: Clean breakout from compression structure confirming bullish continuation.
⸻
🟥 Scenario C – Countertrend Sell (At Supply Zone)
• Sell Zone: 3,975–3,990 (EMA + descending TL confluence)
• Confirmation: Bearish engulfing or RSI rejection near 60–65
• SL: Above 4,003
• TPs: 3,958 → 3,947 → 3,940 → 3,930
• Rationale: Short-term exhaustion + supply reaction at major resistance cluster.
⸻
⚫ Scenario D – Momentum Sell (If Demand Fails)
• Trigger: 15M candle close below 3,939, retest rejection at 3,939–3,945
• SL: Above 3,952
• TPs: 3,925 → 3,916 → 3,898 → 3,886
• Rationale: Demand breakdown and bearish continuation confirmation.
⸻
5️⃣ Fundamental Watch
• Low volatility expected early London; attention shifts to US GDP & jobless claims later.
• DXY stable near 106, limiting gold’s upside unless USD weakens.
• Bond yields steady; risk sentiment slightly cautious.
• Key catalyst: Any breakout in DXY >106.5 or <105.8 could shift XAUUSD direction sharply.
⸻
6️⃣ Key Technical Levels
Type Levels
Resistance 3,975 / 3,990 / 4,005 / 4,025 / 4,055–4,062
Support 3,954 / 3,947 / 3,940 / 3,930 / 3,916 / 3,886
Golden Zone 3,954 – 3,940
Break Buy Trigger > 3,990
Break Sell Trigger < 3,939
⸻
7️⃣ Analyst Summary
• Market attempting recovery from 3,915 base; compression under 3,990 suggests a build-up before breakout.
• Momentum improving but confirmation needed via 3,990 breakout or Fib GZ retest.
• Bias remains short-term bullish while 3,940 holds; otherwise neutral-to-bearish below 3,939.
⸻
8️⃣ Final Bias Summary
• 🔹 Primary Bias: Bullish above 3,940; targets 4,005–4,025.
• 🔸 Secondary Bias: Bearish below 3,939; targets 3,916–3,886.
• ⚠️ Key Decision Zone: 3,975–3,990 (EMA and trendline confluence). Wait for breakout or rejection confirmation.
⸻

Gold Has Entered the Fifth Wave — A Drop Below 3800 Is PossibleGold continued its Wave-4 rebound today, but following a news catalyst, Wave-5 downward momentum began, and the market structure has become clearer. In such conditions, what traders need most is patience.
From the daily chart perspective, there still appears to be room for further downside. Based on my expectation, this decline may break below 3800. Of course, the market is always changing, and our outlook is based on probabilities — no one can guarantee the market will move exactly as expected. However, recent price action has been largely in line with our forecast, and I believe many of you have already secured profits from this move — that’s what matters.
Additionally, I will be traveling tomorrow and won’t be able to monitor the market in real time. So during your trades, please stay alert and prioritize risk control. Protect your capital first — profits will come naturally afterward. The market never lacks opportunities, so don’t sacrifice long-term stability for short-term gains.
Stay calm, stay disciplined, and trade safely!

Gold Breaks Key Support Zone — Bearish Momentum Builds Below $4,Analysis:
The XAU/USD (Gold vs. USD) 45-minute chart shows a clear breakdown below the established support zone, indicating a shift in market sentiment from consolidation to bearish momentum.
The support zone around $4,050 – $4,000 had previously held multiple times, acting as a strong demand area.
The recent breakout below this zone confirms a potential trend continuation to the downside.
Price action suggests a bearish pattern with lower highs and lower lows forming before the breakout.
A retest of the broken support (now resistance) may occur before the next leg lower.
The next major target lies near $3,900 – $3,850, aligning with the projected measured move.
Technical Outlook:
If gold fails to reclaim the $4,050 level, further downside pressure remains likely. However, a close back above this level could invalidate the bearish breakout and signal a possible false break.

GOLD (XAU/USD): FED ALERT! IS THE BOTTOM IN?Hello TradingView Community! Gold is standing at a critical juncture. The convergence of the US Federal Reserve (FED) decision, US-China trade talks, and geopolitical risks is setting the stage for significant market movement.
1. 🌍 Fundamental Analysis (Macro): Geopolitics vs. Rate Cuts
Bearish Headwinds: Positive developments in US-China trade discussions eased comprehensive trade war fears, causing safe-haven demand to drop and pushing Gold below the $3,900 mark.
Strong Support Factors:
The market is heavily anticipating the FED will cut borrowing costs by 25 basis points at the conclusion of its two-day meeting (scheduled for tonight/early tomorrow). Lower rates typically support Gold (a non-yielding asset).
Escalating US-Russia geopolitical tensions (new sanctions, canceled meetings) and the ongoing US government shutdown highlight internal instability, providing a continuous underlying bid for the safe-haven metal.
2. 📈 Technical Analysis: Wave C Bottom and Rebound Targets
Based on the Elliott Wave structure on your chart, the technical picture is sharp:
Wave C Completion: The recent drop to $3,892.152 appears to have completed the 5-wave structure of the larger corrective Wave C. This suggests a strong possibility that a major bearish cycle has ended.
LONG Target: If the rebound scenario holds, Gold is targeting the crucial Fibonacci resistance zone: $4,135 - $4,180.
Key Levels to Watch:
Confirmation Resistance: A decisive break above $4,042 will strongly confirm the upward momentum.
Stop-Loss (SL): Risk management demands a strict stop-loss placed just below the Wave C low at $3,892.152.
Conclusion: The combination of geopolitical support, FED rate cut expectations, and the technical signal of a potential Wave C bottom offers an attractive Risk/Reward setup for LONG (Buy) positions. All eyes are now on the FED announcement tonight/tomorrow morning!
#XAUUSD #GOLD #FED #ElliottWave #TradingView #MarketUpdate What are your thoughts? Are you going Long or Short into the FED event? 👇
Would you like me to draft a quick contingency plan for Gold in case the FED's statement is unexpectedly hawkish (less dovish than expected)?

Today's gold trading strategyLoose expectations are overpriced.
The current market has already regarded a 25 basis point rate cut in October as "a done deal", and even anticipates a further rate cut in December (with a 91% probability). Under such extreme expectations, the previous gains in gold have overestimated the policy benefits. Once the Federal Reserve releases a cautious signal, it will trigger a "buy expectation, sell reality" correction.
Internal divisions conceal hawkish risks.
There are profound differences within the Federal Reserve regarding the subsequent policy path - Milan and others who are dovish support further easing to address employment risks, while Schmidt and others who are cautious emphasize that "the current policy is slightly tight and appropriate", and need to be vigilant about inflation fluctuations. Against the backdrop of government shutdown leading to data "vacuum", Powell is likely to retain policy flexibility and will not explicitly commit to a rate cut in December. This "vague hawkish" statement will directly suppress the gold price.
Today's gold trading strategy
sell:3980-3990
tp:3970-3960
sl:4000

GOLD (XAU/USD): FED ALERT! IS THE BOTTOM IN?Hello TradingView Community! Gold is standing at a critical juncture. The convergence of the US Federal Reserve (FED) decision, US-China trade talks, and geopolitical risks is setting the stage for significant market movement.
1. 🌍 Fundamental Analysis (Macro): Geopolitics vs. Rate Cuts
Bearish Headwinds: Positive developments in US-China trade discussions eased comprehensive trade war fears, causing safe-haven demand to drop and pushing Gold below the $3,900 mark.
Strong Support Factors:
The market is heavily anticipating the FED will cut borrowing costs by 25 basis points at the conclusion of its two-day meeting (scheduled for tonight/early tomorrow). Lower rates typically support Gold (a non-yielding asset).
Escalating US-Russia geopolitical tensions (new sanctions, canceled meetings) and the ongoing US government shutdown highlight internal instability, providing a continuous underlying bid for the safe-haven metal.
2. 📈 Technical Analysis: Wave C Bottom and Rebound Targets
Based on the Elliott Wave structure on your chart, the technical picture is sharp:
Wave C Completion: The recent drop to $3,892.152 appears to have completed the 5-wave structure of the larger corrective Wave C. This suggests a strong possibility that a major bearish cycle has ended.
LONG Target: If the rebound scenario holds, Gold is targeting the crucial Fibonacci resistance zone: $4,135 - $4,180.
Key Levels to Watch:
Confirmation Resistance: A decisive break above $4,042 will strongly confirm the upward momentum.
Stop-Loss (SL): Risk management demands a strict stop-loss placed just below the Wave C low at $3,892.152.
Conclusion: The combination of geopolitical support, FED rate cut expectations, and the technical signal of a potential Wave C bottom offers an attractive Risk/Reward setup for LONG (Buy) positions. All eyes are now on the FED announcement tonight/tomorrow morning!
#XAUUSD #GOLD #FED #ElliottWave #TradingViewIndia #MarketUpdate What are your thoughts? Are you going Long or Short into the FED event? 👇

Gold Faces Wave 5 Danger: Prepare for a Sharp Drop AheadAt yesterday’s opening, gold dropped sharply, breaking the bullish structure. Today, the decline continued, and the gap near 3887 was successfully filled before the price rebounded toward the 3975 resistance area. The strong resistance remains around 4000–4018.
On the daily chart, the trend remains downward, with support at 3963 already broken. Although the price is now recovering, upside resistance remains dense. From a structural perspective, the movement now aligns with a five-wave decline pattern, and the market appears to be in wave 4’s rebound phase. Therefore, it’s crucial to monitor the resistance area closely — if the price fails to break and hold above it, be prepared for the onset of wave 5, which could drive prices down to around 3800.
On the weekly chart, there is potential support near 3834, but keep in mind that wave 5 declines are often stronger and faster than wave 3, meaning this support could be broken.
In summary, trade cautiously and make account safety your top priority.

28/10/68 : XAUUSD ( US Session )Using it from US Session until 11.00AM , I'll new analysis and update at 12.00PM
Resistance
3947-3953
3936-3942
3930
Support
3918
3907-3912
3896-3901

Gold: Building a bottom, but caution remainsWeekend Greetings!
Over the past week, gold has been consolidating within the 4160–4000 range. Technically, this range suggests a short-term bottoming phase. However, given that prices recently reached new highs and have since formed a double-top pattern, it’s still too early to confirm a bottom. In the upcoming sessions, traders should remain cautious, avoid chasing highs, and be alert for potential bull traps or a fifth-wave decline, as mentioned last week.
On the 4H chart, higher lows are being established, and Friday’s close was above both the MA5 and MA20, with the MACD maintaining a bullish configuration. The MA60 and MA30 are currently positioned around 4180 and 4163, respectively, serving as key resistance zones. If gold can hold above these levels, there’s a good chance it will approach or even reclaim the 4300 level.
On the daily chart, gold remains supported by the MA20, with long lower wicks indicating active bullish participation, which favors further upside. However, the MA5 and MA10, located around 4154 and 4188, still act as short-term resistance. For a stronger bullish confirmation, the price needs to stabilize above 4160, ideally holding firm above 4180.
On the 30M/1H charts, moving averages are closely aligned, showing short-term consolidation. Notably, the last three candles on the 30M chart form a Morning Star pattern, a typical bullish signal. If this formation remains intact after the market opens, prices are likely to move higher.
From a fundamental perspective, no bearish news emerged over the weekend. Unless unexpected developments occur before the market opens, the technical outlook favors an upward move during Monday’s session.
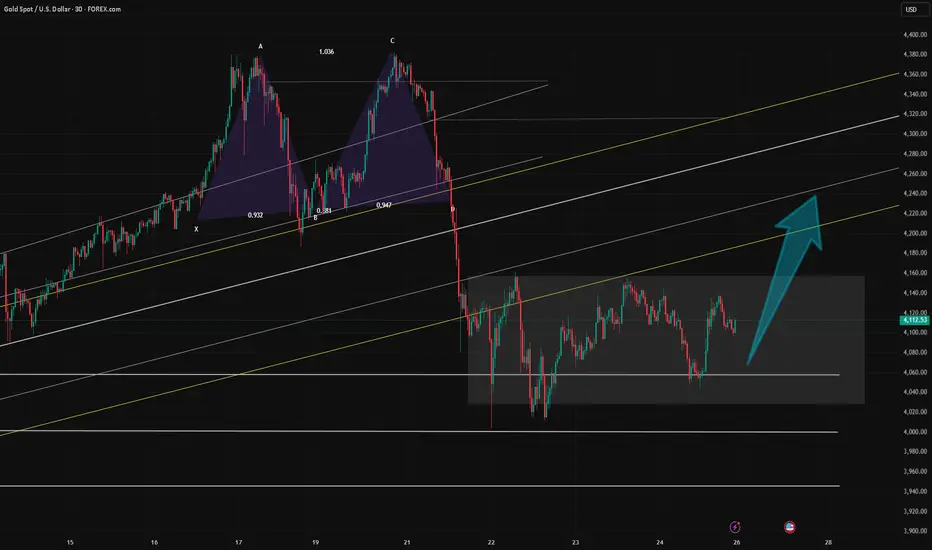
XAUUSD: Structure Broken! Can the Fed Rate Cut Save Gold?Gold has just completed its first losing week in 10, after a historic rally. Following the record peak of $4,381.21, Gold experienced a sharp correction driven by profit-taking and easing US-China trade tensions. However, weaker-than-expected US CPI data has strongly reinforced expectations for an upcoming Fed rate cut, creating a significant market conflict.
I. MARKET CONTEXT ANALYSIS (H4)
Structure: The prior bullish structure has been broken, shifting the bias to bearish in the short term.
Liquidity: Market forces are now targeting key stop-loss zones to collect liquidity before the next major move.
Strategy: We look to Sell when price pulls back to the Supply Zone (Premium) and Buy when price sweeps liquidity into the strong Demand Zone.
II. DETAILED TRADING PLAN
1. SELL Scenario 📉 (At Supply Zones)
Trade 1:
Entry: $4,202 - $4,204
SL: $4,212
TP: $4,194 / $4,184 / $4,174 / $4,164
Trade 2:
Entry: $4,252 - $4,256
SL: $4,272
TP: $4,236 / $4,216 / $4,196 / $4,176
2. BUY Scenario 📈 (At Demand Zones)
Trade 1:
Entry: $4,158 - $4,161
SL: $4,151
TP: $4,168 / $4,178 / $4,188 / $4,198
Trade 2 (Critical):
Entry: $3,966 - $3,969 (Strong Demand Zone, post-liquidity sweep)
SL: $3,949
TP: $3,989 / $4,009 / $4,029 / $4,049
III. RISK MANAGEMENT NOTE
Capital: Always limit risk to ≤ 1% of capital per trade.
Confirmation: Prioritize waiting for reversal confirmation on lower timeframes (M15/M5) to optimize Risk/Reward ratio.
This is the decisive moment! Trade safe and good luck!
#XAUUSD #Gold #GoldAnalysis #Forex #Trading #Fed #Inflation

ElDoradoFx PREMIUM – GOLD ANALYSIS (24/10/2025, ASIA)Gold (XAUUSD) closed NY around 4,120–4,126 after rebounding from the 4,070–4,090 intraday liquidity shelf, showing a clear recovery structure from the prior US session dip. Into Asia, price is now trading near 4,123–4,126, just under the descending H1 resistance / MA confluence. Momentum has turned positive intraday, but price remains in a potential lower high region unless bulls can reclaim 4,143–4,154. Asia will determine whether this is a corrective pullback inside a broader down-leg or the start of a higher-low recovery leg.
⸻
🔍 1. Market Overview
• Price rebounded strongly during late US, suggesting buyers defended sub-4,090 levels.
• Current positioning is mid-structure, below major H1/H4 EMAs, suggesting recovery but not confirmed bullish reversal.
• Asia likely to range or extend recovery toward key resistance zones before directional decision into London.
⸻
🧭 2. Technical Breakdown
📅 Daily Chart (D1)
• Strong bearish correction from 4,38x, followed by stabilization above 4,100.
• Price currently rejecting lower and forming potential daily wick.
• RSI ~59, showing room higher if momentum sustains.
• MACD still above zero but tightening → awaiting confirmation candle.
✅ Bias: Neutral-to-mild recovery within macro bullish context.
⸻
⏳ 1H Chart (H1)
• Price rebounded from strong demand at ~4,070, set higher low, rallied toward 4,126 (current) but still below 4,150+ EMA confluence (yellow/white bands).
• Descending resistance line still active.
• RSI ~52, turning up.
• MACD turning positive but recovery unconfirmed until above 4,143+.
✅ Bias: Recovery phase but facing resistance – bulls need break above 4,143–4,154 to confirm higher low structure.
⸻
📉 30M Chart (M30)
• Clear BOS to upside after breakout from consolidation.
• Mid-term EMA support now rising from ~4,107–4,110.
• However, recent rejection candle printed near resistance area.
✅ Bias: Pullback possible unless 4,110 holds.
⸻
⏱️ 15M Chart (M15)
• Price has tapped resistance zone ~4,126–4,130 multiple times.
• Micro structure remains bullish from 4,070, but consolidation forming.
• MACD shows deceleration; RSI flattening near 60.
✅ Bias: Short-term accumulation/consolidation, waiting for breakout or rejection.
⸻
📍 5M Chart (M5)
• Micro rejection from white MA cluster around 4,126.
• Short-term support near 4,114–4,110.
• If 4,110 fails, fast liquidity drop to 4,098–4,090 likely.
✅ Bias: Micro bullish but losing momentum at resistance.
⸻
✨ 3. Fibonacci Golden Zone (H1 Impulse)
Last confirmed impulse: Low 4,070 → High 4,126
• 38.2% = 4,105
• 50% = 4,098
• 61.8% = 4,091
✅ Golden Zone = 4,105 – 4,091 (Ideal long area if pullback occurs and bullish confirmation appears).
⸻
🎯 4. High-Probability Scenarios
✅ Bullish Continuation Setup (Preferred if pullback occurs)
🔹 Buy Zone: 4,105–4,098 (core entry) or deeper 4,091
🎯 Targets: 4,126 → 4,143 → 4,154 → 4,168
🛑 SL: Below 4,083 or safer below 4,070.
✅ Bullish Breakout Setup (Momentum)
🔹 Buy on breakout + retest above: 4,126–4,130
🎯 Targets: 4,143 → 4,154 → 4,168
🛑 SL: Back inside 4,115.
⸻
⚠️ Bearish Reaction Setup (Sell at resistance)
🔹 Sell Zone: 4,143–4,154 (EMA confluence + descending trendline)
🎯 Targets: 4,126 → 4,110 → 4,098 → 4,091
🛑 SL: Above 4,160–4,165.
⛔ Bearish Breakdown Setup (Trend continuation lower)
🔹 Sell below retest of: 4,091
🎯 Targets: 4,070 → 4,058 → 4,046 → 4,024
🛑 SL: Above 4,105.
⸻
📅 5. Fundamental Watch – Asia Session
• No high-impact Asian data – flow & positioning-driven.
• DXY mildly neutral – may allow gold extension.
• Markets may stay cautious ahead of London session and FOMC sentiment later.
• A quiet Asia session often respects fib zones & micro structure.
⸻
📍 6. Key Technical Levels
Type Levels
🔼 Resistance 4,126 / 4,130 / 4,143 / 4,154–4,168
🔽 Support 4,114–4,110 / 4,105 / 4,098 / 4,091 (Golden Zone)
⚠ Reversal Zone 4,143–4,154
📉 Breakdown Level 4,091
🎯 Golden Zone 4,105 – 4,091
⸻
📌 7. Analyst Summary
Gold is currently in an intraday recovery phase, but still trading below significant H1 resistance & EMAs. The structure favors bullish continuation only if pullbacks into 4,105–4,098 hold or if price breaks and sustains above 4,130–4,143. A failure to break resistance and a drop below 4,091 would expose deeper retracement into 4,070 / 4,058.
⸻
✅ 8. Final Bias Summary
Condition Strategy
✅ Above 4,130 (confirmed) Bullish → aim for 4,143 / 4,154
✅ Bounce from 4,105–4,098 Buy pullback → target 4,126+
⚠ Rejection 4,143–4,154 Sell reaction → target 4,110 / 4,098
⛔ Below 4,091 (retest) Bearish → target 4,070 / 4,058
📍Golden Zone (Buy Opportunity): 4,105 – 4,091
📍Breakout Confirmation: Above 4,130
📍Breakdown Confirmation: Below 4,091
⸻
🥇 ElDoradoFx PREMIUM 2.0 – PERFORMANCE 23/10/2025 🥇
📊 GOLD TRADE RESULTS:
❌ BUY –40 pips (SL)
🔻 SELL +210 pips
⚖️ BUY LIMIT – BE
🔻 SELL +210 pips
🟢 BUY +210 pips
❌ BUY –60 pips (SL)
🟢 BUY +30 pips
🟢 BUY +100 pips
🟢 BUY +520 pips
🟢 BUY +210 pips
---
💰 TOTAL GOLD PIPS WON: ✅ +1,390 pips
📈 RESULT: 10 Signals → 7 Wins | 2 SL | 1 BE
🎯 WIN RATE (on executed trades): 78%
---
🔥 Strong momentum continuation with powerful upside breakouts delivering big gains 📈💎
👏 Congratulations if you profited! ✅✅✅🚀🚀🚀

Gold May Form a Bull Trap Before Another DropUnder the current strong bearish sentiment, gold has filled the gap around 4019 and touched the MA20 support on the 1D chart, followed by a strong rebound of over $150. After reaching the MA10 near 4160, the price pulled back again and is now trading below 4100.
On the 4H chart, the downtrend remains intact, with psychological support around the MA30 (near 3910). If bearish momentum continues during the U.S. session, a move toward this support level cannot be ruled out.
Personally, I expect gold to first test resistance around 4180–4200 or even 4250, forming a potential bull trap before another leg down. However, if supported by positive news and strong volume, the market could reverse and push prices back above 4300.
Moreover, if the price truly dips into the 3950–3910 range, I see it as a great opportunity for long positions — one I definitely won’t miss!
Of course, this is just my personal view. Ultimately, we should always follow the actual price action and trade cautiously, managing risk wisely.
