The Gold–Silver Ratio: The Market Signal Most Traders IgnoreMany traders treat Gold (XAUUSD) and Silver (XAGUSD) as the same trade with different volatility.
That’s a mistake.
Gold and Silver respond to different macro forces, and understanding when capital rotates from one to the other gives a serious edge — both for trading and physical investing.
1️⃣ Gold vs Silver — Core Difference
Gold = Monetary metal
Store of value
Inflation hedge
Central bank asset
Safe haven during stress
Silver = Hybrid metal
Part monetary
Part industrial
High beta version of gold
More sensitive to growth cycles
This single difference explains why silver moves faster and further than gold — in both directions.
2️⃣ When to Trade GOLD (XAUUSD)
Gold performs best when fear and monetary uncertainty dominate.
Bullish Gold Environment:
Falling or expected rate cuts (Fed pivot)
Rising inflation or sticky CPI
USD weakness
Geopolitical risk (wars, sanctions, OPEC supply risks)
Equity market stress or drawdowns
Trader mindset:
Gold moves first, cleaner, more technically respected.
Best use:
Swing trades
Trend continuation
Capital protection during risk-off phases
Physical gold bars:
Best accumulated when:
Real rates peak
Fed is restrictive but close to easing
Media interest is low (no gold hype)
3️⃣ When to Trade SILVER (XAGUSD)
Silver thrives when liquidity + growth expectations return.
Bullish Silver Environment:
Fed easing or liquidity injections
Improving PMI / industrial demand
Tech expansion (AI, EVs, solar panels)
Rising copper and industrial metals
Risk-on equity sentiment (SP500 strength)
Silver benefits from:
Industrial usage (electronics, AI chips, solar)
Smaller market → easier to push
Speculative flows
Trader mindset:
Silver is late but explosive.
Best use:
Momentum trades
Breakout strategies
Relative strength vs Gold
Physical silver bars:
Best accumulated when:
Gold/Silver Ratio is extremely high
Economy is weak but stabilizing
Nobody wants silver (yet)
4️⃣ Why Silver Often Outperforms Gold
Even though gold is more precious:
Silver supply is tighter relative to demand
Industrial demand is growing structurally (AI, green energy)
Silver market is much smaller → higher volatility
Speculators prefer silver during risk-on cycles
📌 Key metric:
Gold/Silver Ratio
High ratio → Silver undervalued
Falling ratio → Silver outperforming Gold
5️⃣ Gold vs Silver Rotation Framework
Simple rule:
Risk-off → Buy Gold
Early recovery → Gold first
Liquidity expansion → Silver explodes
Late-cycle euphoria → Reduce Silver first
Gold leads.
Silver accelerates.
6️⃣ Macro Context That Matters
Fed: Rates & liquidity decide direction
USD: Inverse correlation for both metals
SP500: Risk appetite indicator
Oil (OPEC): Inflation transmission → Gold support
Earnings cycles: Growth optimism favors Silver
Final Takeaway (Trader Language)
Trade Gold for safety, structure, and macro clarity.
Trade Silver for speed, volatility, and expansion phases.
Buy physical gold when fear is high.
Buy physical silver when nobody cares — before liquidity returns.
Gold protects wealth.
Silver multiplies it — at the right time.
Relevant Hashtags
#Gold #Silver #XAUUSD #XAGUSD #MacroTrading #TradingStrategy #Fed #SP500 #Commodities #Inflation
GOLD/SILVER

Gold Technical Outlook
Price has stabilized around the 4060 resistance zone (confirmation with a 1H or 4H candle close). If the level holds, the bias remains bullish, with potential upward movement toward the 4100 resistance. A break above 4100 would open the way for continued bullish momentum, targeting the next levels at 4133 and 4168.
However, if the price fails to sustain above 4060 and confirms a reversal candle, it may trigger a downside correction toward the 4030 support zone. A confirmed break below 4030 (1H candle close) would likely extend the bearish move toward the 3965 level.
Bias Trend: Bullish
Volatility: High

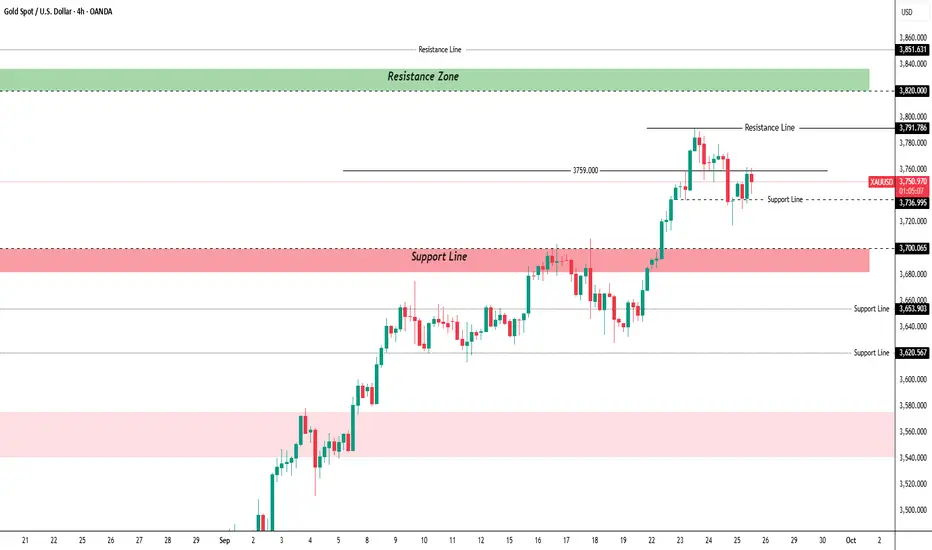
Gold (XAUUSD) – Technical Outlook
🔴Bearish Scenario (Downtrend)
*Pivot Level: 3759
* If price trades below 3759, downside momentum may develop.
* 🎯 First target: 3736 (key support)
* If 3736 breaks strongly → continuation lower.
* 🎯 Second target: 3700
🟢Bullish Scenario (Uptrend)
* If price holds above 3759, upside momentum is likely.
* 🎯 First target: 3791 (previous major high)
* If 3791 breaks with strength → full bullish continuation.
* 🎯 Next upside targets: 3810 → 3830
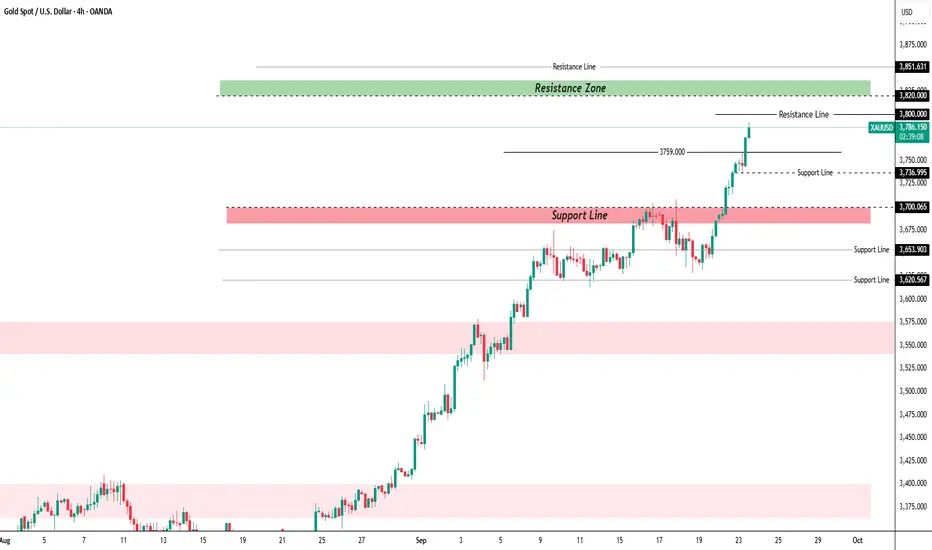
Gold (XAUUSD) – Technical Outlook
🟢 Bullish Scenario:
* Pivot Level: 3759
* If price holds above 3759
🎯 First target: 3800 (resistance)
🎯 If 3800 breaks strongly → continuation towards: 3820
---
🔴 Bearish Scenario:
* If price sustains below 3759
🎯 First target: 3736 (support)
🎯 If 3736 breaks → continuation lower towards: 3700
---
👉 Summary:
* Above 3759 → bullish continuation.
* Below 3759 → bearish continuation.
Gold (XAUUSD) – Technical Outlook
🟢 Bullish Scenario:
Key Level (Pivot): 3630
If price holds above 3630, bullish momentum may extend towards:
🎯 First target: 3656 (resistance)
🎯 If 3656 breaks strongly → continuation towards:
🎯 Second target: 3675
🎯 Third target: 3697
🔴 Bearish Scenario:
If price fails and sustains below 3630, bearish move may develop towards:
🎯 First support: 3595 (a strong support zone)
🎯 If 3595 breaks decisively → continuation towards:
🎯 Second target: 3546
📌 Summary:
3630 = decision zone
3656, 3675, 3697 = upside targets
3595, 3546 = downside targets

Gold (XAUUSD) Technical Outlook
🟢 Bullish Scenario:
Key level: 3612
If the price holds above 3612, the bullish momentum is likely to continue towards:
🎯 First target: 3656
🎯 Second target: 3675
🎯 Third target: 3697 (if 3656 breaks strongly)
🔴 Bearish Scenario:
If the price breaks and sustains below 3612, the downside move may extend towards:
🎯 First support: 3595 (a strong support zone)
🎯 If this level breaks and price sustains below ➝ further decline towards:
🎯 Second target: 3546
📌 Summary:
3612 = key decision level
3656, 3675, 3697 = upside targets
3595, 3546 = downside targets

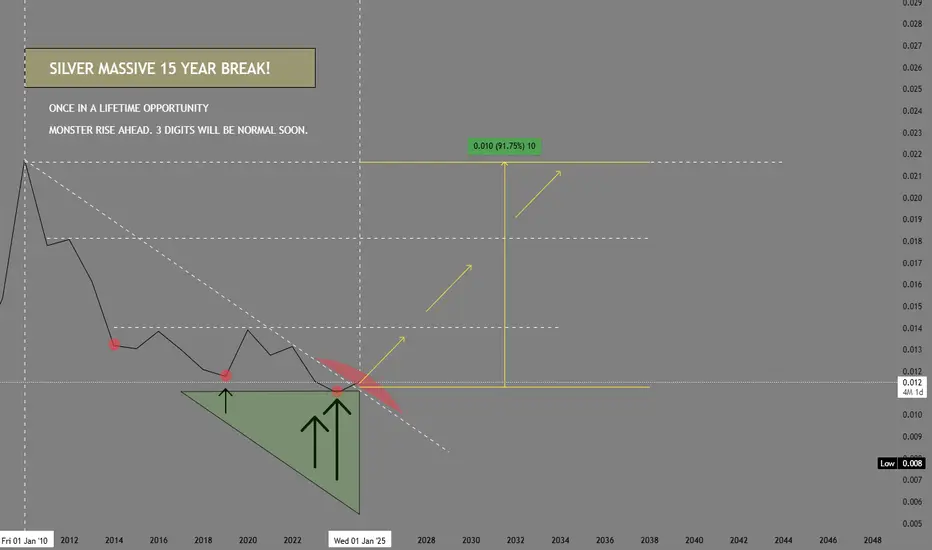
SILVER, MONSTER RISE AHEAD targeting 3 digit pricing!!! SEED NOWFirst things first. Chart is based on reverse metrics of GOLD/SIVER.
SILVER, is usually the supporting actor of the main star GOLD for months. During GOLD's relentless series of rise from 1900 -- silver has been pretty much on the low key state in terms of volume exposure and media mileage but that is about to change soon.
Recent long term data metrics is hinting of a massive reversal to the upside after that elusive 14-year downtrend break. This event does not come often, so THIS IS VERY SPECIAL -- a once in a lifetime opportunity.
Based on our diagram, we are seeing some expanding upside pressure this past few weeks rendering a strong break of this long standing resistance trend that lasted years -- which started from 0.033 on April 2011 to finally tapping an extreme lows at 0.09 on January 2025. This HUGE SHIFT is giving some clues already of whats about to transpire in the next few months -- to break barriers.
Now things are shifting BIG TIME for SILVER as recent price surge this past few weeks has depicted a very significant net long positioning on a grand time scale (long term).
Since the start of 2025, SILVER has already risen almost 40% from its lows. An impressive feat.
This yearly percentile growth is hinting of a bigger picture as we move forward -- to rise further, and explore new high HIGHS in the next few seasons.
This recent massive break -- 14 years in the making should warrant significant positioning already both in retail and institutions.
I'm expecting SILVER to supercede gold in terms of percentile growth metrics % because of the wide price difference ratio.
SILVER will continue to grab good attention from hereon as increasing demand of this metal will just inflate its prices -- moreso, with apparent depleting supplies.
To add to this, US has proposed adding silver to its Critical Minerals List, reflecting its vital industrial, technological, and national security importance, especially for renewable energy, electronics, and medical applications. The draft 2025 list by the USGS and Department of the Interior includes silver for the first time, aiming to boost domestic supply security and reduce reliance on imports by providing incentives for mining and recycling.
With all these factored in, SILVER should be a no-brainer part of your portfolio starting today.
Rewards will be far greater than you will ever imagine.
Current price: 39.0
Target 100.
Long term Target 200-400.
TAYOR. Trade safely.
Silver to $38The move from March 2020 to August 2020
Was a measured move that played out to the Tee.
We have a similar structure building that projects to the High 30's
Suggesting #Gold move beyond ATH's and #Silver the beta play to move faster in an attempt to catch up, and move towards it's high's again.

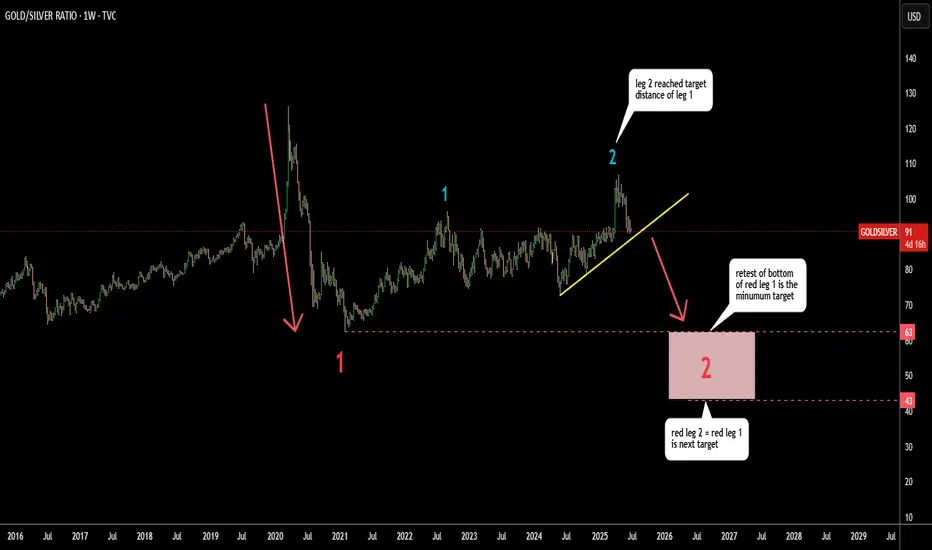
GOLD/SIlver Ratio Signals Risk On Gold/Silver ratio represents the appetite for risk
Stronger gold means risk off and vice versa
In spring, the ratio had hit the target for leg 2 (blue) within
large consolidation that took over 4 years to emerge
It travelled the equal distance of leg 1 (blue) and then reversed.
The next step might be the continuation to the downside for the ratio.
The minimum target is to hit the bottom of red leg 1 at 63.
The next target is located at the distance of the red leg 1 subtracted from the peak of blue leg 2. It was set at 43.
Both downside targets are within historical range.
Gold/Copper ratio shows same dynamics of "Risk-On" attitude on the market.
XAGUSD - Silver on the verge of a big week?!Silver is trading in its ascending channel on the 4-hour timeframe, between the EMA200 and EMA50. If the correction continues, we could see a break of the channel bottom. A consolidation above $30.8 would provide a path for silver to rise to the supply zone, where we can sell at a risk-reward ratio.
According to the annual report by StoneX Financial, silver has been highlighted as one of the top-performing metals among both precious and industrial metals in 2025.Benefiting from its dual nature as a monetary and industrial asset, silver is set to gain from rising gold prices and strong industrial demand. In the report, Rhona O’Connell, Head of Market Analysis at StoneX, and Natalie Scott-Gray, Senior Base Metals Analyst, forecasted that silver, alongside copper and tin, will outperform other metals in 2025.
Despite strong performance in 2024, with a 22% growth, silver is expected to continue its upward trajectory in 2025 as the top-performing metal. This projection is based on robust market fundamentals and promising future prospects that have attracted the attention of investors. Part of this growth stems from the long-term outlook for the solar industry, although new U.S. government policies might slow this trend.
Investment in silver is expected to remain strong, potentially even outpacing gold. While gold is predicted to peak this year, silver is anticipated to keep growing, with a price target of $33 by the end of 2025.
Copper and tin have also garnered attention due to their critical roles in the transition to green energy and digitalization. On the other hand, aluminum has been identified as a metal requiring cautious investment.
The report notes that silver has historically been recognized as a precious metal due to its history as a form of currency and its use in jewelry. According to the authors, “Silver’s relationship with gold has always played a key role in its price behavior, but in reality, this relationship is more complex.” They added, “Throughout much of last year, silver behaved like a precious metal during bullish trends and like a base metal during bearish ones. Statistical analysis confirms this. During U.S. economic recessions, silver’s price performance and correlation with gold and copper show that, more often than not, silver traded more in line with copper than gold. In inflationary periods, the opposite was true.”
StoneX attributes this to two primary reasons. They explained, “Firstly, the nature of silver’s supply, which is predominantly derived as a byproduct of base metals or from industrial scrap, prevents it from having a clearly defined equilibrium price in the market. Secondly, a small group of investors sees silver as an accessible way to capitalize on gold’s price volatility.”
They highlighted that “President-elect Trump’s suggestion that Mexico and Canada could face tariffs was enough to unsettle the market, even if these were likely negotiating stances rather than definitive decisions. Mexico accounts for approximately 25% of U.S. silver imports, and Canada accounts for 10%. Just the idea of such tariffs was enough to drive silver prices higher. However, as is often the case with silver, this movement was short-lived. This metal remains one of the most vulnerable to rapid and reactive price swings and should always be approached with caution.”
They concluded, “Silver will continue to respond to any significant activity in the gold market and will also see further transitions this year due to the ongoing fundamental investment deficit growth. While it may face headwinds from European recession and potential oversupply of solar cells, its long-term outlook remains bright, likely continuing to attract investors and speculative funds.”
Meanwhile, Lee Hardman, an analyst at MUFG Bank, noted that the depreciation of the dollar, following Trump’s statement that he would “prefer” not to impose new tariffs on China, might be limited. He argued that Trump is still likely to implement higher tariffs.
Trump has called for lower interest rates and a weaker dollar to support the U.S. economy. However, his policies of higher tariffs, stricter immigration controls, and tax cuts, if enacted, “are likely to bolster U.S. yields and the dollar for a longer period.” In an interview with Fox News, Trump stated that he “prefers” not to impose new tariffs on China, suggesting the possibility of a trade deal.

XAGUSD - Silver will stabilize above $30?!Silver is located between EMA200 and EMA50 in the 4H timeframe and is moving in its medium-term ascending channel. If the decline continues, we can see the demand zones and buy within that zones with the appropriate risk reward.
The first range is suitable for short-term transactions and the second range is suitable for medium-term transactions.
Peter Krauth, author of The Great Silver Bull and publisher of SilverStockInvestor, has stated that silver could achieve substantial gains during a rate-cutting cycle, with advancements in artificial intelligence potentially emerging as a new driver of demand. Krauth examined the silver market and investment opportunities for 2025, highlighting the significant impact of Federal Reserve rate cuts on silver prices, a point supported by historical data.
He explained, “In the last three rate-cutting cycles, if you look at silver prices from trough to peak, silver has, on average, risen by 332%.” Krauth added, “This process might take about one to two years, but it still offers remarkable returns, doesn’t it? You can review the data—this is how silver has historically performed.”
He further noted that if the U.S. economy enters a recession—an outcome many analysts forecast for the first half of 2025—silver could deliver outstanding performance.
Meanwhile, Donald Trump, the U.S. President-elect, has outlined extensive plans to reshape the nation’s energy policies. According to news sources, Trump intends to request funding from Congress to replenish the Strategic Petroleum Reserve. His transition team is preparing a comprehensive energy policy agenda to be implemented shortly after he assumes office.
Trump also aims to repeal President Biden’s clean energy initiatives and prioritize natural gas. He may condition U.S. financial support for the International Energy Agency (IEA) on its refocusing towards oil and gas while countering its emphasis on green energy.
At the same time, analysts at Deutsche Bank have expressed concerns that the Federal Reserve might cancel its anticipated December rate cut. These concerns stem from stronger-than-expected economic resilience, a stable labor market, and persistent inflation above 2.5%.
Although the analysts still forecast a rate cut in December, the risk of a delay has increased. They predict that the federal funds rate will reach 4.375% by the end of 2025, exceeding the estimated neutral range. This suggests that the Fed may maintain higher rates for an extended period.
Furthermore, Deutsche Bank expects the Federal Reserve to lower rates to a neutral range of 3.75-4.00% in 2026 and 2027, as the impact of tariffs is likely to gradually reduce private domestic demand, creating room for more rate cuts in the long term.

$40 Silver in Sight? BofA Says Yes The Gold-Silver Ratio (XAU/XAG) measures how many ounces of silver are needed to purchase one ounce of gold, providing a clear example of the relative performance of each metal.
Bank of America (BofA) has argued there could be an opportunity to short gold against silver at its current ratio of 83.50, targeting a move down to 78.50 or 75.00, with an upside stop at 87.50.
A decline in the ratio can occur either if silver rises faster than gold or if gold falls more sharply than silver.
BofA’s 2024 gold price targets of $2,368, $2,538, and $2,643 have already been hit, with the next target set around $2,733. However, the bank advises caution on gold, instead hinting traders could focus on silver, which is nearing eleven-year highs. According to the bank, the ratio recently formed a double top, signaling a bullish outlook for silver. Silver’s potential upside targets range between $36.02 and $40.

GOLD esting resistanceThe gold price is showing quiet negative trading, gradually moving away from the 1963 level, reinforcing expectations of the continuation of the downward trend during the coming sessions, with its next target at 1943, stimulated by the negativity of the Stochastic indicator, which is clearly visible now, with a reminder that the continuation of the downward wave depends on stability below the 1963 and 1981 levels.
Pivot Price: 1963
Resistance prices: 1981 & 1998 & 2017
Support prices: 1943 & 1931 & 1912
The general trend expected for today: bearish
timeframe: 4H

Gold 4H price is on a sideways pathThe price of gold has been fluctuating sideways in the past sessions, stable around the moving average of 50, noting that the stochastic indicator is losing its positive momentum noticeably, waiting to stimulate the price to resume the expected negative trading in the immediate term, which aims to test the 1964 level initially.
Therefore, the downward trend will remain expected for the coming period, keeping in mind that the breach of 1996 will stop the expected decline and lead the price to attempt to restore the main upward trend.
Pivot Price: 1983
Resistance prices: 1996 & 2010 & 2022
Support prices: 1964 & 1947 & 1933
The general trend expected for today is bearish

Gold price is under negative pressureif it falls above 1983 in this direction will rise to 1996 then 2010 then 2022
but if it is below 1983 the direction will go down 1964 , 1947 then 1933
Pivot Price: 1983
Resistance prices: 1996 & 2010 & 2022
Support prices: 1964 & 1947 & 1933

GOLD 4H maintains its positive stabilityHello traders, The price of gold fluctuates near the support of the ascending channel. It receives continuous positive support from the moving average of 50, which supports the chances of continuing the rise within this channel and heading towards achieving our positive goals that started in 1996 and extended to 2010.
In general, we will continue to favor the upward trend for today unless the 1983 level is broken and holds a daily close below it.
Pivot Price: 1983
Resistance Price: 1996 & 2010 & 2022
Support price: 1964 & 1947 & 1933
The general trend expected for today is bullish
timeframe: 4H

GOLD 4H within a positive patternHello traders, The recent gold price trades are confined within a descending secondary channel, which we believe constitutes a bullish continuation flag pattern, as shown in the chart,The price of gold continues to fluctuate around the 1963 level, and faces some negative pressure to move below it now, which requires attention in the upcoming trading, as consolidation below this level will stop the positive scenario and place the price under negative pressure, mainly targeting the 1951 areas.
We point out that the price needs to rise above 1963 to reinforce the positive expectations, the next main target of which is 1981.
Pivot Price: 1963
Resistance Price: 1981 & 1996 & 2010
Support price: 1951 & 1938 & 1925
The general trend expected for today: bullish
timeframe: 4H

GOLD 4H Midday update Hello traders,The price of gold continues to fluctuate around the 1963 level, and faces some negative pressure to move below it now, which requires attention in the upcoming trading, as consolidation below this level will stop the positive scenario and place the price under negative pressure, mainly targeting the 1951 areas.
We point out that the price needs to rise above 1963 to reinforce the positive expectations, the next main target of which is 1981.
Pivot Price: 1963
Resistance Price: 1981 & 1996 & 2010
Support price: 1951 & 1938 & 1925
The general trend expected for today: bullish
timeframe: 4H

GOLD 4H price achieves the extended targetHello everyone, The price of gold rose strongly yesterday to succeed in achieving our expected target of 1985. We notice that the price begins today with more positivity to try to penetrate this level, which leads the price to achieve more expected gains during the coming sessions, paving the way for heading towards the levels of 1991 and then 2009 as stations—next main.
Moving average 50 continues to support the proposed bullish wave, taking into account that failure to consolidate above 1977.25 will stop the expected rise and put pressure on the price to turn lower.
Pivot Price: 1977
Resistance Price: 1991 & 2009 & 2024
Support price: 1957 & 1943 & 1929
timeframe: 4H

GOLD new week Bullish hello everyone, The gold price is facing noticeable negative pressure to attack the 1913.15 level, which requires attention in the upcoming trading, as continuing the decline and confirming the break of this level will stop the positive scenario suggested in the morning and put the price under negative pressure during the coming sessions, while the price needs to consolidate above 1913.15 to resume the bullish wave that is present. Its next major target is at 1945.20.
The general trend expected for today is bullish

Unleashing the Potential of Defensive Market Sectors for a 10x RIn these unpredictable times, it is crucial to strategize and safeguard our investments against market volatility. While some may shy away from uncertainty, smart traders like yourself recognize the immense opportunities that lie within. By focusing on defensive market sectors, we can position ourselves for success, even in the face of adversity.
So, what are these hidden gems, you ask? Let me enlighten you! Our thorough analysis and expert insights have highlighted three subdued ETF sectors that hold tremendous potential for exponential growth. By going long on these stocks, you can seize the opportunity to maximize your returns and secure a bright future for your portfolio.

GOLD 4H try to down GOLD for the next week will trade at the bearish zone
reminding you that, consolidation under 1873 is important to achieve the suggested targets as breaching it will push the price to build a bearish wave to reach 1860 , 1850 , and 1838
As for renewing bullish attempts, consolidation above 1873 will support the price to rise up again and recover its positive momentum to retest again to 1886 , 1896 , and 1911
Support line: 1860 , 1850 , 1838
Resistance line: 1886 , 1896 , 1911
The general trend expected for today: Bearish
The expected trading range for today is between support 1850 and Resistance 1886

GOLD 4H OUTLOOK GOLD
reminding you that, consolidation under 1893 is important to achieve the suggested targets as breaching it will push the price to build a bearish wave to reach 1885 , 1880 , and 1875
As for renewing bullish attempts, consolidation above 1893 will support the price to rise up again and recover its positive momentum to retest again to 1903 , 1911 , and 1923
Support line: 1910, 1902 , 1875
Resistance line: 1903 , 1911 , 1923
