XHB – A continuing long-term short with further downside potentiIn my analysis it is unquestionable that the housing market is weakening further, and a significant mid-term decline is inevitable.
My godchild is currently spending a few months in the United States, preparing for an English degree. What she tells me about the housing situation and grocery prices is even more alarming than I expected.
I have already taken some short positions during the decline since September and closed part of them. Now I see further downside potential, so I have added long-dated put options, some in-the-money for longer setups and some out-of-the-money for shorter-term moves.
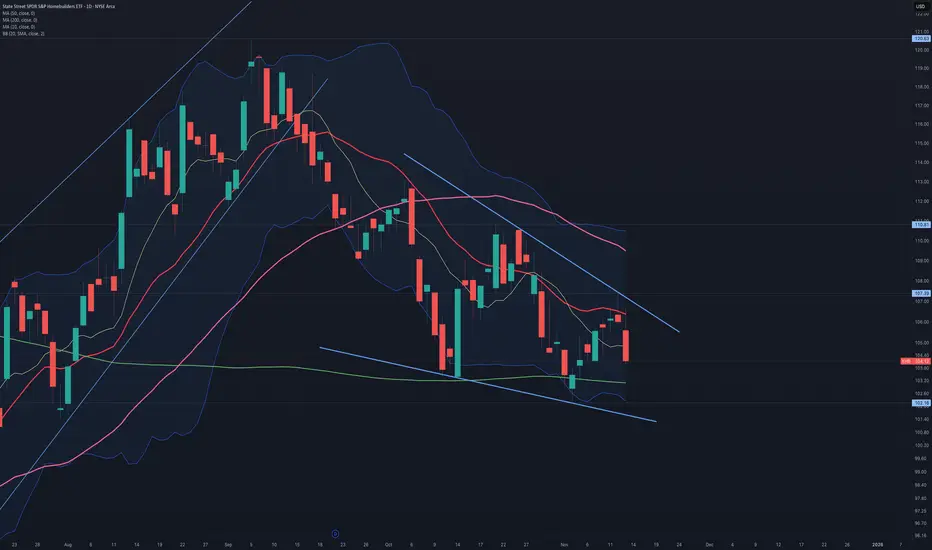
On the chart, we can see that price has breached the CIB line (yellow) and continued downward. At the U-MLH, we are again seeing signs of weakness - a favorable setup for action.
By the time my godchild returns from the U.S. in May 2026, I’m confident I will be able to treat her to steak and lobster, courtesy of this trade.
If not, well - my Carbonara Speciale is also a fine way to soothe the sting of a stop-loss.
Take care out there.
XHB

$XHB: A POTENTIAL REVERSAL PATTERN Monitoring a potential Falling Wedge. If it pans out (missing the last leg down) it should be followed by a sharp move to the upside
XHB - Housing Is In Real Trouble - My Short explained🏠 Some Facts & Fundamentals first 🏠
The Fed has made its first rate cut in 2025, and more are expected if inflation remains under control. That could put downward pressure on long-term mortgage rates, which may give the market a little boost.
Builders (like Lennar) are 🏚️ facing profit pressure 🏚️ due to affordability and are offering incentives (rate buydowns, other discounts) to spur demand.
📈 Now to the technicals 📉
Price went up to the Centerline. The 80% rule played out like textbook.
Then it closed above the Centerline, and failed to move further up to the U-MLH, which is a loud 🚨 warning sign 🚨.
And finally, we have a confirmed "Hagopian", when we close below the Centerline this Week.
To me it's all perfect in line - I mean, the TA & Fundamentals.
My plan is, to play XHB short with LEAP Options (182 Days) and take profit on the way down, which is at the Centerline, 1/4 Line and the L-MLH.
Of cours I would bail out or hedge, if price open & close again above the Centerline on the weekly time frame Chart.
⚠️ Stay updated ⚠️
I will start something new in one or two weeks, so you better don't miss it and follow! §8-)
❤️ THANK YOU ALL ❤️
...for the Boosts and Follow from this week. Your feedback is what makes it worth to post!
I wish you all a relaxing and happy weekend §8-)

Home building Will it continue or start decliningThis could be a leading indicator for what is to come. Let's keep an eye on it.
We do have a bearish divergence on the monthly RSI. It also is happening on the weekly as well.
It is to early to tell what direction it will go. We should expect a strong bounce from here and see where it goes.
Best regards.

TOLL Brothers #TOL new high vs US single family home priceHomemakers are making money over fist.
Does this confirm that the housing bull market will continue.
It seems like it doesn't it
This ratio highlights the housing bottom in the 90's
this Ratio also topped out in 2005 before the housing bubble popped
#Roaring20's

Bull Market in Housing to continue till 2027It would surprise many.
So far House prices have been holding up with rates going parabolic
Strong economies can usually handle a few years of stable rates in around 5%
Supercycle's generally last 16-18 years
As we saw in the great Bull run of 1982 to 2000
A repeat of this cycle timeframe: would mean
#Bitcoin top 2025 (2009 inception)
#Stocks 2026 (march 2009)
#property 2027 due to lag and time to make a sale. (End of 2011)

Macro Monday 3 - SPDR Homebuilders XHBMacro Monday
SPDR Home builders ETF (XHB)
This equal weighted index tracks 35 holdings of the homebuilders segment of the S&P Total Market Index (TMI) and is spread across large, mid and small cap stocks.
These comprise of the Homebuilding sub-industry, and may include exposure to the Building Products, Home Furnishings, Home Improvement Retail, Home furnishing Retail, and Household Appliances sub-industries.
The Chart - AMEX:XHB
The Chart can be used as a leading indicator for the US housing market as the stocks in the XHB comprise of companies that provide the materials and products to build new houses and renovate homes. These products are higher up the supply chain and sold before construction commences or during.
In the past the XHB chart provided a significant advance warning of the 2007 Great Financial Crisis which is illustrated in red on the chart. A similar negative divergence would be worth watching out for in the future.
At present the performance of XHB is ahead of the S&P500. XHB is 5% from ATH’s at $87.00. This is in keeping with how this chart leads the market as it includes products and materials required for new builds and renovations. I would expect some resistance at the ATH which could act as a decision point for price. A break above the ATH with support established on it would be positive for price. A rejection off the ATH or a false break out and we would need to monitor price closely to see can price find support on the 10 Month SMA. If a lower high occurs on XHB (like in 2007), this could be an early warning signal of downward price pressure to follow on the S&P500.
As noted on the chart the average performance post MACD cross is a price increase of 80%;
- We are currently at $83.50 which is a price increase
of 21% from the recent MACD cross.
- A revisit of the ATH at $87.00 would be a price
increase of 26% from the recent MACD cross.
- An 80% average increase would lead us to the top
of the parallel channel (see chart).
- None of the above percentages are guarantees, we
are just looking at probabilities.
Factoring in that we are above the 10 month moving average and that it is sloping upwards, I remain positive about the continued performance of XHB, although I would not be surprised to see resistance at the ATH of $87.00 and a pull back to the 10 month SMA would be standard. If a weekly candle closed below the 10 month SMA, this is where I would start to get concerned and would then start to lean bearish. If we got follow through lower after that point, this would be alarm bells for me.
We can draw a correlation here to the first Macro Monday chart I shared on July 3rd, the Dow Jones Transportation Average Index DJ:DJT which also established a lower high as the S&P500 CBOE:SPX continued its ascent. Both the XHB and the DJT demonstrated they can be leading economic indicators by establishing lower highs prior to the 2007 Great Financial Crisis.
PUKA

New Floors with Lumber Liquidators LL commodities retail rally“Inequality can be done away with only by establishing a new society,
where men and women will enjoy equal rights,
resulting from an upheaval in the means of production and in all social relations.
Thus, the status of women will improve only with the elimination of the system that exploits them.”
Lumber Liquidators looks good for a reversal.
Small share float, strong sales, strong P/B P/E P/C and near zero debt vs equity.
Risks: Value Trap, Discretionary spending retraction, macro momentum stays negative


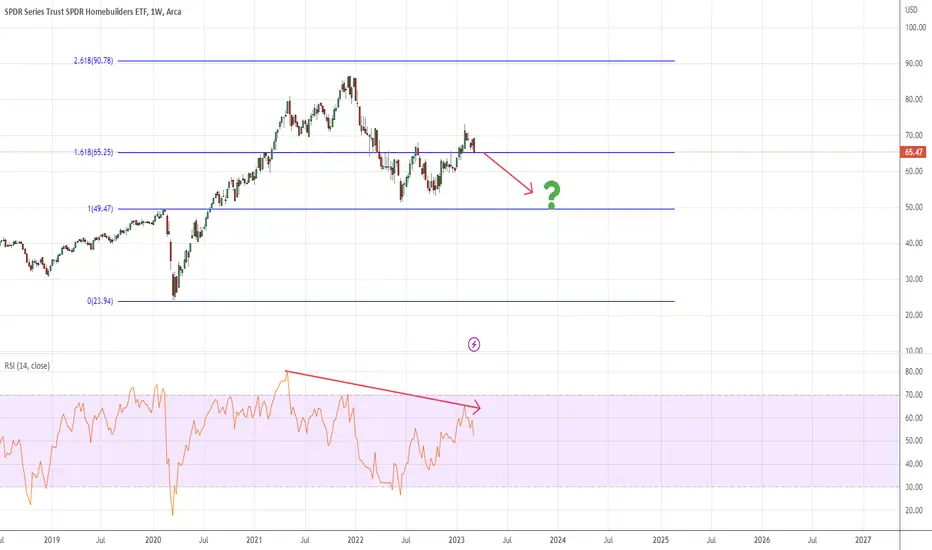
XHBXHB needs to find support at the 1.618 fibb level. If not it looks like there is more downside to come in homebuilders.
XHB (home builders)pretty clear we are in final stages of ending diagonal. I believe we will finish next year with a blow off top, ED.

SPDR Homebuilders ETF (XHB) at risk of bearish reversalAMEX:XHB
US housing market, a key contributor to US economic growth via the wealth effect that will trickle down to consumer spending & confidence.
We can decipher its impact on the overall stock mkt via sentiment/technical analysis on2/2 The recent rally of the $XHB from 19 Oct 22 low to 22 Nov 22 has been accompanied by declining volume & underperformance against the SP 500 ETF $SPY
Looks like up move has hit an inflection zone for a potential bearish reversal below 64.40 key MT pivotal resistance. $XHB
2/2 The recent rally of the $XHB from 19 Oct 22 low to 22 Nov 22 has been accompanied by declining volume & underperformance against the SP 500 ETF $SPY
Looks like up move has hit an inflection zone for a potential bearish reversal below 64.40 key MT pivotal resistance.

XHB ! US housing market Burst- Upcoming Recession-BTC 100K+I'm looking at XHB weekly timeframe and comparing 2006-2009 US housing market with current situation. On 17 July 2006 XHB bounced 38% then dumped and lost previous swing low/ key support /28-30$ level/ on 23 July 2007/371 days/. When XHB lost key support SPX made first top and second top was 3 months later with bearish divergence, after which S&P dumped 57% and stayed in a bear market 511-595 days. After the bursting of the U.S. housing bubble US great recession started from December 2007 to June 2009. XHB dumped 73% and bottomed at 8$ in 2009. I think the current situation is the same and the same scenario will play out if XHB loses previous swing low and key support/50-52$/. It has already dumped and lost key trendline 60-61$ then pumped 32%. I putted alarm at 50-52$ zone and waiting for break down in coming months, I history repeats the same way, XHB will break down in Q2-2023 /approximately in April-June 2023/ and 140 days later a big recession starts. I think at the same time SPX and BTC will top as well. But before that my best case and most bullish scenario for BTC is new ATH and even 120-145K top target. I'm sure BTC has already topped at 17.5K on 18.06.2022 based on my analysis. You can check them looking at bellow attached files. Later I will post my other scenarios for BTC.

Housing correlations - building, existing, selling.Simple chart to look at the relation between hew home builds, a broad housing ETF and a mortgage lender.
It demonstrates that they all have a strong correlation and that mortgage company performance is a leading indicator of housing market performance and that new build housing stocks are a leading indicator for the housing market in general.

$XHB ~ Correction still in progress...Just as the real estate sector, expect homebuilders continue to correct the same. Nice pull back for a wave 2 will present a amazing opportunity as we move forward in the decade. Inventory is very low which is good since rates are moving higher.

30 Year Mortgage - Pffffffffffffft.Homies and the like are due for a correction of extraordinary measures.
Count on it.
Plan for it.
Move the hell out of the way of it.
Or Don't.
Housing won't hold on much longer prior to the downdraft.
It rolled over in Mid April but did not show until May.

XHB Accumulating on support Been bearish on the markets for a few months now but it looks like XHB should get a slight rebound off support here.

4/24/22 XHB SPDR Series Trust Homebuilders ETF ( AMEX:XHB )
Sector: Miscellaneous (Investment Trusts/Mutual Funds)
Market Capitalization: $--
Current Price: $61.34
Breakdown price: $60.00
Sell Zone (Top/Bottom Range): $61.40-$68.80 (1st)
Price Target: $51.40-$49.40 (1st)
Estimated Duration to Target: 107-110d (1st)
Contract of Interest: $XHB 9/16/22 60p
Trade price as of publish date: $4.10/contract


EverGrande Real-estate situation in China = Black Swan Event?Will the EverGrande Real-estate situation in China be the catalyst that pops our real estate bubble and slow down our homebuilder industry?
This was last year, when they listed their stock to the HK market and scammed retail money. Now they are out of cash again, and their bonds are worth less than 30% on the dollar.
If this thing collapse, it could be China's version of the Lehman Collapse.
"
The world’s most indebted developer has warned Chinese officials it faces a potential default that could roil the nation’s $50 trillion financial system unless regulators approve the company’s long-delayed stock exchange listing. Shares and bonds fell in volatile trading.
China Evergrande Group mapped out the scenario in an Aug. 24 letter to the Guangdong government seen by Bloomberg, in which the company sought support for a restructuring proposal needed to secure the listing and avert a cash crunch.
Some of Evergrande’s biggest strategic investors have the right to demand their money back if the company fails to win approval for a backdoor listing on the Shenzhen stock exchange by Jan. 31. If investors refuse to extend the deadline, Evergrande will need to repay as much as 130 billion yuan ($19 billion), equivalent to 92% of its cash and cash equivalents."

$SITE: Cup and Handle, Homebuilder ProxyXHB trying to make a strong push today and SITE has shown some recent strength against the index as well. Could we see more from this landscaping company?

$TPX: Sleep Tight BearsXHB broke through an important 77.5 low volume node today and TPX has just been on fire. You might be asking how a mattress company and homebuilders are correlated well I'm playing it as a proxy and potentially one that could outperform the homebuilder index in general. You gotta have mattress for those homes :)

Housing Market Correction Housing market is looking pretty toppy. Would suggest holding off on buying a home for a few months.. Supply is greatly starting to outpace demand.
