THE WEEK AHEAD: KBH, DAL, ICLN, SLV, EWZ, KRE, XLE, IWM/RUTEARNINGS:
There aren't a ton of earnings next week. Some financials are announcing, but I generally don't play those a ton for volatility contraction, since they never really frisk up that much, and all are below 50% 30-day implied here. KBH provides the best bang for your buck with the implied metrics I'm generally looking for (>50%), followed by DAL. Both, however, are at the low end of their 52-week range, in part due to the massive vol spike we experienced in March, which will make that metric somewhat misleading here.
KBH (18/56/14.5%),* Tuesday after market close.
DAL (7/53/12.9%), Wednesday before market open.
C (17/44/9.8%), Friday before market open.
JPM (14/32/7.8%), Friday before market open.
WFC (22/44/10.6%), Friday before market open.
EXCHANGE-TRADED FUNDS RANKED BY PERCENTAGE THE FEBRUARY 19TH AT-THE-MONEY SHORT STRADDLE IS PAYING AS A FUNCTION OF STOCK PRICE:
ICLN (14/79/20.0%)
SLV (31/48/11.3%)
EWZ (16/44/10.6%)
XLE (22/41/10.2%)
KRE (17/42/9.9%)
BROAD MARKET:
Pictured here is an IWM short put out in March at the strike paying at least 1% of the strike in credit. An IRA trade, I would look to roll up intraexpiry to lock in realized gain with >45 days 'til expiry, take profit on approaching worthless (<.20), and sell call against if assigned. Currently 67 days 'til expiry, it is understandably a bit long in duration, but I already have some on in the February monthly.
IWM (26/34/7.6%)
QQQ (21/31/6.9%)
DIA (14/24/5.2%)
SPY (11/24/5.0%)
EFA (14/21/4.7%)
* -- The first metric is the implied volatility rank or percentile (i.e., where implied is relative to where it's been over the past 52 weeks); the second, the 30-day implied volatility; and the third, what the at-the-money short straddle is paying as a function of the stock price.
XLE

Sector Winners and Losers week ending 1/8Energy (XLE) finds itself back at the top of the sector list for the first week of 2021. It's not something you might expect as the blue wave hit US politics, which doesn't bode well for traditional energy stocks. However, crude oil is over $50 a barrel for the first time since April after Saudi Arabia surprisingly cut output.
The blue wave did have some expected impact this week. After the Georgia run-off results showed Democrats would take control of the senate, US Treasury Bond yields took off as investors expect more stimulus that would further impact the US Dollar. That caused Financials (XLF), especially big banks, to have big gains on Wednesday and Thursday.
Materials (XLB) benefited from the blue wave news, as we can expect big investments in US infrastructure with the new administration.
Industrials (XLI) also had a boost on Wednesday, with some benefit from infrastructure spend, but also several segments like airlines likely to benefit from further stimulus. However, Industrials did not continue the rise and ended the week behind the S&P 500.
Consumer Discretionary (XLY) got a boost on Friday, perhaps from higher than expected Consumer credit numbers on top of the promise of new stimulus. Quite a few people had a good Christmas it seems.
At the bottom of the list is Real Estate (XLRE) which is likely to suffer in the bottom line from the higher interest rates.
Technology (XLK) had the opposite reaction to the blue wave on Wednesday but regained from losses on Thursday and Friday to end the week just behind Industrials.
Also notable is Utilities (XLU) which lost for the week, but had gains on Friday as a defensive move heading into a likely emotion filled weekend for the United States.

The revival of Energy - XLE on the riseXLE has been in a range for quite some time with the fall of Oil price from the first lockdown. But as thing recover and demand for Oil is returning to somewhat normal levels, the ETF is starting to give signs of life as well.
RSI well above 50 and is moving slowly into overbought territory, but this means that there is more room for the price to rise.
MACD has made a crossover and the histogram is turning positive.
Resistance level circa 40 has been breached.

Sector Winners and Losers for 1/5 and 1/6I normally publish this chart on weekly basis as part of my Week in Review work but I thought it was interesting to look at it today, in the context of the Georgia run-off election results. There is also the turmoil in DC, but that did not seem to impact the sector leaders list (the afternoon dip impacted all equally).
Energy (XLE) is leading over the two days, although was in third place for Wednesday. This position is not related to politics, but rather that crude oil prices moved past $50 for the first time since February. A much smaller part of Energy is the solar stocks which will benefit greatly from a Democratic controlled congress and presidency. However, the solar stocks make up a small part of XLE and are not the reason for the sector performance.
Materials (XLB) is the next sector on the list. Materials sector will benefit greatly from expected spend on infrastructure in the US.
Financials (XLF) was the winner on Wednesday, as yields on treasury bonds rose, bringing higher interest rates that will benefit banks.
Industrials (XLI) got a boost from both the outlook for infrastructure spend, but also the promise of more stimulus that would easily pass through congress and signed by the president.
The sectors that did not fair well with the news included Communication Services (XLC) and Technology (XLK) which both include "big tech" names that are likely to take a hit from higher bond yields. Similarly Real Estate (XLRE) will incur higher costs due to the higher interest rates.

Sector Winners and Losers week ending 12/31Communications (XLC) and Consumer Discretionary (XLY) spent about half the week each at the top of the sector list.
But it was Utilities (XLU) that would rise at the end of the week as the winner. No doubt a defensive play going into the long weekend and a turn of the clock to a new year.
Energy (XLE) had a very short-lived time at that top on Monday morning, but ended the week as the worst performing sector. Energy was the only sector to end the week with a loss.

XLE: Divergence->left turn->slow burn uphill?-ST divergence in the fall- confirmation of trend change to at the VERY least follow the boring, ascending slowly yellow floor???????
-test of yellow trend again->slow burn
-bounce off 50% gap followed by BO, Retest, Resumption of Red
-BO-R-R off green, up to fill the gap from the crash and 83
-insolvency crisis in 21 to bring it back down yellow?
-gunna watch this one, oil is going no where

THE WEEK AHEAD: BBBY, MU EARNINGS; ICLN, SLV, XLE, IWM/RUTEARNINGS:
I've culled down all of next week's earnings announcements to options highly liquid underlyings where the 30-day is >50% and am left with two potential candidates for volatility contraction plays: BBBY (23/99/26.3%)* and MU (23/53/14.0%).
BBBY announces on Thursday before market open, so look to put on a play in the waning hours of Wednesdays session; MU, announces on Thursday after market close.
Pictured here is a delta neutral short strangle in the February cycle (49 days), which was paying 1.27 at the mid price as of Friday close with break evens wide of two times the expected move on the call side and slightly above the 2x on the put and delta/theta of -1.07/3.12. Naturally, you can see the call side skew here, with the similarly-delta'd short put 3.76 away from current price, but the call 7.24 away, so the underlying may merit a look at alternative plays that take advantage of this.
In contrast, the shorter duration January 15th 15/22.5 (14 days) was paying 1.02, with delta/theta metrics of .21/7.91, with the natural trade-off's being less room to be wrong, but a quicker resolution of the trade should you be right.
With MU, I'd look at a Plain Jane 2x expected move short strangle, which here would be the January 15th 68.5/85, paying 1.71 or the February 19th 62.5/90, paying 2.30.
EXCHANGE-TRADED FUNDS RANKED BY PERCENTAGE THE FEBRUARY 19TH AT-THE-MONEY SHORT STRADDLE PAYS AS A FUNCTION OF STOCK PRICE:
ICLN (9/51/15.0%)
SLV (33/48/13.6%)
XLE (23/41/11.4%)
XBI (27/39/11.2%)
EWZ (14/39/11.1%)
GDX (15/38/11.1%)
XME (14/38/10.7%)
BROAD MARKET:
IWM (25/31/8.1%)
QQQ (19/27/7.1%)
SPY (15/22/5.4%)
EFA (20/21/5.2%)
BOND FUNDS:
TLT (16/18/4.4%) (Yield: 1.609%)
HYG (7/13/2.0%) (Yield: 4.917%)
EMB (4/7/2.0%) (Yield: 4.024%)
AGG (28/8/1.7%) (Yield: 2.252%)
* -- The first number is the implied volatility rank or percentile (i.e., where 30-day implied is relative to where it's been over the last 52 weeks); the second, 30-day implied; and the third, what the February 19th at-the-money short straddle is paying as a function of stock price.

Short Energy sector 🛢️ - Swingtrade, high Risk/Reward trade If you like the idea, do not forget to support with a 👍 like and follow or comment.
Leave a comment that is helpful or encouraging. Let's master the markets together.
Hi fellows, just one of my today swingrades:
As you can see ERY bottomed out and forming a bull flag pattern.Rising bull momentum is there clearly represent by divergence on Momentum and CCI indicators. Today will be good opportunity to get in.
------------------------Trade setup ---------------------------
Entry: 34.34
Stop Loss: 32.75
Profit target: 39.76
Time stop: 5 days
------------------------------------------------------------------

OPENING (IRA): XLE JANUARY 15TH 32 SHORT PUT ... for a .51/contract credit.
Notes: The exchange-traded fund with the highest implied 30-day on my board. 1.6% ROC at max; 13.0% annualized. Will add "rungs" in subsequent cycles (i.e., Jan/Feb/March) if implied hangs in there.

Sector Winners and Losers week ending 12/25The short trading week was not without its excitement.
Financials (XLF) was the big winner of the week. The fed stress test last week resulted in banks being allowed to resume share buy bank programs, giving some tailwinds to the sector.
Technology (XLK) took the lead on Tuesday, but fell back into second place at the open on Wednesday.
All other sectors underperformed the S&P 500 for the week.
Energy (XLE) was the leading sector for Wednesday's session but was the worst performing sector on the other days, coming in last for the week.

THE WEEK AHEAD: SLV, GDX, XLE, IWM/RUTWith two shortened market weeks in a row for Christmas and New Year's, I probably won't be doing a ton here, but figured I'd do a post for how exchange-traded funds are looking in the waning weeks of 2020 ... .
EXCHANGE-TRADED FUNDS ORDERED BY PERCENTAGE THE AT-THE-MONEY SHORT STRADDLE NEAREST 45 DAYS IS PAYING AS A FUNCTION OF STOCK PRICE:
SLV (32/46/11.9%)
GDX (18/43/11.0%)
XLE (25/42/10.7%)
EWZ (14/40/10.0%)
XBI (21/36/9.1%)
KRE (18/36/9.3%)
I'm currently in small XLE, EWZ, KRE, and GLD positions, but will consider adding on weakness if any comes my way and the implied volatility sticks in there. One thing I don't want to do is to constantly follow high implied volatility, only to find myself grossly overweighted in energy, Brazil, and regional banks, however, so don't want to go too crazy adding in sectors that have been high in the list week in and week out over the past several months.
BROAD MARKET:
IWM (22/29/6.9%)
QQQ (19/26/6.5%)
SPY (13/22/4.9%)
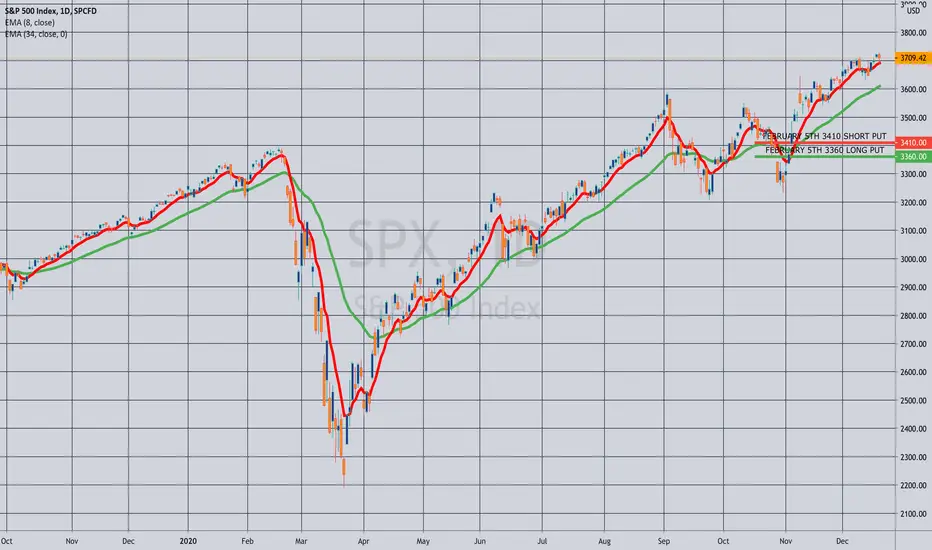
Pictured here is an SPX 50 wide set up to pay at least 10% of the width of the spread, or around 5.00/contract in the expiry nearest 45 days, which would be the February 5th weekly (currently 47 days until expiry). I would ordinarily opt for a higher implied volatility RUT setup, but there currently isn't a February 5th expiry available. You can certainly go with the January 29th (40 days) or the February 19th (59 days), with the preference being to put these on in a down day or days. Smaller account should consider going with SPY or QQQ spreads* with the appropriate combination of of contracts and spread widths commensurate with your account size.
BOND FUNDS:
TLT (1/15/3.5%) (1.609% Yield)
EMB (11/8/2.6%) (4.024% Yield)
HYG (7/10/2.1%) (4.917% Yield)
AGG (29/9/1.9%) (2.252% Yield)
In the IRA, I've been selling HYG short put here of 30 days' duration or so for a credit that is around the monthly dividend. With the December 18th short put having expired worthless, I'll look at adding some in the January 22nd cycle, where the 85 is paying .41 at the mid. As I've pointed out before, the premium in bond funds generally stinks, but I've been using this strategy as a way to deploy buying power that would otherwise be sitting there earning virtually nothing while I await down days or a higher volatility environment.
* -- Unfortunately, NDX isn't as liquid as either SPX or RUT, so I virtually never trade NDX spreads, opting instead for equivalent sizing in the QQQ's (e.g., 5 10-wides).
Sector Winners and Losers week ending 12/18The sectors took on a character we have not seen for some time.
Technology (XLK) is back to leading the sectors for this week. Helped by a number of breakouts in technology growth stocks, some of those fueled by speculation in security stocks following a wide and troublesome security breach that impacted both the government and private sector.
Consumer Discretionary (XLY) came in second, after very briefly passing Technology on Wednesday morning. Retail Sales data and Santa Claus are likely the reasons for the great performance.
Materials (XLB) also performed well on Building Permits and New Housing Starts data that came in better than expected.
The big loser for the week was Energy (XLE). This is after five weeks of leading the sector list. Despite vaccine availability and positive oil prices giving it a boost midweek, the nervous sentiment caused by new lockdowns worldwide have put downward price pressure on the sector.

CVX-2.169*XOM $XOM Exxon Mobil Corp vs. $CVX Chevron CorpQuantamental Tools for Proprietary and Retail Investors.
Statistical Arbitrage Opportunities Delivered to Your Inbox.
QuantChart. io
Long 1000 $CVX
Short 2169 $XOM
Mean Reversion Time: 12 Trading Days

CVX-2.169*XOM $CVX Chevron Corp vs. $XOM Exxon Mobil CorpQuantamental Tools for Proprietary and Retail Investors.
Statistical Arbitrage Opportunities Delivered to Your Inbox.
QuantChart. io
Long 1000 $CVX
Short 2169 $XOM
Mean Reversion Time: 12 Trading Days

THE WEEK AHEAD: FDX, LEN, MU, CCL EARNINGS; XOP/XLE, IWM/RUTEARNINGS ANNOUNCEMENT-RELATED VOLATILITY CONTRACTION PLAYS (IN ORDER OF ANNOUNCEMENT):
Here are the options-liquid underlyings announcing next week that I've culled down to 30-day >50% as candidates for volatility contraction plays:
LEN (21/49/11.6%),* announcing Wednesday after market close
MU (24/52/12.2%), announcing Wednesday (no time specified)
FDX (29/53/11.9%), announcing Thursday after market close
CCL (27/91/21.1%), announcing Friday (no time specified)
Pictured here is a January 15th 17.5/27.5 short strangle in CCL which announces Friday, paying 1.36 as of Friday close with delta/theta of -4.86/4.84 with break evens wide of 2 times the expected move on the call side, and between the 1 and 2 x on the put. Although no time is currently specified, it is likely to announce before market open (because who, like, announces after Friday close?), so would look to put on a play in the waning hours of Thursday's session if you want to take advantage of Friday's post-announcement volatility contraction.
EXCHANGE-TRADED FUNDS RANKED BY BANG FOR YOUR BUCK:
XOP (21/60/16.3%)**
GDXJ (15/44/12.9%)
XLE (30/45/12.5%)
KRE 924/41/11.1%)
SLV (25/40/11.2%)
GDX (16/38/10.7%)
EWZ (15/39/10.6%)
XBI (24/38/10.0%)
BROAD MARKET EXCHANGE-TRADED FUNDS:
IWM (25/30/7.8%)
QQQ (23/30/7.6%)
DIA (16/23/6.0%)
SPY (16/23/5.6%)
EFA (20/24/5.1%)
TREASURY/BOND FUNDS:
Adding a little bond/treasury section to here since I occasionally park what would otherwise be idle cash in short puts (See Post Below).
TLT (11/15/3.99%) (1.609% yield)
HYG (11/11/2.41%) (4.917% yield)
EMB (5/9/--)*** (4.024% yield)
AGG (29/8/--)*** (2.252% yield)
* -- The first metric is the implied volatility rank or percentile (i.e., where 30-day implied is relative to where it's been over the last 52 weeks); the second, 30-day implied volatility; and the third, what the January 15th at-the-money short straddle is paying as a function of stock price.
** -- Here, I'm using the short straddle price nearest 45 days until expiry to calculate the "bang for your buck" percentage, which would be the January 29th weekly.
*** -- EMB and AGG don't have weeklies nearest 45 days.

Sector Winners and Losers week ending 12/11Despite starting the week in last place, Energy (XLE) rose to the top of the sector list starting from Tuesday as the first vaccine doses were made available in the UK. That positive vaccine news boosted the sector that is likely to benefit from the increased activity in travel and leisure sectors.
Communications (XLC) led at the beginning of the week, but could not keep up with Energy and finished the week in second.
Utilities (XLU) also had moments of leadership on Monday and Tuesday. The sector is a defensive play in equities and an alternative to moving money into other safe havens such as bonds.
Real Estate (XLRE) was the worst performing sector for the week.
Technology (XLK) that heavily impacts market performance, underperformed the S&P 500 this week.

THE WEEK AHEAD: GDXJ/GDX, XLE, KRE, SLV, IWM/RUTEARNINGS:
No options liquid underlyings announcing earnings this week that meet my criteria for a volatility contraction play, although ORCL (24/31) and WORK (2/33) both announce and could be played in some other way.
EXCHANGE-TRADED FUNDS RANKED BY THE PERCENTAGE THE JANUARY AT-THE-MONEY SHORT STRADDLE IS PAYING AS A FUNCTION OF STOCK PRICE:
GDXJ (14/41/12.1%)
XLE (25/41/10.4%)
KRE (23/40/10.6%)
SLV (28/41/10.2%)
GDX (15/38/10.2%)
EWZ (15/39/10.0%)
BROAD MARKET EXCHANGE-TRADED FUNDS RANKED BY THE PERCENTAGE THE JANUARY AT-THE-MONEY SHORT STRADDLE IS PAYING AS A FUNCTION OF STOCK PRICE:
IWM (23/28/7.1%)
QQQ (20/27/6.3%)
DIA (15/21/5.2%)
SPY (12/20/4.8%)
EFA (17/24/4.4%)
Pictured here is a RUT January 22nd 1655/1705 short put vertical with the short option leg camped out at the 16 delta. Markets are showing wide in the off hours, but look to get at least 10% of the width of the spread out of any play, with the preference being to put something on in a down day with the accompanying rise in volatility and expansion of the "probability cone." A smaller alternative would naturally be in IWM, where I'd look to get at least .50 out of January 22nd 162.5/167.5 5-wide.
For those who like to swim naked, the IWM January 22nd 162.5 (15 delta) and was paying 1.91 as of Friday close (1.15% ROC at max as a function of notional risk; 8.93% annualized).
* * *
On the IRA/retirement account front, I'll be looking to programmatically deploy buying power in broad market over medium to long-term time frames over the next several weeks and then turn to focusing on shorter term plays, so you're likely to see some apparently oddball things in my ideas feed that won't make a ton of sense looked at in isolation and won't be for everybody not only due to buying power effect, but due to duration. I'm using SPY here, but one can certainly do something similar in another of the cheaper (a relative term) exchange-traded funds with high liquidity that will allow you to ladder out in time without giving up too much to lack of liquidity in longer duration.
Essentially, it will look like a short put ladder, but with the rungs put on over time in increasing duration in similarly delta'd strikes or in strikes which pay a certain ROC %-age relative to the strike price (e.g., the SPY February 19th 321 short put, paying 3.27; the March 19th 300 short put, paying 3.02; the April 16th 283, paying 2.87, etc.), after which the individual rungs will be separately managed.
Although this isn't particularly buying power efficient relative to defined risk spreads, I'm shooting for a setup that is relatively set and forget running into retirement where I don't necessarily have to pop my portfolio open on a daily (or even weekly) basis to manage trades, but can go for fairly lengthy periods of time without having to touch or manage rungs and with modest expectations as to ROC %-age.
As a "quasi-cash" option, I'll also continue to deploy idle buying power in things like HYG puts (See Post Below) just that I'm not earning 0% of 0 and where I'm comfortable taking on shares and selling call against. Point in fact, that is probably not a bad stand-alone setup for an extremely conservative investor who isn't keen on taking broad market bullish assumption positions at all-time-highs where a number of people are calling "bubble" week after week. That being said, even this type of setup isn't riskless, as we saw in the March "sell everything" dip. At some point, you will potentially have to take on shares ... .

Sector Winners and Losers week ending 12/4Energy ( XLE ) is now in its fourth week of leading the sectors list. It didn't look that way at the beginning of the week when it sold off off sharply amongst disagreements between OPEC members on future oil production. It rose back to the lead as those talks began getting better on Wednesday and OPEC finally had agreement on Friday.
Technology ( XLK ) and Health Services ( XLV ) nearly tied for second. They shared the lead on Tuesday. Health Services had a huge boost after the UK announced approval of the Pfizer vaccine. Both Health Services and Technology didn't move much after the progress on Tuesday, but it was enough to keep them in position for a solid tie 2nd place ending.
Communications ( XLC ) led for two days, before being overtaken by the top three and ending the week in fourth place.
Utilities ( XLU ) was the loser of the week. The defensive play wasn't needed by investors who seemed optimistic about vaccines, stimulus talks and oil agreements. That was enough optimism to ignore the unemployment data signaling trouble for the economy.

Long $USOIL $GUSH $XOPFrom the NYT : "Under the agreement, members of the Organization of the Petroleum Exporting Countries along with Russia and other countries will increase production by 500,000 barrels a day in January and, potentially, by a similar amount in the following months. The increase, less than 1 percent of the global oil market"
From WSJ : "The price rout has also laid low big, publicly traded oil companies like Exxon Mobil Corp. and Royal Dutch Shell PLC, triggering big losses and job cuts. Shell and BP PLC both recently cut their dividend for the first time in years to preserve cash. Chevron Corp. on Thursday said it was joining peers in slashing spending."
Oil companies are an important fixture in all of the most powerful countries in the world. While I fully recognize that the oil industry is a dying one, the financial stress that the majors are currently under is causing them to be undervalued relative to their integration, importance, and efficiency at this point in time.
Higher oil prices from where they currently are is in the best interest of every major economy. It is a perfect time to make this happen given the effectiveness of the almost-approved Covid-19 vaccines.
Just an idea!

Is the oil sector uninvestable? We don't listen to stories about a future no one knows we just simply trade reversals and continuation wave formations our model gives us. We highlighted the xle in late october and took the trade early november. Obviously the vaccine news was a huge boost and we had no idea it was coming but that's the beauty of markets- you don't know what you don't know. So we are uncertain if the sector will continue to move at this pace but until something changes we are staying long
Ingenuity Trading Model is an algorithm used in- Stock, Forex, Futures, and Crypto markets. The model is a Geometric Markov Model :
In probability theory, a Markov model is a stochastic model used to predict randomly changing systems. Markov Models are used in all aspects of life from Google search to daily weather forecast. The randomly changing systems we focus on are the equity, futures, and forex markets. The geometric element of the model is the fractal sine wave structure you can find on any chart you look at across any market and across all time dimensions.
Our model focuses on the current sine wave formation (current state)- geometric price formation along with its volume and volatility over a given time period and using that information to predict the future state- future price movement. For questions or more information feel free to contact me in the comment section or via private chat


THE WEEK AHEAD: XOP/XLE, GDXJ/GDX, KRE, EWZ, IWM/RUTEARNINGS:
It's a light week for earnings announcements, which means it's an even lighter week for options liquid underlyings, none of which meet my cut-off for 30-day implied >50%.
EXCHANGE-TRADED FUNDS RANKED BY PERCENTAGE THE JANUARY AT THE MONEY SHORT STRADDLE IS PAYING AS A FUNCTION OF STOCK PRICE:
XOP (18/59/15.8%)
GDXJ (16/42/13.2%)
XLE (26/46/11.6%)
KRE (24/40/11.4%)
GDX (17/40/11.4%)
USO (7/46/11.0%)
EWZ (15/39/10.6%)
SLV (25/38/10.3%)
Honorable Mention:
GLD (23.5/18.5/5.0%)
* * *
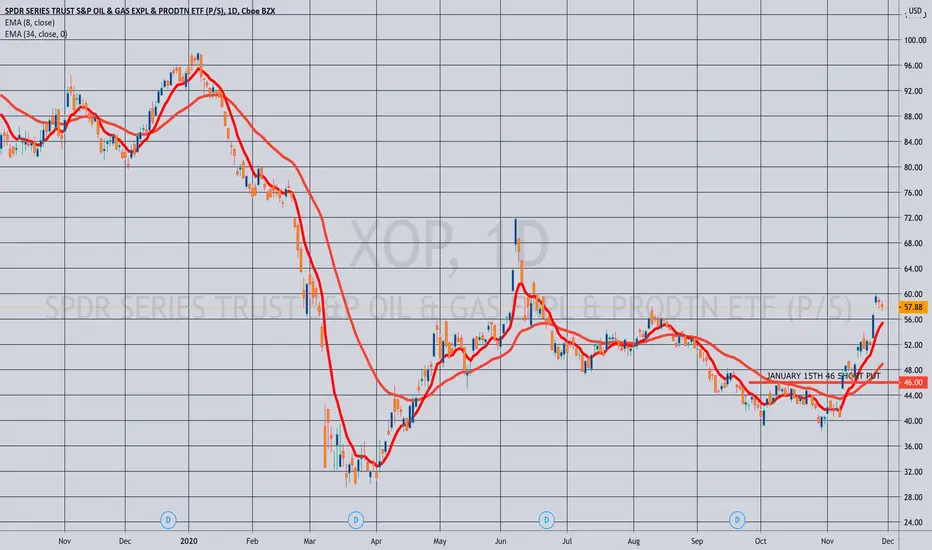
Pictured here is an XOP January 15th 46 short put, which was paying .92 as of Friday close (2.04% ROC as a function of notional risk at max; 15.5% annualized at max). I still like bullish assumption, pandemic recovery plays in the oil space, although implied volatility has bled out quite a bit here, and the break even (45.08) would be above the 2020 lows.
GLD gets an honorable mention here due to its being nearly 15% off of its early August highs with the January 15th strike nearest the 16 delta (the 157) paying .94 as of Friday's close (.60% as a function of notional risk at max; 4.6% annualized). The ROC %-age isn't great, however, but if you're looking to establish a gold position, now might be the time to consider starting one. I'm already working one here, (See Post Below), and will consider adding once December out-of-the-money's fall off or I manage them.
Alternatively, look to establish a position in SLV, GDXJ, or the more liquid GDX, all of which are more scalable due to size and provide more bang for your buck, with the GDXJ January 15th 42 paying .70 (1.7% ROC as a function of notional risk; 12.9% annualized), the GDX January 15th 30 paying .40 (1.4% ROC at max; 10.3% annualized), and the SLV January 15th 19 paying .30 (1.6% ROC at max as a function of notional risk; 12.9% annualized at max).
For those of a defined risk bent, the GLD January 15th 153/158 short put vertical was paying .54 at the mid as of Friday close (10.8% ROC at max; 82.1% annualized).
BROAD MARKET
IWM (23/29/7.8%)
QQQ (19/25/6.9%)
DIA (16/22/5.8%)
SPY (13/21/5.3%)
EFA (16/18/4.6%)
Volatility has pissed out mightily here, and the <10% the at-the-money short straddles are paying in the January cycle are reflective of that.
The IWM January 15th 157 short put was paying .94 (.6% ROC at max as a function of notional risk; 4.6% annualized) as of Friday close, which isn't exactly great. Here, defined is more compelling from a pure ROC %-age return perspective (it usually is), with the IWM January 15th 158/163 was paying .54 as of Friday's close (10.8% ROC at max; 82.1% annualized) and its cash-settled counterpart RUT, paying 5.10 for the January 15th 1610/1660 with similar ROC %-age metrics with the short option legs camped out at the 16 delta strike. Naturally, you can be more aggressive, bringing in the setup more toward the expected move.
Sector Winners and Losers week ending 11/27Energy (XLE) put in a third week of huge gains and topped the other sectors. The sector is up over 40% in the last three weeks. It did pull back a bit on Wed and Fri.
Financials (XLF) also sticks out as a winner for the week, far above the rest of the sectors.
The worst performing sectors were Real Estate (XLRE) and Utilities (XLU). Utilities briefly emerged as a leader for Wednesday afternoon as investors parked money in the safe haven sector for the holiday.
Technology (XLK) underperformed the index for a third week.
