XPD/USD: Mapping A Bullish Swing Trade On Palladium🎯 Title: XPD/USD Palladium Play: The Kijun Thief's Bullish Heist! 💎🚀
Buckle up, Thief OG's! 👑 Pd (Palladium) is flashing a classic bullish pullback play, and we're looking to sneak in with a layered entry strategy. This isn't a race; it's a calculated ambush! 🥷✨
📈 The Setup: Bullish & Bouncy
Asset: XPD/USD (Palladium vs. U.S. Dollar) 💰
Bias: STRONGLY BULLISH ✅ 🐂
Confirmation: A clean pullback to the Kijun-sen (Kijun Moving Average) from the Ichimoku Cloud. Price respecting this level is our green light! 🟢
🎯 The Thief's Entry Plan (Layered Limit Orders)
The breakout above 99.200 confirms the vibe! Our "Thief Strategy" uses multiple limit orders to scale in, averaging our entry like a pro.
Entry Zone: We're setting buy limit orders in layers:
Layer 1: 🎯 1360
Layer 2: 🎯 1380
Layer 3: 🎯 1400
Layer 4: 🎯 1420
💡 Pro Tip: You can add more layers or adjust levels based on your risk appetite!
⚠️ Risk Management (The Escape Plan) 🚨
Stop Loss (The Getaway Car): 🚗💨 A Thief's SL is 1300. This is our line in the sand. If price breaches this, the heist is off!
📢 Note, Dear Ladies & Gentleman (Thief OG's): I do not recommend using only my SL. It's your choice; you can make money then take money at your own risk.
💰 Profit-Taking (Cashing the Loot) 🏦💵
Target: 1620 🎯
Why Here? This area converges with a strong Moving Average resistance, potential overbought conditions, and could be a trap for late buyers. We escape with profits before the chaos! 😎
📢 Note, Dear Ladies & Gentleman (Thief OG's): I do not recommend using only my TP. It's your choice; you can make money then take money at your own risk.
🔍 Related Pairs & Market Context 🌍
Keep an eye on the whole precious metals family for confirmation! 👀
XAU/USD ( TVC:GOLD ): 👑 The king of metals. A strong Gold often lifts the whole complex.
XPT/USD ( CAPITALCOM:PLATINUM ): 💍 Palladium's sister metal. They often move in correlation.
TVC:DXY (U.S. Dollar Index): 📉 A weaker TVC:DXY typically boosts dollar-denominated commodities like Palladium.
✨ Footer & Community Love ❤️
✨ “If you find value in my analysis, a 👍 and 🚀 boost is much appreciated — it helps me share more setups with the community!”
🏷️ Hashtags
#Palladium #XPDUSD #Trading #Metals #SwingTrading #TechnicalAnalysis #Ichimoku #Kijun #ThiefStrategy #TradingSetup #ToTheMoon #Profit
Xpdusdsignals

“Palladium Double Bottom Thief Plan – Will $XPDUSD Steal 1350?”📝 TradingView Description (Thief Style, Polished, Stylish, Funny-Pro Vibe)
Asset: XPD/USD “Palladium vs U.S Dollar”
Market Map: Forex Metals – Swing/Day Trade Strategy
📊 Plan – Thief Strategy in Action
The bullish plan is confirmed with:
✅ Double bottom pullback & retest
✅ Triangular moving average support
✅ Heikin Ashi reversal doji candle formed
✅ Re-accumulation at the neutral zone
This looks like Palladium is warming up for a climb!
🎯 Entry – Thief Layer Style
Instead of a single entry, I use layered buy limits (multiple limit orders):
💎 1240
💎 1250
💎 1260
💎 1270
(Traders can adjust/increase layers based on their own style.)
🛡 Stop Loss (SL) – Thief’s Guard Line
My SL idea → 1200
👉 But remember: It’s your account, your rules. Choose your own risk shield.
🎯 Target – Thief’s Escape Point
Main target: 1350
Strong resistance barricade around 1400 → could act as a police trap zone (overbought + liquidity zone).
📌 Best play: Escape with profits before the barricade!
🔑 Key Notes to the OG’s
Dear Ladies & Gentleman (Thief OG’s), this isn’t about following my SL or TP blindly.
Trading is risk. Manage it your way → take money, then make money.
🔄 Related Correlation Watchlist
Keep an eye on metals & correlated assets for cross-check confirmation:
OANDA:XAUUSD (Gold) – often leads sentiment in precious metals
OANDA:XAGUSD (Silver) – momentum clues for XPD
OANDA:XPTUSD (Platinum) – strong structural correlation with Palladium
TVC:DXY (U.S Dollar Index) – dollar strength/weakness directly impacts Palladium
✨ “If you find value in my analysis, a 👍 and 🚀 boost is much appreciated — it helps me share more setups with the community!”
⚠️ Disclaimer: This is a Thief Style trading strategy just for fun & educational purposes. Not financial advice. Trade at your own risk.
#XPDUSD #Palladium #Forex #Metals #TradingStrategy #SwingTrade #DayTrade #Gold #Silver #Platinum #DollarIndex #ThiefStrategy

XPDUSD Long AnalysisPalladium has shifted from a mid-August downtrend into a choppy recovery and now shows signs of a trending bullish phase on the 4-hour timeframe. Price has cleared short-term resistance around 1,176.87 → 1,246.75 and is currently trading ~1,237 (your chart). The moving averages have flattened then begun to slope upward, and the most recent swing shows a higher low / higher high rhythm — the basic condition you want for a bullish continuation.
The chart’s annotated zones show a clear supply band around 1,246.7 (nearby resistance) and a higher upside magnet around 1,366.84 (your marked major target). That gives a visible path for an upside trade with a defined invalidation area below recent demand.
Why bulls have the edge now:
• Price is back above the shorter MAs and testing the prior supply band — buyers have absorbed previous selling.
• The 4H swing structure: recent higher lows vs earlier lows (buyers defending lower levels).
• Momentum in the last push is relatively clean (no long upper wick exhaustion) — the move is controlled, not a spike.
Important macro/contextual notes (trade-sensitivity):
• Palladium is sensitive to industrial/catalytic demand and to USD strength; watch auto demand news and USD moves.
• Palladium can gap on low liquidity and on supply/disruption headlines — plan for slippage around big events.
________________________________________
Key levels to respect (copy/paste friendly)
• Current price (approx): 1,237.11
• Immediate resistance (short-term supply): 1,246.75
• Primary support (near-term demand / pullback buy zone): 1,176.87
• Major upside target / magnet: 1,366.84
• Deeper support (if bulls fail): lower dotted green levels on your chart (≈ 1,100–1,050 area historically)
A clean 4H close above 1,246.75 removes local supply pressure and is the simplest technical confirmation for the next leg up toward 1,366.84. Conversely, a decisive 4H close back below 1,176.87 would invalidate this bullish plan and suggest re-evaluation.
________________________________________
Trade risk plan & management (rules you should follow)
• Position sizing: size so the dollar risk to your stop equals 1–2% of account equity. That keeps any single loss manageable.
• Partial profits: take 30–40% at the first meaningful resistance on the way up (see trade setups below). This locks gains while leaving a runner for the bigger target.
• Stop management: after a first partial is taken, move your stop to breakeven (or a small profit) to make the remainder risk-free. Then trail the stop under each new 4H higher low (or use a volatility trail like 1.5×ATR(20,4H)) to give the trade room while protecting gains.
• Event risk: reduce size or avoid adding right before major macro/industry events that can move metals (e.g., major US data, central bank windows, supply/disruption news).
• Plan for slippage: Palladium can gap — factor realistic slippage and wider fills into your sizing and stop placement.
• Fail scenario: if price closes below 1,176.87 on 4H, exit and wait for a new structure to form.
________________________________________
Trade setups (bullets only)
A) Breakout (higher-probability, confirmation entry)
• Entry: buy after a confirmed 4H close above 1,246.75, or on the retest of 1,246.75 after that close (better risk control).
• Stop-loss: 1,200 (below the breakout zone and recent short-term structure).
• Take Profit 1: 1,320 → take 30–40% off.
• Take Profit 2: 1,366.84 → scale out remaining position (trail remaining).
• Sizing tip: risk 1% of equity to the stop for the full position.
________________________________________
Execution checklist (quick)
1. Confirm no major data/event in the next 4-12 hours (if you’re entering short term).
2. Prefer a 4H close above 1,246.75 for the breakout plan, or a clear price action buy signal in 1,200–1,176.87 for the pullback plan.
3. Place stop and position size to risk 1–2% max.
4. Book partials at TP1, move stop to breakeven, then trail using 4H higher lows or 1.5×ATR.
5. If the market closes 4H below 1,176.87, exit and reassess.
________________________________________
Final takeaway
Technically this is a bullish, controlled setup: structure shows buyers defending lower levels and the path to ~1,367 is clear if price can hold above local demand and overcome the short supply band at 1,246.7. Use disciplined sizing, partial profit-taking at intermediate resistance, and an active trailing stop to protect gains — that combination gives you upside capture while controlling downside risk.

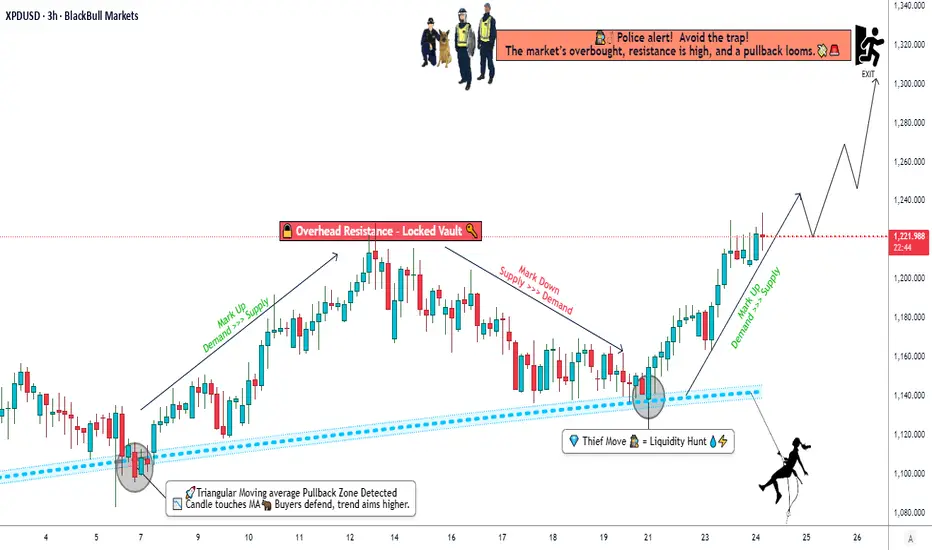
Palladium Market Roadmap | Bullish Case vs Overbought Resistance💎 XPD/USD | Palladium vs U.S Dollar – Market Wealth Strategy Map (Swing/Day Trade)
📊 Plan:
Bullish confirmation looks solid here — backed by Triangular Moving Average pullback + retest ✅ and a Double Bottom formation 🥂 which adds strength to buyers’ side.
I’m laying out my Thief Strategy (Layering Style Entry Method):
Entry is not fixed at a single point 🎯 — instead, I prefer layering multiple limit orders to build positions gradually.
👉 Example Buy Limit Layers:
1180
1190
1200
1220
(You can increase or adjust layers based on your own conviction.)
🛡️ Stop Loss (SL):
📍 My reference SL: 1150
(Note: I’m not recommending you only follow my SL. Always set risk at your comfort level. Manage wisely!)
🎯 Target (TP):
⚠️ “Police barricade” 🚔 acts as strong resistance + overbought conditions → possible bull trap.
My target zone: 1320
(Again, this is just my style. Take profits when it suits your strategy — protect your gains!)
🔗 Related Pairs to Watch:
OANDA:XPTUSD (Platinum vs USD) → Often moves with Palladium due to industrial/auto demand links 🚗
OANDA:XAUUSD (Gold vs USD) → Precious metals correlation, safe-haven appeal 🏆
OANDA:XAGUSD (Silver vs USD) → Volatility cousin, tends to echo similar swings ⚡
PEPPERSTONE:USDX (Dollar Index) → Strong USD can weigh on metals overall 💵
Key Correlation Insight:
Palladium is more industrial-demand driven compared to gold/silver. When auto-sector demand spikes, palladium shines 🌟, but when USD strengthens or risk-off flows dominate, metals may face pressure.
✨ “If you find value in my analysis, a 👍 and 🚀 boost is much appreciated — it helps me share more setups with the community!”
⚠️ Disclaimer:
This is a Thief Style Trading Strategy created for educational + fun purposes only. Not financial advice. Trade at your own risk.
#Palladium #XPDUSD #MetalsTrading #SwingTrade #DayTrade #ThiefStrategy #LayeringStrategy #MarketAnalysis #PreciousMetals
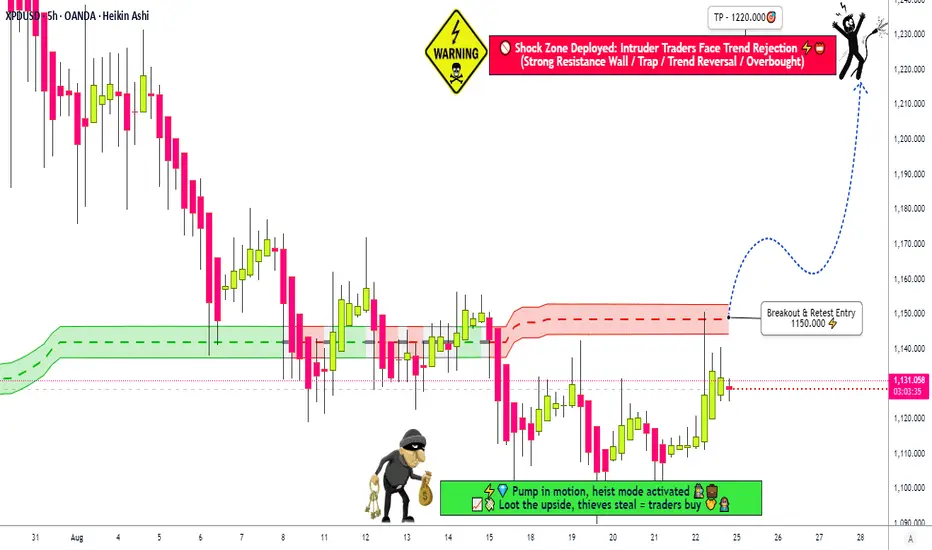
XPD/USD Market Strike – Bullish Pending Heist with Layer Entry⚡💎 XPD/USD "Palladium" Metal Market Heist Plan 💎⚡
🕵️♂️ Dear Thief OG’s, Robbers & Money Raiders…
The vault is open — Palladium is shining, and we’re about to strike.
📊 Asset: XPD/USD "Palladium" (Swing/Scalping Trade)
💡 Plan: Bullish (Pending Order Heist)
🎯 Entry (The Break-in Point)
💥 Primary Breakout Level: 1150.000 ⚡
Thieves don’t walk in one door — we layer the entries.
Multiple buy limit orders stacked like weapons:
1150.000 (confirmed breakout entry 🚀)
1140.000
1130.000
1120.000
👉 You can add more layers based on your vault-robbing capacity.
📌 Set your TradingView alarm at 1150.000 — so you don’t miss the breakout spark that opens the gates.
🛑 Stop Loss (The Escape Route)
This is Thief SL @ 1090.000 (after breakout confirm).
Adjust your SL depending on your own robbery style & risk.
Dear Ladies & Gentlemen of the Thief Gang — protect your loot wisely.
🏆 Target (The Stolen Gold)
⚡ High Voltage shock zone @ 1230.000 — don’t get fried!
🎯 Secure your loot & escape before the guards catch you at 1220.000.
📌 Thief Notes
This robbery isn’t one shot — it’s layering strategy style: stacking orders at different levels for maximum haul.
Scalpers can ride the quick waves 🌊, Swing traders hold for the vault explosion 💣.
Trail your SL to protect the stolen bags 💼💰.
💖 Support the gang! Smash the Boost Button and let’s keep robbing markets together.
Thieves never sleep… Stay sharp, alarms ON, and hands ready to snatch profits! 🕵️♂️💎🚀
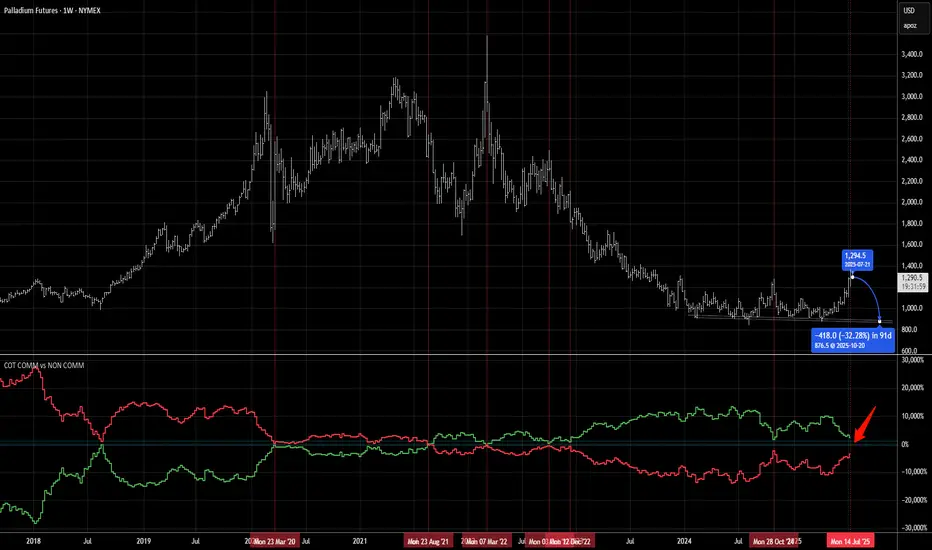
PALLADIUM Sell pressure below its 1W MA200.Palladium (XPDUSD) has been trading within a long-term Channel Up that priced its last Higher High on the week of July 14. Despite this week's very aggressive spike, the trend remains bearish as long as the 1W MA200 (orange trend-line) holds, and this is one more sell opportunity offered.
We expect a similar decline with the previous Bearish Leg that fell all the way to the 0.786 Fibonacci extension. This is translated to a 980.00 Target.
-------------------------------------------------------------------------------
** Please LIKE 👍, FOLLOW ✅, SHARE 🙌 and COMMENT ✍ if you enjoy this idea! Also share your ideas and charts in the comments section below! This is best way to keep it relevant, support us, keep the content here free and allow the idea to reach as many people as possible. **
-------------------------------------------------------------------------------
💸💸💸💸💸💸
👇 👇 👇 👇 👇 👇

Palladium Market Alert! Strong ATR Resistance Ahead @ 1190🚨 XPD/USD (Palladium) Market Heist Plan: Bullish Swing/DAY Trade Strategy 🚨
Ladies & Gentlemen, Thief OG's! 👑💎 The charts are signaling a potential heist opportunity. Here's the plan to target a move toward $1190. Remember, this is my plan; you are the master thief of your own capital. Adjust, execute, and escape with your profits on your own terms.
🎯 The Heist Plan (Technical Setup)
Asset: XPDUSD | Palladium vs US Dollar
Direction: BULLISH 🐂
Entry Method: Thief's Layering Strategy 🎰
Use multiple BUY limit orders to layer into the position as price dips.
Suggested Layers: $1150, $1145, $1140, $1135, $1130
(Increase or decrease layers based on your capital & risk appetite)
Stop Loss (Escape Hatch): $1120
This is the Thief's OG SL. Adjust your own escape hatch based on your strategy!
Target (Escape Point): $1190 🎯
Why here? Strong ATR resistance + potential overbought zone + the "police barricade" (key resistance). Take your stolen money and run!
⚠️ Crucial Note: This is not financial advice. Your money, your rules. I am not liable for your trades. Manage your own risk.
🔍 Why This Heist? The Intel Report (Fundamental & Sentiment)
Current Price Intel (10 Sept 2025):
💰 Live Price: ~$1,129
📉 Daily Change: -3.46% (Sale is ON!)
Market Sentiment & Psychology:
😊😟 Retail Sentiment: 52% Long | 48% Short
🏦 Institutional Sentiment: 58% Long | 58% Bullish | 42% Short
⚖️ Fear & Greed Index: 50 (Neutral) - No extreme emotions; perfect for a calm, calculated heist.
Fundamental Score (60/100): 🔍
🚗 Strong Automotive Demand: 80% of Palladium use is in catalytic converters.
🌍 Supply Constraints: Ongoing issues from major producers (Russia/South Africa).
⚡️ Counterpoint: Long-term risk from EV adoption reducing demand.
Macro Score (55/100): 🌐
💵 Weak USD: A weaker dollar supports dollar-denominated commodities like Palladium.
⚠️ Risks: Trade tariffs and potential cuts to EV subsidies could impact auto sector demand.
🎯 Overall Outlook: Neutral with a Slight Bullish Bias. The supply-demand dynamics are resilient, creating a potential bounce play from current levels.
👀 Related Assets to Watch ($)
XPTUSD (Platinum) - Sister metal, often correlated.
XAUUSD (Gold) - Safe-haven flow indicator.
USDINDEX (DXY) - Inverse relationship; weaker DXY = stronger commodities.
GM (General Motors), F (Ford) - Auto sector health.
✨ “If you find value in my analysis, a 👍 and 🚀 boost is much appreciated — it helps me share more setups with the community!”
#Palladium #XPDUSD #TradingPlan #SwingTrading #DayTrading #Commodities #MetalsTrading #Bullish #Investing #TradingSignals #MarketHeist

"BEARISH PALLADIUM HEIST: TIME TO STEAL PROFITS?"🚨 XPD/USD "PALLADIUM HEIST" (BEARISH RAID EDITION) 🚓💰
⚠️ ATTENTION ALL BLACK-MARKET TRADERS, PROFESSIONAL THIEVES & RISK TAKERS! ⚠️
(Hola! Bonjour! Hallo! Marhaba!)
🔥 THE GREAT PALLADIUM DUMP IS ON! 🔥
Based on our 🦹♂️ Thief Trading Intel, we’re executing a BEARISH LAYERED HEIST on XPD/USD (Palladium). This is a high-risk, high-speed robbery—perfect for scalpers, swing bandits, and market fugitives!
🎯 HEIST STRATEGY (SHORT ENTRY PLAN)
🚨 ANY PRICE ENTRY – THIEF LAYERED LIMIT ORDERS! 🚨
Entry Zones (Flexible – Adjust Your Heist Layers!):
1st Layer: 1135.00 (Sneaky early entry)
2nd Layer: 1140.00 (Confidence booster)
3rd Layer: 1150.00 (Aggressive ambush)
(Add more layers if you’re a risk-loving outlaw!)
Pro Thief Move: Use multiple limit orders to scale in like a silent assassin—don’t rush, let the market come to YOU!
🛑 STOP LOSS (DON’T GET BUSTED!)
This is Thief SL @ 1180.00 (OGs know to adjust based on their own risk appetite!)
⚠️ WARNING: If price breaches 1180.00, ABORT MISSION! (Cops are waiting there!)
🎯 PROFIT TARGETS (LOOT & VANISH!)
1st Escape: 1080.00 (Quick cash grab before police arrive!)
Full Heist Target: 1060.00 (Major police barricade—escape before this!)
Scalpers: Take partial profits early & trail the rest like a true fugitive!
📉 FUNDAMENTAL BACKUP (WHY THIS DUMP WILL WORK)
📉 Weak industrial demand (Auto sector slowdown!)
💸 Strong USD pressure (Metals getting crushed!)
🛑 Supply gluts incoming! (More palladium = lower prices!)
🔗 Check COT reports, macro trends & news before raiding!
⚠️ WARNING: VOLATILITY TRAPS & POLICE BARRICADES!
Avoid high-impact news (CPI, FOMC, NFP)—cops set traps during these times!
Use trailing stops to protect stolen profits from sudden reversals!
💥 BOOST THIS HEIST! 💥
👍 Like & 🔄 Share to strengthen our criminal trading syndicate! More heists = More profits! 🚀💰
🚨 NEXT HEIST COMING SOON… STAY ON THE RUN! 🚨
📌 DISCLAIMER: This is NOT financial advice—trade at your own risk! Only steal what you can afford to lose! 😈🔥
#Palladium #XPDUSD #Commodities #TradingView #Bearish #ThiefTrading #RiskReward #MarketHeist
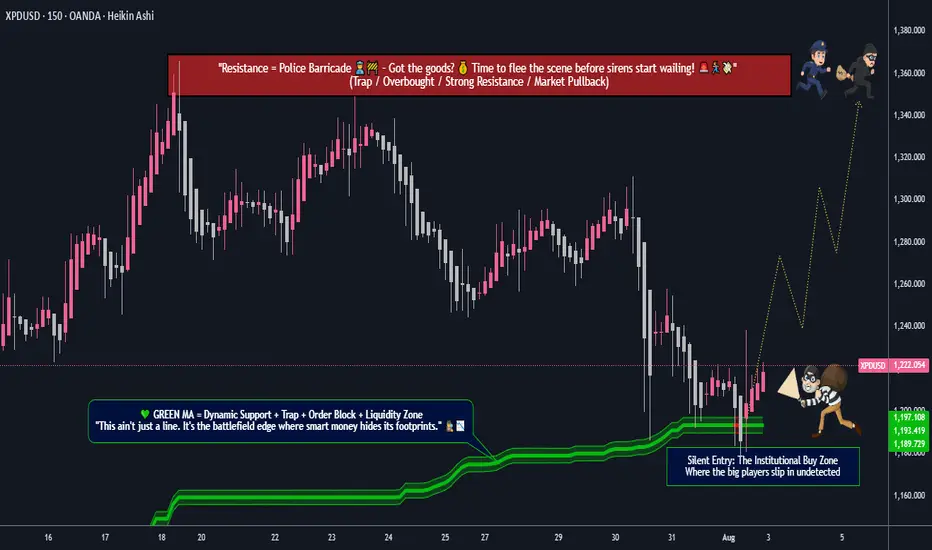
XPD/USD Vault Breach: Long Entry Metal Heist Strategy🔐 "Palladium Vault Breach: XPD/USD Bullish Metal Heist Plan" 💼💸
🌍 Greetings to All Market Hustlers, Robbers & Risk-Takers! 🌟
Time to tap into XPD/USD - Palladium, one of the most volatile and opportunistic metals on the board.
Based on the Thief Trading Blueprint — forged from technical precision and fundamental foresight — this setup outlines a strategic metal market robbery with targets marked and exits planned.
This heist plan is NOT for the faint-hearted. It’s designed for traders who want to rob the market clean — fast or smooth, swing or scalp, your call.
🔑 ENTRY POINTS — The Vault is Open!
📌 Initiate Long Positions anywhere near current levels.
For tactical precision, layer Buy Limit orders using a pullback zone strategy on the 15min to 30min chart, around recent swing highs/lows. This improves risk-adjusted entries. We’re using the layering method — multiple orders placed like silent drills breaching the vault.
🛑 STOP LOSS — Cover the Escape Route
📍 Set your Stop Loss below the recent 4H swing low, around 1160.000.
Adjust SL based on lot size and the number of entries layered in. The key is to survive the shakeout, not just chase the breakout.
🎯 TARGET — Grab the Bag and Exit Clean
🏁 Primary Target: 1360.000
But remember: Always escape before the police set up barricades at resistance. That’s where heavy sellers and bearish robbers defend their turf. Use trailing stops to lock in gains and avoid getting caught in reversals.
💥 TRADE MODE — Pick Your Role:
Scalpers: Only long side. Stick to momentum plays.
Swing Traders: Join the full operation and ride the bullish wave.
Use trailing SL as a smart shield.
📊 MARKET CONTEXT — Why This Heist Works
🧠 The setup is powered by a mix of:
Macro-Economic Conditions
Intermarket Metal Correlations
Sentiment Shifts and Risk-On Bias
Supply Constraints & Demand Revival
Geopolitical Hotspots Driving Precious Metal Interest
COT & Institutional Positioning Insights
These dynamics are creating a sweet spot for a high-probability bullish breakout, aligning perfectly with our Thief Trading style.
🚨 RISK ZONES — Stay Sharp!
⚠️ Be cautious near major news releases or data events. These are trap zones where the market plays dirty.
Avoid fresh entries near high-impact data
Manage existing positions with trailing SL
Re-assess if market structure flips
🎯 STRATEGIC THOUGHTS
This is not just a trade. It’s a robbery plan backed by logic, discipline, and sniper-level entry techniques. Markets are wild — rob them before they rob you.
No greed. No fear. Just clean execution.
🚀 Thief Trading Style = Outsmart the crowd. Outrun the reversal.
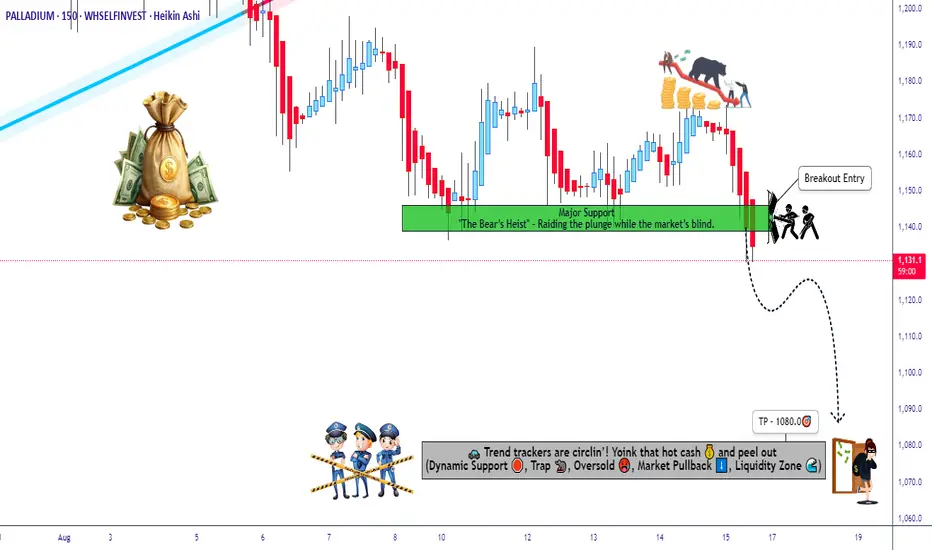
Palladium Crash Incoming; 30%+ Drop ExpectedPalladium is indeed a very small market and hence exhibits very unique and highly predictable COT patterns. When the producers begin to heavily sell after large price rallies, XPD is destined for a fall back down into its intermediate term supply/demand zone. Which in this case represents the $850-$900 range. So a nice 30%+ down swing over the course of several months can be predicted based on previous builds in the NYMEX COT report.
There is absolutely ZERO material reason for the PGMs to have staged such a large rally these last few months other then as a liquidity fueled move coupled with massive price divergence with gold. The PGM market could not have worse demand fundamentals, especially for Palladium which is mostly used for automotive use as catalytic converters in gasoline powered vehicles (ICE). With the largest customer of the metal being China who is in a secular economic slowdown, then the US/EU where vehicle prices have exploded. The market is well supplied especially as EVs take over in dominance across Asia and emerging more in western markets which require no such catalytic functions.
Market Call: We are scaling into short positions on XPD anticipating a market convergence back to its normally supplied price level of $875/oz.
"Stealing Profits: XPD/USD Long Setup (Risk-Reward Heist)"🚨 XPD/USD "Palladium" Metal Market Heist Alert: The Bullish Breakout Robbery Plan (Swing & Scalp Strategy) 🚨
🌟 Hi! Hola! Ola! Bonjour! Hallo! Marhaba! 🌟
Attention Money Makers & Market Robbers! 🤑💰💸
Based on the 🔥Thief Trading Style🔥, here’s our master plan to loot the XPD/USD "Palladium" Metal Market. Follow the strategy on the chart—focusing on LONG entries—and escape near the high-risk Red Zone. This area is overbought, consolidating, and a potential reversal trap where bears lurk. 🏆 Take profits fast—you’ve earned it! 💪
🎯 Heist Entries:
📈 Entry 1: "The Breakout Heist!" – Wait for Resistance (1,100.000) to break, then strike! Bullish profits await.
📈 Entry 2: "Big Players’ Pullback!" – Jump in at 1,1030.000+ buy above at any price for a safer steal.
🔔 Pro Tip: Set a chart alert to catch the breakout instantly!
🛑 Stop Loss Rules:
*"Yo, listen! 🗣️ If you’re entering with a buy-stop (or) limit orders in pullbacks, DON’T set your SL until AFTER the breakout. Place it at the nearest swing low (4H timeframe) or wherever your risk allows—but remember, rebels risk more! 🔥"*
🏴☠️ Target: 1,160.000
🧲 Scalpers: Only play LONG! Use trailing SL to lock in profits. Big wallets? Go all in. Small stacks? Join the swing heist!
📊 Market Pulse:
The XPD/USD "Palladium" is neutral but primed for bullish momentum. Watch:
Fundamentals (COT, Macro, Geopolitics)
Sentiment & Intermarket Trends
Positioning & Future Targets & Overall score
📌 Check our bioo linkks for deep analysis! 🔗🌍
⚠️ Trading Alert:
News = Volatility! Protect your loot:
Avoid new trades during major news
Use trailing stops to secure profits
💥 Boost This Heist!
Hit 👍 & 🔄 to strengthen our robbery crew! Let’s dominate the market daily with the Thief Trading Style. 🚀💵
Stay tuned—another heist drops soon! 🎯🐱👤

XPD/USD "Palladium" Metal Market Heist Plan (Swing/Day Trade)🌟Hi! Hola! Ola! Bonjour! Hallo! Marhaba!🌟
Dear Money Makers & Robbers, 🤑 💰💸✈️
Based on 🔥Thief Trading style technical and fundamental analysis🔥, here is our master plan to heist the XPD/USD "Palladium" Metal Market. Please adhere to the strategy I've outlined in the chart, which emphasizes long entry. Our aim is the high-risk Red zone area. It's a Risky level, overbought market, consolidation, trend reversal, trap at the level where traders and bearish robbers are stronger. 🏆💸"Take profit and treat yourself, traders. You deserve it!💪🏆🎉
Entry 📈 : "The heist is on! Wait for the MA breakout (960) then make your move - Bullish profits await!"
however I advise to Place Buy stop orders above the Moving average (or) Place buy limit orders within a 15 or 30 minute timeframe most recent or swing, low or high level for Pullback entries.
📌I strongly advise you to set an "alert (Alarm)" on your chart so you can see when the breakout entry occurs.
Stop Loss 🛑: "🔊 Yo, listen up! 🗣️ If you're lookin' to get in on a buy stop order, don't even think about settin' that stop loss till after the breakout 🚀. You feel me? Now, if you're smart, you'll place that stop loss where I told you to 📍, but if you're a rebel, you can put it wherever you like 🤪 - just don't say I didn't warn you ⚠️. You're playin' with fire 🔥, and it's your risk, not mine 👊."
📍 Thief SL placed at the nearest/swing low level Using the 4H timeframe (927) Day / Swing trade basis.
📍 SL is based on your risk of the trade, lot size and how many multiple orders you have to take.
🏴☠️Target 🎯: 1010 (or) Escape Before the Target
🧲Scalpers, take note 👀 : only scalp on the Long side. If you have a lot of money, you can go straight away; if not, you can join swing traders and carry out the robbery plan. Use trailing SL to safeguard your money 💰.
💰💵💸XPD/USD "Palladium" Metal Market Heist Plan (Swing/Day Trade) is currently experiencing a Bullish trend.., driven by several key factors.☝☝☝
📰🗞️Get & Read the Fundamental, Macro Economics, COT Report, Geopolitical and News Analysis, Sentimental Outlook, Intermarket Analysis, Supply and Demand Factors, Future trend targets with Overall outlook score... go ahead to check 👉👉👉🔗🔗
⚠️Trading Alert : News Releases and Position Management 📰 🗞️ 🚫🚏
As a reminder, news releases can have a significant impact on market prices and volatility. To minimize potential losses and protect your running positions,
we recommend the following:
Avoid taking new trades during news releases
Use trailing stop-loss orders to protect your running positions and lock in profits
💖Supporting our robbery plan 💥Hit the Boost Button💥 will enable us to effortlessly make and steal money 💰💵. Boost the strength of our robbery team. Every day in this market make money with ease by using the Thief Trading Style.🏆💪🤝❤️🎉🚀
I'll see you soon with another heist plan, so stay tuned 🤑🐱👤🤗🤩

XPD/Palladium Profit Raid: Steal Gains with This Blueprint!🔥 Chart Heist Blueprint: Snag Profits in XPD/Palladium! 🚀💰
Crafted for sharp traders ready to raid the XPD/Palladium market, this sleek strategy fuses razor-sharp technicals with savvy fundamentals to maximize your gains. 📊🕵️♂️ Surf the bullish surge, but watch for traps in the White Moving Average Zone where bears could strike! 🐻 Lock in your loot before the tide turns. 🌊
- 🎯 **Entry Tactics: Hit the Sweet Spot**
- Long on pullbacks near 1020.00 or the Market Makers Zone at 980.00. 🏹
- Set alerts for breakouts or pullbacks to strike in real-time. 🔔
- 🛡️ **Stop Loss Hacks: Guard Your Gains**
- Place stops below the nearest 4-hour swing low or candle wick. 🔧
- Tailor stops to your risk and lot size—precision over recklessness! ⚡
- 💸 **Profit Goals: Cash In Big**
- Bullish traders aim for 1070.00 or exit early if momentum dips. 📈
- Scalpers focus on long-side quick wins, trailing stops behind big players. 🚀
- 📡 **Market Edge: Why This Plan Wins**
- XPD/Palladium is charging bullish, driven by COT data, macro shifts, sentiment outlook, and intermarket flows. 🔍
- Check the linkss for deeper insights. 🌐
- ⚠️ **News Alert: Dodge the Chaos**
- Skip new trades during major news releases. 📰
- Use trailing stops to secure profits on active trades. 🔒
- 🤝 **Join the Profit Crew**
- Boost this plan, share the vibe, and let’s raid the markets together! 🤑
- Stay sharp for the next big score in the XPD/Palladium heist! 💥
Happy trading, chart bandits! 🎭📉

XPD/USD "Palladium" Metals Market Bull Heist Plan (Swing Trade)🌟Hi! Hola! Ola! Bonjour! Hallo! Marhaba!🌟
Dear Money Makers & Robbers, 🤑 💰💸✈️
Based on 🔥Thief Trading style technical and fundamental analysis🔥, here is our master plan to heist the XPD/USD "Palladium" Metals Market. Please adhere to the strategy I've outlined in the chart, which emphasizes long entry. Our aim is to escape near the high-risk ATR Zone. Risky level, overbought market, consolidation, trend reversal, trap at the level where traders and bearish robbers are stronger. 🏆💸"Take profit and treat yourself, traders. You deserve it!💪🏆🎉
Entry 📈 : "The vault is wide open! Swipe the Bullish loot at any price - the heist is on!
however I advise to Place buy limit orders within a 15 or 30 minute timeframe most recent or swing, low or high level for Pullback entries.
Stop Loss 🛑:
📍 Thief SL placed at the recent/swing low level Using the 4H timeframe (930.000) Day trade basis.
📍 SL is based on your risk of the trade, lot size and how many multiple orders you have to take.
🏴☠️Target 🎯: 1020.000 (or) Escape Before the Target
🧲Scalpers, take note 👀 : only scalp on the Long side. If you have a lot of money, you can go straight away; if not, you can join swing traders and carry out the robbery plan. Use trailing SL to safeguard your money 💰.
💰💵💴💸XPD/USD "Palladium" Metals Market Heist Plan (Day / Swing Trade) is currently experiencing a bullishness🐂.., driven by several key factors.👆👆👆
📰🗞️Get & Read the Fundamental, Macro Economics, COT Report, Geopolitical and News Analysis, Sentimental Outlook, Intermarket Analysis, Supply and Demand Factors, Future trend targets with Overall outlook score... go ahead to check👉👉👉🔗🔗🌎🌏🗺
⚠️Trading Alert : News Releases and Position Management 📰 🗞️ 🚫🚏
As a reminder, news releases can have a significant impact on market prices and volatility. To minimize potential losses and protect your running positions,
we recommend the following:
Avoid taking new trades during news releases
Use trailing stop-loss orders to protect your running positions and lock in profits
💖Supporting our robbery plan 💥Hit the Boost Button💥 will enable us to effortlessly make and steal money 💰💵. Boost the strength of our robbery team. Every day in this market make money with ease by using the Thief Trading Style.🏆💪🤝❤️🎉🚀
I'll see you soon with another heist plan, so stay tuned 🤑🐱👤🤗🤩

XPD/USD "The Palladium" Metal Market Heist Plan (Swing/Day)🌟Hi! Hola! Ola! Bonjour! Hallo! Marhaba!🌟
Dear Money Makers & Robbers, 🤑💰✈️
Based on 🔥Thief Trading style technical and fundamental analysis🔥, here is our master plan to heist the XPD/USD "Palladium" Metal Market. Please adhere to the strategy I've outlined in the chart, which emphasizes short entry. Our aim is the high-risk Yellow ATR Zone. Risky level, oversold market, consolidation, trend reversal, trap at the level where traders and bullish robbers are stronger. 🏆💸"Take profit and treat yourself, traders. You deserve it!💪🏆🎉
Entry 📈 : "The vault is wide open! Swipe the Bearish loot at any price - the heist is on!
however I advise to Place sell limit orders within a 15 or 30 minute timeframe most nearest or swing, low or high level for Pullback Entries.
Stop Loss 🛑:
📌Thief SL placed at the nearest/swing High or Low level Using the 8H timeframe (950.000) Day/Swing trade basis.
📌SL is based on your risk of the trade, lot size and how many multiple orders you have to take.
Target 🎯: 800.000 (or) Escape Before the Target
⚙💿XPD/USD "Palladium" Metal Market Heist Plan (Swing/Day Trade) is currently experiencing a Neutral trend (there is a chance to move bearishness),., driven by several key factors.👇👇👇
📰🗞️Get & Read the Fundamental, Macro, COT Report, Quantitative Analysis, Sentimental Outlook, Intermarket Analysis, Future trend targets.. go ahead to check 👉👉👉🔗
Detailed Explanation ✍️
Fundamental Analysis 📊: Balances all factors, showing fragility at 900.000 ⚖️.
Macroeconomic 🌐: Slowdown 📉 and USD strength 💪 suppress prices.
Geopolitical ⚔️: Supply risks muted 🕊️, stabilizing levels.
Supply/Demand ⚖️: EV demand drop 🔋 outweighs supply issues ⛏️.
Technical 📈: 900.000 pivotal—support holds 🏞️, momentum flat 🚫.
Sentiment 😊: Cautious traders, no strong bias 🤷♂️.
Seasonal 🍂: Q2 softness reinforces price 📉.
Intermarket 🔗: Lags gold/platinum 🥇💿, tied to USD/equities 💵📉.
Market Sentiment 👥: Mixed, tepid across groups 😐.
Trend Prediction 🔮: Long-term bearish 📉 with short-term swings 🎢.
Outlook 🌟: Neutral now ⚖️, trending bearish 📉 unless disrupted ⚡.
⚠️Trading Alert : News Releases and Position Management 📰 🗞️ 🚫🚏
As a reminder, news releases can have a significant impact on market prices and volatility. To minimize potential losses and protect your running positions,
we recommend the following:
Avoid taking new trades during news releases
Use trailing stop-loss orders to protect your running positions and lock in profits
💖Supporting our robbery plan 💥Hit the Boost Button💥 will enable us to effortlessly make and steal money 💰💵. Boost the strength of our robbery team. Every day in this market make money with ease by using the Thief Trading Style.🏆💪🤝❤️🎉🚀
I'll see you soon with another heist plan, so stay tuned 🤑🐱👤🤗🤩

XPD/USD "The Palladium" Metal Market Heist Plan (Swing / Day)🌟Hi! Hola! Ola! Bonjour! Hallo! Marhaba!🌟
Dear Money Makers & Robbers, 🤑💰💸✈️
Based on 🔥Thief Trading style technical and fundamental analysis🔥, here is our master plan to heist the XPD/USD "The Palladium" Metal Market. Please adhere to the strategy I've outlined in the chart, which emphasizes long entry. Our aim is the high-risk Red Zone. Risky level, overbought market, consolidation, trend reversal, trap at the level where traders and bearish robbers are stronger. 🏆💸"Take profit and treat yourself, traders. You deserve it!💪🏆🎉
Entry 📈 : "The heist is on! Wait for the MA breakout (990.000) then make your move - Bullish profits await!"
however I advise to Place Buy stop orders above the Moving average (or) Place buy limit orders within a 15 or 30 minute timeframe most recent or swing, low or high level.
📌I strongly advise you to set an "alert (Alarm)" on your chart so you can see when the breakout entry occurs.
Stop Loss 🛑:
Thief SL placed at the recent/swing low level Using the 3H timeframe (950.000) Day / swing trade basis.
SL is based on your risk of the trade, lot size and how many multiple orders you have to take.
🏴☠️Target 🎯: 1050.000 (or) Escape Before the Target
🧲Scalpers, take note 👀 : only scalp on the Long side. If you have a lot of money, you can go straight away; if not, you can join swing traders and carry out the robbery plan. Use trailing SL to safeguard your money 💰.
XPD/USD "The Palladium" Metal Market Heist Plan (Day / Swing Trade) is currently experiencing a bullishness,., driven by several key factors.
📰🗞️Get & Read the Fundamental analysis, Macro Economics, COT Report, Seasonal factors, Sentimental Outlook, Positioning and future trend..... go ahead to check 👉👉👉🔗
⚠️Trading Alert : News Releases and Position Management 📰 🗞️ 🚫🚏
As a reminder, news releases can have a significant impact on market prices and volatility. To minimize potential losses and protect your running positions,
we recommend the following:
Avoid taking new trades during news releases
Use trailing stop-loss orders to protect your running positions and lock in profits
💖Supporting our robbery plan 💥Hit the Boost Button💥 will enable us to effortlessly make and steal money 💰💵. Boost the strength of our robbery team. Every day in this market make money with ease by using the Thief Trading Style.🏆💪🤝❤️🎉🚀
I'll see you soon with another heist plan, so stay tuned 🤑🐱👤🤗🤩

XPD/USD "The Palladium" Metals Market Heist Plan🌟Hi! Hola! Ola! Bonjour! Hallo! Marhaba!🌟
Dear Money Makers & Robbers, 🤑 💰💸✈️
Based on 🔥Thief Trading style technical and fundamental analysis🔥, here is our master plan to heist the XPD/USD "The Palladium" Metals market. Please adhere to the strategy I've outlined in the chart, which emphasizes long entry. Our aim is the high-risk Red Zone. Risky level, overbought market, consolidation, trend reversal, trap at the level where traders and bearish robbers are stronger. 🏆💸Book Profits Be wealthy and safe trade.💪🏆🎉
Entry 📈 : "The heist is on! Buy above (960.00) then make your move - Bullish profits await!"
however I advise to placing the Buy Stop Orders above the breakout Level (or) placing the Buy limit orders within a 15 or 30 minute timeframe, Entry from the most Recent or Swing low or high level should be in retest.
Stop Loss 🛑:
Thief SL placed at the recent / nearest low level Using the 4H timeframe (930.00) swing trade basis.
SL is based on your risk of the trade, lot size and how many multiple orders you have to take.
Target 🎯: 1010.00 (or) Escape Before the Target
🧲Scalpers, take note 👀 : only scalp on the Long side. If you have a lot of money, you can go straight away; if not, you can join swing traders and carry out the robbery plan. Use trailing SL to safeguard your money 💰.
XPD/USD "The Palladium" Metals Market is currently experiencing a bullish trend,., driven by several key factors.
📰🗞️Read the Fundamental, Macro Economics, COT Report, Seasonal Factors, Intermarket Analysis, Sentimental Outlook, Future trend predict.
Before start the heist plan read it.👉👉👉
📌Keep in mind that these factors can change rapidly, and it's essential to stay up-to-date with market developments and adjust your analysis accordingly.
⚠️Trading Alert : News Releases and Position Management 📰 🗞️ 🚫🚏
As a reminder, news releases can have a significant impact on market prices and volatility. To minimize potential losses and protect your running positions,
we recommend the following:
Avoid taking new trades during news releases
Use trailing stop-loss orders to protect your running positions and lock in profits
💖Supporting our robbery plan 💥Hit the Boost Button💥 will enable us to effortlessly make and steal money 💰💵. Boost the strength of our robbery team. Every day in this market make money with ease by using the Thief Trading Style.🏆💪🤝❤️🎉🚀
I'll see you soon with another heist plan, so stay tuned 🤑🐱👤🤗🤩

XPD/USD "Palladium CFD" Metal Market Heist Plan🌟Hi! Hola! Ola! Bonjour! Hallo!🌟
Dear Money Makers & Robbers, 🤑 💰
Based on 🔥Thief Trading style technical and fundamental analysis🔥, here is our master plan to heist the XPD/USD "Palladium CFD" Metal market. Please adhere to the strategy I've outlined in the chart, which emphasizes long entry. Our aim is the high-risk Red Zone. Risky level, overbought market, consolidation, trend reversal, trap at the level where traders and bearish robbers are stronger. Be wealthy and safe trade.💪🏆🎉
Entry 📈 : Traders & Thieves with New Entry A Bull trade can be initiated at any price level.
however I advise placing Buy limit orders within a 15 or 30 minute timeframe. Entry from the most recent or closest low or high level should be in retest.
Stop Loss 🛑: Using the 3H period, the recent / nearest low or high level.
Goal 🎯: 1070.000 (or) Escape Before the Target
Scalpers, take note 👀 : only scalp on the Long side. If you have a lot of money, you can go straight away; if not, you can join swing traders and carry out the robbery plan. Use trailing SL to safeguard your money 💰.
📰🗞️Fundamental, Macro, Sentimental Outlook
The Palladium (XPD/USD) market is expected to move in a bullish direction, driven by several key factors.
🔴Macroeconomic Factors:
1. Global Economic Growth: Improving global economic growth, particularly in China, is expected to increase demand for palladium.
2. Inflation: Rising inflation expectations, combined with a strong labor market, may lead to an increase in palladium's value.
3. Interest Rates: The current interest rate environment, with low rates in major economies, is expected to support palladium prices.
🔵Fundamental Factors:
1. Supply and Demand Imbalance: The palladium market is expected to face a supply shortage, driven by strong demand from the automotive sector and limited supply from major producers.
2. South African Mining Industry: The ongoing challenges in the South African mining industry, including labor disputes and power outages, are expected to support palladium prices.
3. Recycling and Scrap Supply: The increasing trend of palladium recycling and scrap supply is expected to support prices.
🟠Trader Sentiment and Market Outlook
1. Speculative Positioning: Market participants have been increasing their long positions in palladium, indicating a bullish bias.
2. Technical Analysis: Palladium's price has broken above key resistance levels, and its upward trendline remains intact, supporting a bullish technical outlook.
3. Risk Appetite: Improving risk sentiment, driven by optimism about global economic growth, has increased demand for riskier assets, including palladium.
⚪Sentimental Outlook:
Bullish Sentiment: 70%
Bearish Sentiment: 20%
Neutral Sentiment: 10%
Conclusion
Considering these factors, Palladium (XPD/USD) is expected to continue its upward trajectory, driven by fundamental and sentimental tailwinds.
⚠️Trading Alert : News Releases and Position Management 📰 🗞️ 🚫🚏
As a reminder, news releases can have a significant impact on market prices and volatility. To minimize potential losses and protect your running positions,
we recommend the following:
Avoid taking new trades during news releases
Use trailing stop-loss orders to protect your running positions and lock in profits
📌Please note that this is a general analysis and not personalized investment advice. It's essential to consider your own risk tolerance and market analysis before making any investment decisions.
📌Keep in mind that these factors can change rapidly, and it's essential to stay up-to-date with market developments and adjust your analysis accordingly.
💖Supporting our robbery plan will enable us to effortlessly make and steal money 💰💵 Tell your friends, Colleagues and family to follow, like, and share. Boost the strength of our robbery team. Every day in this market make money with ease by using the Thief Trading Style.🏆💪🤝❤️🎉🚀
I'll see you soon with another heist plan, so stay tuned 🫂

Palladium Bullish ContinuationPalladium price seems to exhibit signs of overall bullish momentum (after a credible reversal on the 4HR timeframe) as the price action may form another credible Higher Low with multiple confluences of key Fibonacci and credible Support levels.
Trade Plan :
Entry @ 984.25
Stop Loss @ 942
TP 1 @ 1026.5
TP 2 @ 1068.24
Move Stop Loss to Break Even if TP1 hits.

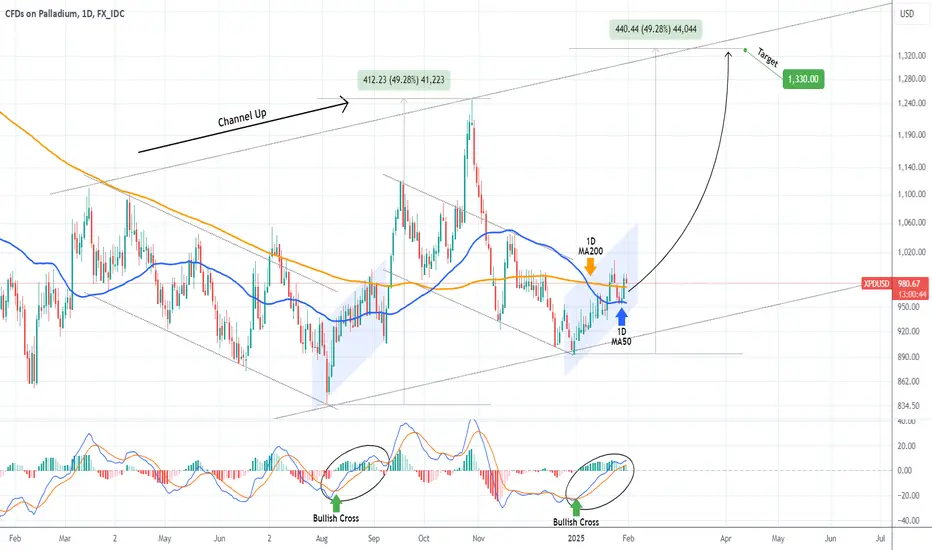
PALLADIUM Strong buy signal on the Channel Up bottom.Palladium (XPDUSD) has been trading within a long-term Channel Up, which priced its most recent Higher Low exactly a month ago (Dec 31). This coincided with a 1D MACD Bullish Cross, a formation that was also present during the pattern's previous Higher Low on August 05 2024.
This resulted in a similar Channel rebound, that initiated the new Bullish Leg, which eventually peaked after a +49.28% rise. We expect a similar technical reaction, thus turning bullish on Palladium, targeting 1330.
-------------------------------------------------------------------------------
** Please LIKE 👍, FOLLOW ✅, SHARE 🙌 and COMMENT ✍ if you enjoy this idea! Also share your ideas and charts in the comments section below! This is best way to keep it relevant, support us, keep the content here free and allow the idea to reach as many people as possible. **
-------------------------------------------------------------------------------
💸💸💸💸💸💸
👇 👇 👇 👇 👇 👇
XPD/USD "Palladium CFD" Metal Market Heist Plan🌟Hi! Hola! Ola! Bonjour! Hallo!🌟
Dear Money Makers & Robbers, 🤑 💰
Based on 🔥Thief Trading style technical and fundamental analysis🔥, here is our master plan to heist the XPD/USD "Palladium CFD" Metal market. Please adhere to the strategy I've outlined in the chart, which emphasizes long entry. Our aim is the high-risk Red Zone. Risky level, overbought market, consolidation, trend reversal, trap at the level where traders and bearish robbers are stronger. Be wealthy and safe trade.💪🏆🎉
Entry 📈 : You can enter a Bull trade at any price level.
however I advise placing Buy limit orders within a 15 or 30 minute timeframe. Entry from the most recent or closest low or high level should be in retest.
Stop Loss 🛑: Using the 4H period, the recent / nearest low or high level.
Goal 🎯: 1040.00 (or) Escape Before the Target
Scalpers, take note 👀 : only scalp on the Long side. If you have a lot of money, you can go straight away; if not, you can join swing traders and carry out the robbery plan. Use trailing SL to safeguard your money 💰.
Fundamental Outlook 📰🗞️
Based on the fundamental & macro analysis, I would expecting a bullish outlook for XPD/USD.
Supply and Demand:
Supply constraints: Palladium is a rare metal, and supply constraints can lead to higher prices.
Increasing demand: Growing demand from the automotive industry, particularly for hybrid and electric vehicles, can drive up prices.
Low above-ground inventory: The limited availability of palladium in above-ground inventory can lead to price increases.
Industrial Uses:
Catalytic converter demand: The increasing use of palladium in catalytic converters for vehicles can drive up demand.
Jewelry and investment demand: Growing demand for palladium jewelry and investment products can also support higher prices.
Diversification of industrial uses: The expanding use of palladium in various industries, such as aerospace and electronics, can reduce dependence on traditional markets.
Geopolitical Factors:
Russian supply disruptions: As Russia is a significant palladium producer, any supply disruptions due to geopolitical tensions can impact global supply and drive up prices.
Trade agreements and tariffs: Changes in trade agreements and tariffs can influence the global supply chain and impact palladium prices.
Macro Economic Factors:
Global economic growth: A growing global economy can lead to increased demand for palladium, driving up prices.
Inflation expectations: Rising inflation expectations can lead to increased investment in precious metals like palladium.
Central bank policies: Expansionary monetary policies by central banks can lead to higher inflation expectations and increased demand for palladium.
Trading Alert⚠️ : News Releases and Position Management 📰 🗞️ 🚫🚏
As a reminder, news releases can have a significant impact on market prices and volatility. To minimize potential losses and protect your running positions,
we recommend the following:
Avoid taking new trades during news releases
Use trailing stop-loss orders to protect your running positions and lock in profits
Please note that this is a general analysis and not personalized investment advice. It's essential to consider your own risk tolerance and market analysis before making any investment decisions.
Keep in mind that these factors can change rapidly, and it's essential to stay up-to-date with market developments and adjust your analysis accordingly.
💖Supporting our robbery plan will enable us to effortlessly make and steal money 💰💵 Tell your friends, Colleagues and family to follow, like, and share. Boost the strength of our robbery team. Every day in this market make money with ease by using the Thief Trading Style.🏆💪🤝❤️🎉🚀
I'll see you soon with another heist plan, so stay tuned 🫂

XPD/USD "Palladium vs US Dollar" Metal Market Bullish Heist Plan🌟Hi! Hola! Ola! Bonjour! Hallo!🌟
Dear Money Makers & Robbers, 🤑 💰
Based on 🔥Thief Trading style technical and fundamental analysis🔥, here is our master plan to heist the XPD/USD "Palladium vs US Dollar" Metal market. Please adhere to the strategy I've outlined in the chart, which emphasizes long entry. Our aim is the high-risk Red Zone. Risky level, overbought market, consolidation, trend reversal, trap at the level where traders and bearish robbers are stronger. Be wealthy and safe trade.💪🏆🎉
Entry 📈 : You can enter a Bull trade at any point.
however I advise placing Buy limit orders within a 15 or 30 minute timeframe. Entry from the most recent or closest low or high level should be in retest.
Stop Loss 🛑: Using the 2H period, the recent / nearest low or high level.
Goal 🎯: 956.000 (or) escape Before the Target
Scalpers, take note 👀 : only scalp on the Long side. If you have a lot of money, you can go straight away; if not, you can join swing traders and carry out the robbery plan. Use trailing SL to safeguard your money 💰.
Warning⚠️ : Our heist strategy is incompatible with Fundamental Analysis news 📰 🗞️. We'll wreck our plan by smashing the Stop Loss 🚫🚏. Avoid entering the market right after the news release.
Fundamental Outlook 📰🗞️
Based on the fundamental analysis, I would conclude that the XPD/USD (Palladium/US Dollar) pair is : Bullish
Reasons:
Growing demand from the automotive industry: Palladium is a key component in the production of catalytic converters, which are used to reduce emissions in vehicles. The growing demand for vehicles, particularly in China and other emerging markets, is expected to drive up demand for palladium.
Supply chain constraints: South Africa, the world's largest producer of palladium, has been experiencing supply chain disruptions due to labor strikes and power outages, which is expected to reduce global supply and drive up prices.
Investment demand: Palladium is also used as a store of value and a hedge against inflation, which is expected to drive up investment demand and prices.
Russian sanctions: The sanctions imposed on Russia, a major producer of palladium, are expected to reduce global supply and drive up prices.
However, it's essential to consider the following risks:
Global economic slowdown: A slowdown in global economic growth could reduce demand for palladium and drive down prices.
Substitution with other metals: The use of other metals, such as platinum or rhodium, in place of palladium could reduce demand and drive down prices.
New mining projects: The development of new mining projects could increase global supply and drive down prices.
Bullish Scenario:
Growing demand from the automotive industry and supply chain constraints drive up prices
Investment demand and Russian sanctions support prices
Please note that this is a general analysis and not personalized investment advice. It's essential to consider your own risk tolerance and market analysis before making any investment decisions.
Take advantage of the target and get away 🎯 Swing Traders Please reserve the half amount of money and watch for the next dynamic level or order block breakout. Once it is resolved, we can go on to the next new target in our heist plan.
Keep in mind that these factors can change rapidly, and it's essential to stay up-to-date with market developments and adjust your analysis accordingly.
💖Supporting our robbery plan will enable us to effortlessly make and steal money 💰💵 Tell your friends, Colleagues and family to follow, like, and share. Boost the strength of our robbery team. Every day in this market make money with ease by using the Thief Trading Style.🏆💪🤝❤️🎉🚀
I'll see you soon with another heist plan, so stay tuned 🫂

PALLADIUM has started a massive 3-year rally. Don't miss it.We first published this Palladium (XPDUSD) chart exactly 4 months ago (August 06, see chart below) and it is the appropriate time to update it now:
As you can see, we gave the buy signal exactly on the market bottom which was in fact a Triple Bottom. The rebound broke above the 1W MA50 (blue trend-line), a Resistance that was unbroken since the week of October 10 2022, and technically confirmed the uptrend and the trend reversal from bearish to bullish. The pattern that is carrying this uptrend is a Channel Up and in November in fact, it respected both the Higher Highs and Higher Lows trend-lines.
As mentioned on that August analysis, Palladium formed the very same Channel Up after both previous major market bottoms (Bear Cycles) since the December 2008 bottom of the U.S. Housing Crisis. All Channel Up patterns (the current is the 3rd one), started after the 1W RSI formed Higher Lows against the price's Lower Lows, which is a Bullish Divergence. They broke out once the 1W RSI made the first pull-back on the Arc shapes you see on the chart, indicating a normalization on the initial buying pressure at the bottom.
Obviously, this is a recurring technical cyclical pattern, formed on a 6-year Cycle. With the use of the Sine Waves we can accurately display the previous bottoms (January 11 2026 and December 01 2008) and to a fair extent the tops (we can argue that those are formed on the 3rd Lower High (red circles) on the 1W RSI Lower Highs trend-line).
Needless to say, we still expect Palladium to reach at least the 'Russia-Ukraine war peak' at 3450 by mid 2026 - mid 2027. If you want to go beyond that, technically, it can extend as high as $4780, which would represent a +451.52% rise from the recent 2024 bottom. The previous two Bull Cycles rose by +533.56% and 451.52% respectively, which also represents they high degree of symmetry within Cycles.
In any event, the current levels remain a unique buy opportunity on a 3 year horizon if you are a long-term investor.
-------------------------------------------------------------------------------
** Please LIKE 👍, FOLLOW ✅, SHARE 🙌 and COMMENT ✍ if you enjoy this idea! Also share your ideas and charts in the comments section below! This is best way to keep it relevant, support us, keep the content here free and allow the idea to reach as many people as possible. **
-------------------------------------------------------------------------------
💸💸💸💸💸💸
👇 👇 👇 👇 👇 👇
