Platinum (XPTUSD): wedge breakout — the real test starts now🇬🇧 English
On the daily, Platinum found support at the old Monthly Close and prior low and bounced. The falling wedge broke to the upside, the old monthly close is reclaimed and price is back above the EMA50, with RSI over 50. It's now testing the EMA200 together with the upper Bollinger band and the OB- 1D zone — the area where the move up could stall. As long as the reclaimed levels hold, the structure looks healthier; a drop below brings the old monthly close back into play.
On the 4H we s
XPT
Platinum (XPTUSD): wedge breakout — the real test starts now🇬🇧 English
On the daily, Platinum found support at the old Monthly Close and prior low and bounced. The falling wedge broke to the upside, the old monthly close is reclaimed and price is back above the EMA50, with RSI over 50. It's now testing the EMA200 together with the upper Bollinger band and the OB- 1D zone — the area where the move up could stall. As long as the reclaimed levels hold, the structure looks healthier; a drop below brings the old monthly close back into play.
On the 4H we s
XPTUSD (PLATINUM): Huge Descending Wedge, Breakout Incoming!Hello There,
welcome to my new analysis about XPTUSD (PLATINUM) from the daily timeframe perspective. PLATINUM had the potential to form a new substantive all-time high right within the beginning of 2023. The bullish volume, momentum, and volatility already increased during December of 2025. Currently, I have detected major underlying bullish factors that are likely to be a major catalyst of price action in the upcoming times.
As when looking at my chart, we can watch there how PLATINUM is fo
XPTUSD 1H — Bounce in progress, looking for a short1) Chart & context
The hourly chart suggests Platinum is approaching a sell-side opportunity, but I’m not looking to short immediately — I’m watching for the correction to mature first. 🕒
2) Structure (Elliott Wave read)
• We can see a clear 5-wave decline from ~2923 to ~1816.
• After a completed 5-wave move, the market typically prints at least a 3-wave corrective bounce (A-B-C) before the next bearish leg resumes.
➡️ My base case: we’re currently inside that upward correction.
3) Fibonac
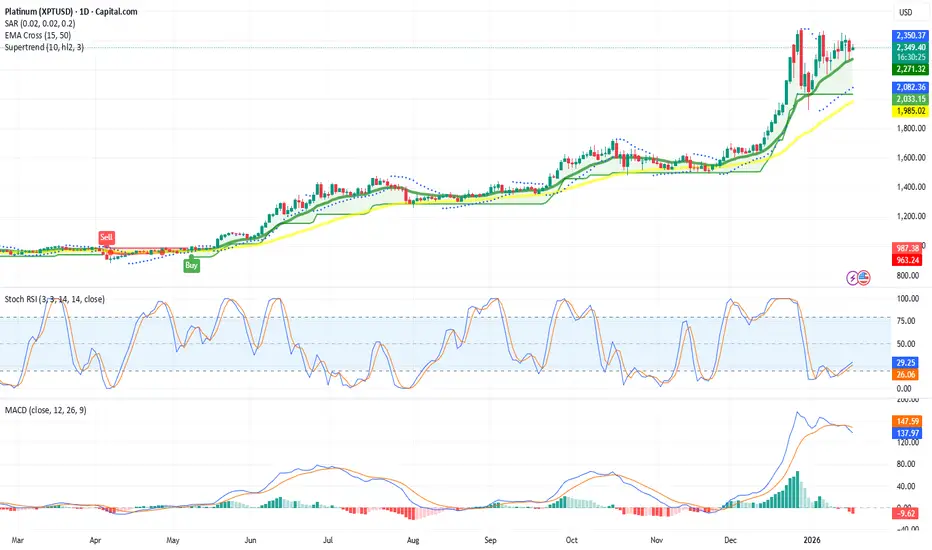
Platinum short term bullish 260119Platinum (XPT) going strong on the daily chart.
Short term indicators:
Par SAR: buy
EMA cross: buy
Supertrend: buy
Stoch RSI: buy
MACD: sell
Short term support at $2,002
Fundamentals are strong.
Long term (weekly, monthly charts) are also bullish.
Just like silver and gold:
XPT stands at the cusp of a multi-year bull cycleXPT stands at the cusp of a multi-year bull cycle
We all saw what the shiny boomer rocks did in 2025. Gold and silver massively outperformed crypto, driven by inflation hedging, macro uncertainty and positioning resets.
Whether that exact dynamic repeats in 2026 is less clear. Gold is already up ~80% from the prev YTD levels, silver nearly 190%, so a lot of the easy upside has likely been pulled forward. But when you move down the beta curve of precious metals, one thing stands out clearly: pla
PLATINUM The Bull Cycle still has some room to go.Platinum (XPTUSD) has been trading within a Channel Up since the March 16 2020 market bottom. With the support of the 1W MA50 (blue trend-line), it's been on its technical Bullish Leg since the April 07 2025 Higher Low.
The previous Bullish Leg peaked on a +135.93% rise. With the 1D RSI sequences among the two Bullish Legs similar, we also expect the current one to have one final push to give before completing a +135.93% rise at the top of the Channel Up. Our Target before that happens is $2000
Platinum- While everyone is chasing Gold’s rally, I’ve got my eyes on Platinum.
- That doesn’t mean Gold is a bad investment, it just means it’s already had its moment.
- Platinum feels “delayed,” but its time is coming.
- Observe closely, this simple graph reveals a tightening triangle.
Remember my first rule: Buy the blood, not the moon.
Stay sharp. Diversify. Never go all in.
Happy Tr4Ding
Gold Bull Markets: Long-Term Overview & Current Market UpdateGold Bull Markets: Long-Term Overview & Current Market Update (2024–2025)
________________________________________
🏆 Historic Gold Bull Markets: Timeline & Stats
1️⃣ 1968–1980 “Super Bull”
• Start/End: 1968 ($35) → 1980 ($850)
• Total Gain: ~2,330%
• Key Drivers:
o End of the gold standard (Bretton Woods collapse)
o Double-digit inflation, oil shocks
o Political/economic turmoil (Vietnam, stagflation)
• Correction:
o Nearly –45% drop (1974–1976)
• Recovery:
o Took years; massive rebounds afterw
Platinum Bullish GartleyI think that after the accumulation period, Platinum prices will head towards the Bullish Gartley target.
* What i share here is not an investment advice. Please do your own research before investing in any asset.
* Never take my personal opinions as investment advice, you may lose all your money.
PLATINUM Buy signal on the 1D MA50.Platinum (XPTUSD) is ranged lately within the 1D MA50 (blue trend-line) and 1D MA200 (orange trend-line) but with its 1D RSI rising steadily since the December 30 2024 Low. That was the technical bottom of the Falling Wedge pattern that broke upwards.
As you can see, this has been a very common pattern since September 2023, with all Falling Wedges eventually breaking to the upside to hit at least the 1.618 Fibonacci extension. As a result, our current short-term Target is $999.50.
------------
PLATINUM Huge buy opportunity at the bottom of the Channel Up.Platinum (XPTUSD) has been trading within a Channel Up for almost 1.5 year and currently it is testing the pattern's bottom. This process is similar to the Lower Lows bottom sequence of February 12 2024.
As you can see, even the 1D MACD fractals are the same and we are about to post the decisive Bullish Cross that signals the buy. As long as the price remains below the 1D MA50 (blue trend-line), it is a huge long-term buy opportunity.
The previous Bullish Leg hit the 1.236 Fibonacci extension
XPT Surges as EMAs Align with Bullish Chart PatternH ello!
XPT broke out from a falling wedge (See green trendlines!) formation with strong bull power, as the MACD shows. It wasn't against expectations since falling wedge chart patterns usually break upward. It's often a bullish formation. Thus, MACD and chart patterns align with a bullish outlook. Furthermore, the price is above EMAs (20/50/100/200). EMAs crossed upward on the 24th of September. Seemingly, nothing stands in the path of bulls until the green target circles. However, stay vigila
XPTUSD About to test the 1D MA200. Strong buy above it.Platinum (XPTUSD) is going quite well since our October 25 buy call (see chart below) as we caught the bottom and the price is now rebounding:
The long term pattern is a Channel Up. At the moment the price is supported by the 1D MA50 (blue trend-line) buy restrained below the 1D MA200 (orange trend-line) where it got rejected on November 28. Even though the bottom of the Channel Up was made and the 1D RSI patterns between the two sequences are similar, we need confirmation for upward extens
Decoding Market Trends: Platinum's Dance with AI-Predicted ShiftDear Esteemed TV Members,
P latinum has been swaying within a bearish trend. However, insights from Support Vector Machines (SVMs) applied to daily candles suggest a potential weakening of this bearish momentum. This predictive analysis, coupled with a possible rising channel pattern on the Relative Strength Index (RSI), indicates that the bearish trend might be approaching its conclusion, paving the way for a potential shift towards a bullish scenario.
S VMs, a formidable machine learning
Platinum(XPTUSD)is heading toward 1010$Hello Traders
Our technical view has been shown in the chart.
If you like it then Support us by Like, Following, and Sharing.
Thanks For Reading
Team Fortuna
-RC
(Disclaimer: Published ideas and other Contents on this page are for educational purposes and do not include a financial recommendation. Trading is Risky, so before any action do your research.)
XPTUSD Long-term buy opportunity near 1 year Support.Platinum (XPTUSD) is having a strong start to the week following a streak of 2 red 1W candles rejected on both the 1W MA50 (blue trend-line) and 1W MA200 (orange trend-line). Regardless of the obvious 1W Golden Cross pattern that those two are aiming to complete, the price got again near the 895 - 903 Support Zone, which has been closing all 1W candles above since September 2022.
With the 1W RSI on a bottom sequence similar to the February 2023, December 2021 and September 2021 fractals, we con
XPTUSD ( Platinum / USD ) Commodity Analysis 18/07/2021Technical Analysis:
As you can see, there exist a Hidden Bullish Divergence with MACD and it is the very sign of bullish trend continuation as the Price is Bullish Bounding in an ascending channel.
We draw Fibonacci retracement from the low to the top of previous impulsive wave for specifying the Bullish Cycles and the Possible Pivot Points and Reaccumulation levels in the correction wave condition, which are defined as the Fibonacci and Support and Resistance levels on the chart.
Currently
XPTUSD Buy opportunity with High expected in June.Platinum (XPTUSD) is trading on a Triangle pattern which is within a larger Channel Up. Last time we had this sequence on patterns was last November-December. Once the price hit the 1D MA50 (blue trend-line), it rebounded to the 1.5 Fibonacci extension. The current 1.5 Fib is at 1180 but we set a Target slightly lower at 1170. Notice how even the 1D MACD sequences between the two fractals are identical.
-------------------------------------------------------------------------------
** Please
XPTUSD - BULLISH SENTIMENTXPTUSD - has been ascending solidly with minor exceptions in a bullish channel since the beginning of February 23. Due to some uncertainties around the mining crisis in SA, one of the largest producers of the precious metal the price tag by BofA is set around $1400-$1500 by year-end, which makes a 40%-50% anticipated surge in the next 7-9 months.
Risk Disclosure: Trading Foreign Exchange (Forex) and Contracts of Difference (CFD's) carries a high level of risk. By registering and signing up, an
Platinum is the one to buy and hold for yearsI've been bullish platinum for a long time now, but breakouts from such long-term ranges take time. We've seen similar shapes in crude oil and in copper, both of which have broken out. I started discussing the upcoming crude oil breakout on Twitter in 2019 already, and I've been doing the same for platinum. In time, we will surpass the all-time highs, which isn't strange considering that platinum can be used as an industrial metal to support the electrification trend.
Don't expect this to breako