why? 90% of traders buy high and sell low?Have you ever entered a trade right when everyone said it is going to the moon
Have you ever sold right before price exploded upward again
This guide is here to break that painful cycle once and for all
Hello✌️
Spend 3 minutes ⏰ reading this educational material.
🎯 Analytical Insight on xrp:
I expect a much bigger rise for Ripple than what I have shown on the chart. But we should remember that every year when the New Year approaches the market usually goes bearish. We need to wait and pass through that period to see what the final result will be.
Now , let's dive into the educational section,
🧠 Trader Psychology
When price pumps fast the brain fears missing profit
This fear forces rushed entries without any plan
During drops the brain wants to escape immediately
Emotions repeat the same losing behavior again and again
As long as emotions decide the market always wins
📉 Market Emotion Cycle
Hope and excitement start the first entries
Greed grows at the top and everyone buys with confidence
Fear suddenly appears and price collapses fast
Panic creates the worst possible exit timing
Professionals buy while panic controls the crowd
🎯 Why We Buy Tops And Sell Bottoms
We search for confirmation from the majority
The majority is usually late and wrong in timing
Crowded zones have the highest probability of traps
After attracting buyers price normally corrects downward
In the bottom panic sellers accelerate the drop
📌 Proper Entry Plan
Entries must happen in logical discounted areas
Follow the trend instead of fighting it blindly
A trade without risk reward logic is a bad trade
A clear plan neutralizes heat of the moment emotions
🛡 Real Risk Management
Stop loss must exist before entering a position
Small risk keeps the trader alive long term
Clear targets prevent emotional exits without purpose
Without stop loss the market owns your account
📊 TradingView Tools
Volume Profile shows where big money entered strongly
Auto Fib Retracement marks logical pullback zones
Fear and Greed Index shows collective emotional pressure
Horizontal levels identify probable price reaction zones
Combining these tools creates emotion free trading decisions
🏆 Professional Behavior
They never enter trades during emotional hype
They journal every decision for performance growth
They know the market always gives another chance
Mind control matters more than predicting every move
main point
Replace hype and the herd with logic and structure and the cycle of buying tops and selling bottoms ends here. Survival and profits come from mental discipline not guessing the future. Control emotions and you step into professional trading.
golden recommendations
Wait for pullbacks instead of chasing fast moving candles
When everyone feels extremely confident danger might be highest
A stop loss costs less than your pride and saves your future
✨ Need a little love!
We pour love into every post your support keeps us inspired! 💛 Don’t be shy, we’d love to hear from you on comments. Big thanks , Mad Whale 🐋
📜Please make sure to do your own research before investing, and review the disclaimer provided at the end of each post.
XRPUSDT

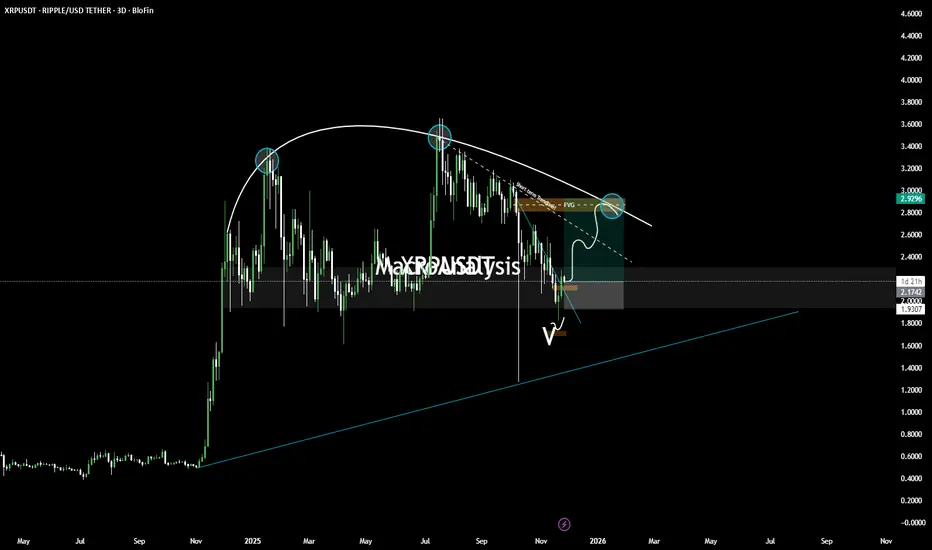
XRP — Major Macro Reversal Loading? XRP is completing a long-term structural pattern that has been developing for months. This setup includes a rounded top distribution, a full breakdown into major demand, and a potential reversal structure forming at the bottom.
This idea outlines both bullish and bearish pathways based on higher-timeframe confluence.
🔍 1️⃣ Rounded Top Distribution Completed
XRP formed a clear rounded top on the macro chart, with three major distribution points (highlighted).
Each point shows diminishing momentum and repeated rejection from the declining macro trendline.
This structure typically precedes:
Liquidity sweep lower
Long accumulation phase
Then high-timeframe reversal
We’re now entering the second phase.
🔍 2️⃣ Price Now Sitting in Major Higher-Timeframe Demand
Price has dropped directly into a large daily/3D demand block that held all previous macro corrections.
This zone aligns with:
Old imbalance fills
Breaker structure retest
Long-term ascending trendline below (blue line)
This is where macro buyers have stepped in before — and may do so again.
🔍 3️⃣ Bullish Scenario (Blue Path)
If price confirms demand strength, the bullish pathway is:
Sweep of local V-shaped liquidity
Retest of micro trendline (white dashed)
Break above the short-term breaker + FVG layer
Move toward the $2.95–$3.10 area (macro rejection zone)
This is the first major upside target.
A full reclaim above this level opens the door for a much larger trend reversal.
🔍 4️⃣ Bearish Scenario (White Path)
If demand fails, watch for:
Deviation above micro resistance
Rejection from FVG / breaker
Breakdown of V-swing formation
Deeper move toward long-term trendline support below
This would create a deeper macro accumulation before any major bullish cycle.
🎯 Summary
XRP is at a macro inflection point
We have:
Completed distribution
Full retest of long-term demand
Early signs of reversal structure
Clear upside targets and invalidation levels
This is a high-timeframe educational structure outlook, not a signal.
📘 Disclaimer
This post is for educational purposes only and reflects personal market analysis. It is not financial advice or a trade signal. Always DYOR and manage your own risk.
XRP/USDT : LIVE TRADEHello friends
Given the growth we had, the price has now broken its trading range strongly by sellers and our trend has also been broken, which is likely to push the price down.
Observe risk and capital management and avoid emotional behavior.
*Trade safely with us*

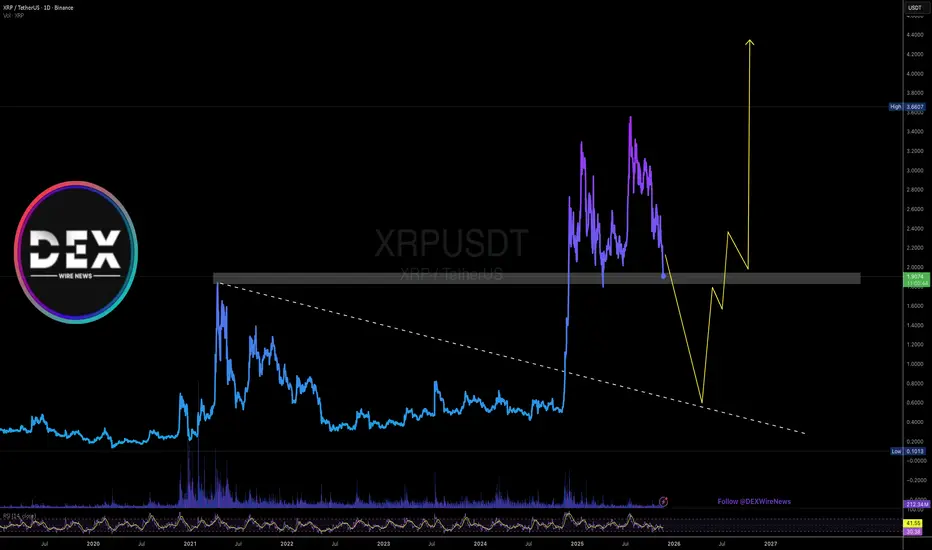
Ripple long term roadmap.This is my long term view.
* The purpose of my graphic drawings is purely educational.
* What i write here is not an investment advice. Please do your own research before investing in any asset.
* Never take my personal opinions as investment advice, you may lose your money.

TradeCityPro | XRP Bulls Eyeing Key Support for Surge👋 Welcome to TradeCity Pro!
In this analysis, I want to review the XRP coin, one of the oldest cryptocurrencies, with a $124 billion market cap, currently ranked 4th on CoinMarketCap.
⏳ 4-Hour Timeframe
After the recent market decline, XRP was one of the coins that managed to recover well. It was supported at 1.8733, and with the activation of the 2.0383 trigger, the price made an upward move.
✔️ Currently, the price is at a very important support zone, and as you can see, it is reacting to this level.
💥 The RSI oscillator has moved close to the overbought zone. If it enters this zone, the momentum of this coin will increase significantly, and the price could continue its bullish movement, potentially reaching higher levels.
✨ If the support zone holds, we can open a long position.
For a more accurate trigger, it's better to wait until the price touches this level a few more times and then activate the trigger.
🔔 The next resistance zones for XRP are 2.3404 and 2.5508, which can be used as targets.
The main trigger for confirming the bullish trend on higher cycles will be the break of 2.5508.
🔍 If the price gets rejected from this level and moves back toward 1.8733, we can open a position if volume starts to increase, using a candlestick setup. Otherwise, we can enter with a break of 1.8733.
📝 Final Thoughts
Stay calm, trade wisely, and let's capture the market's best opportunities!
This analysis reflects our opinions and is not financial advice.
Share your thoughts in the comments, and don’t forget to share this analysis with your friends! ❤️

XRP Approaching Key Supply Zone: Break or Reject?Hi!
Bullish Scenario
A bullish continuation becomes likely only if price breaks and closes above the $2.12–$2.18 S&D zone.
If that happens:
Buyers regain control
A retest could confirm support
Next target -> descending trendline at $2.35–$2.45
Conclusion:
Break S&D -> Long toward the descending trendline.
Bearish Scenario
If price rejects from the S&D zone and fails to reclaim $2.12–$2.18:
Momentum shifts back to the downside
Price may retest the $1.90–$1.92 zone, the most recent low
Further breakdown could lead to new cycle weakness

Breaking; It is Time to Sell $XRPThe price of the notable altcoin Ripple ( CRYPTOCAP:XRP ), saw its value nosedived tanking to the $1.9 support enroute to breaking the $1.8 support point.
With the RSI at 30, if CRYPTOCAP:XRP breaks the $1.8 bottom, we will expect a selling spree to the $0.60 support offering a buy opportunity for traders and investors. Hence the statement "It is time to sale CRYPTOCAP:XRP ".
A bearish symmetrical triangle is already forming as the asset breaks the $1.9 support point.
However, in a bullish thesis, if the asset makes a bounce from the current support point to the $2.5 resistant there might be hope for Ripple.
In another news, XRP has fallen 12% this week as its ongoing decline continues despite growing institutional interest. The altcoin is struggling to recover, even with two XRP ETFs already live and two more scheduled to launch next week.
What Is XRP / XRP Ledger?
Launched in 2012, the XRP Ledger (XRPL) is an open-source, permissionless and decentralized technology. Benefits of the XRP Ledger include its low-cost ($0.0002 to transact), speed (settling transactions in 3-5 seconds), scalability (1,500 transactions per second) and inherently green attributes (carbon-neutral and energy-efficient). The XRP Ledger also features the first decentralized exchange (DEX) and custom tokenization capabilities built into the protocol. Since 2012, the XRP Ledger has been operating reliably, having closed 70 million ledgers.
XRPUSDT: Strong Downward Pressure – Risk of Falling Toward 2.02Over the past 24 hours, XRP has been under significant pressure as the key support level at 2.15 was broken. This breakdown happened alongside a broader “risk-off” sentiment across the crypto market, combined with Bitcoin’s shift into a bearish structure , adding more downward momentum to XRP.
On the 4H chart, the bearish trend of XRPUSDT is very clear as price remains trapped inside a long-term descending channel . Each rebound has been capped at the channel’s resistance line, showing weak buying pressure while sellers continue to dominate .
The 2.22 zone is now acting as short-term resistance. If price retraces to this level, there is a high probability of renewed selling pressure pushing the market back into the downtrend. The next bearish target lies at 2.02, a historically strong support area that has held price multiple times before.
With a combined view of fundamentals and technicals, the overall trend for XRPUSDT remains bearish. Traders may look for sell setups if price retraces into the 2.20–2.22 region, aiming for the 2.02 target in the short term.

XRP (CRYPTO: $XRP) Tests the Critical $2 Support Zone CRYPTOCAP:XRP sits at a pivotal moment as price hovers just above the $2 support zone while multiple ETF launches arrive this week. XRP trades near $2.11, down over 12% this month, reflecting fading momentum across the broader crypto market. Traders now watch whether fresh institutional inflows can stabilize price or whether market weakness will override the optimism.
Franklin Templeton launches its EZRP ETF on November 18, followed by Bitwise on November 20. Early signals from Canary Capital’s ETF—recording $58 million in first-day volume—suggest appetite exists, but analysts warn outcomes vary widely. Some ETF launches bring sustained bullish momentum; others produce short-lived volatility or no major reaction. Much depends on liquidity, risk sentiment, and macro conditions surrounding crypto.
On-chain metrics also reflect this tension. Glassnode’s NUPL indicator shows long-term holders shifting from belief into anxiety. Historically, such transitions often precede major directional moves. Whether this marks a bottoming process or signals deeper caution remains a central question for traders.
Technically, XRP’s structure weakened after breaking below its ascending trendline. The $2 level now acts as the most important support of the cycle. A break beneath it risks acceleration toward $1.5, the next visible demand zone. If support holds, buyers could push toward $2.6, followed by a retest of the former trendline and possibly the $3.6 highs.
Outlook:
ETF activity introduces opportunity, but not confirmation. XRP’s next move will likely depend on how price reacts to $2 as institutional inflows meet a cooling market.

How Can XRP ETFs Prevent Price Crash To $2 This Month?XRP trades at $2.14 and currently rests on key support at the same level. The asset has been locked in a downtrend for nearly a month, struggling to break out despite periodic attempts. Without external catalysts, XRP risks drifting lower as bearish momentum persists.
However, XRP may avoid a deeper decline as the likelihood of ETF approval increases. Bloomberg ETF analyst Eric Balchunas noted that the SEC released guidance allowing issuers to speed up filing effectiveness, likely to clear regulatory backlog. Bitwise’s XRP ETF is reportedly next in line, and any progress could improve market sentiment instantly.
If bullish momentum continues and ETF expectations strengthen, XRP could climb to $2.28 and then $2.36, breaking free from its downtrend. If momentum weakens or ETF decisions face delays, XRP may resume its slide and potentially drop 6.8% to reach $2.00. This would invalidating the bullish thesis.

TradeCityPro | XRP Shows Potential After Support Bounce👋 Welcome to TradeCity Pro!
Let’s dive into the XRP coin analysis. It’s one of the oldest crypto projects, with a market cap of $136.74 billion, currently ranked 4th on CoinMarketCap.
⏳ 4-Hour Timeframe
On the 4-hour timeframe, this coin is sitting on a very important support level at 2.1843.
✔️ This level can also be viewed as a support zone. Currently, the price has shown a reaction to this zone and is moving upwards with very low volume.
⚡️ The first resistance zone for XRP is at 2.3404. Considering the low buying volume in the recent candles, the probability of a continued bullish move is higher unless the buying volume increases.
📊 If the buying volume starts to increase, we can use the 2.3404 level as a trigger for a long position. The next significant resistance levels for this coin are 2.5508 and 2.6718.
🔔 However, if the volume remains this low, a break below the 2.1843 support could trigger a short position. The next support zone for XRP is at 2.0013.
🛒 For spot purchases or confirmation of a new bullish trend, the trigger we currently have is 2.6718. Personally, for spot buying, I will track this coin after the 2.6718 level.
📝 Final Thoughts
Stay calm, trade wisely, and let's capture the market's best opportunities!
This analysis reflects our opinions and is not financial advice.
Share your thoughts in the comments, and don’t forget to share this analysis with your friends! ❤️

Are you ready ?XRP’s movement is consolidating around the 2.7–2.8 range and is expected to maintain this wave pattern until a breakout above the Fibonacci 0.61–0.65 level.

$XRP Channel Crunch – Hold the Line or XRP Dip to Fill?BINANCE:XRPUSDT CRYPTOCAP:XRP Channel Crunch – Hold the Line or XRP Dip to Fill?
Altcoin Pioneers! 🐋 XRP/USDT 1H is coiling tight in this blue descending channel, price scraping support at ~2,430 after a swift pullback from resistance 2,550. Ripple's regulatory shadow looms, but that blue box consolidation hints at pent-up energy – buyers defending the floor with conviction.
Hold support? Strong potential; low wick on the test candle + rising volume could ignite a squeeze. Breakout above resistance? On deck if >2,560 clears, eyeing 2,650 ATH retest. Deeper dip risk? Watch out – breach targets 2,350 (channel low), SEC drama fuel.
Target: Upside pop to 2,520 if holds, downside probe 2,380 on fail. Tracking: Ichimoku cloud for trend flip, ADX for strength surge, and XRP/BTC pair for BTC drag. XRP army, charge! ⚡📊
#XRP #RippleAnalysis #CryptoCharts

Ripple Market Warning! Strong Bearish Setup Emerging🚨 XRP/USDT BEARISH REVERSAL SETUP 🎯 | Swing Trade Blueprint
Asset: XRP/USDT (Ripple vs Tether) 💎
Market: Cryptocurrency
Strategy: Swing Trade - BEARISH 🐻📉
📊 TRADE SETUP
🔴 BIAS: Bearish Momentum Building
📍 ENTRY: Flexible Entry - Any Current Price Level ($2.26 area)
⚠️ RISK MANAGEMENT (CRITICAL)
🛑 Stop Loss Reference: $2.7000
⚡ IMPORTANT: This is a reference SL only. Adjust based on YOUR strategy & risk tolerance.
✅ PRO TIP: Place SL AFTER breakout confirmation. DO NOT set it prematurely!
🎯 Dear Traders & OG's: I'm NOT recommending you blindly follow my SL. This is YOUR trade, YOUR capital, YOUR risk. Manage it accordingly!
🎯 PROFIT TARGET
🔥 PRIMARY TARGET: $1.6000
📌 Technical Support:
Triangular Moving Average acting as strong support zone
Oversold conditions developing
Liquidity trap zone - TAKE PROFITS strategically
💰 Risk Disclaimer: I'm NOT recommending you follow only my TP. Scale out, take profits at YOUR comfort levels. Secure the bag at YOUR own discretion!
🔗 CORRELATED PAIRS TO WATCH
Direct XRP Pairs:
XRP/USD 💵 - Monitor for divergence signals
XRP/BTC ₿ - Bitcoin pair correlation strength
XRP/ETH Ξ - Ethereum cross-pair dynamics
Related Market Movers:
BTC/USDT - Bitcoin dominance impacts alt direction
ETH/USDT - Ethereum weakness = altcoin pressure
SOL/USDT - High-cap alt comparison
ADA/USDT - Similar smart contract platform competitor
🧠 KEY TECHNICAL FACTORS
✅ Descending channel formation
✅ Triangular MA support confluence
✅ Oversold RSI conditions approaching
✅ Volume divergence patterns
✅ Liquidity zones below current price
🔗 Market Correlation Logic:
When BTC/USDT shows weakness, XRP typically follows with amplified moves. Monitor Bitcoin for confirmation of bearish continuation. If Bitcoin stabilizes above key support, XRP may find temporary relief before next leg down.
⚡ ACTION PLAN
1️⃣ ENTRY: Scale in at current levels
2️⃣ CONFIRMATION: Wait for breakout validation
3️⃣ STOP PLACEMENT: Set SL after confirmation (suggest above $2.70)
4️⃣ PROFIT MANAGEMENT: Scale out profits toward $1.60 target
5️⃣ MONITORING: Watch BTC dominance & overall crypto market sentiment
🔔 Follow for more setups | 👍 Like if this helps | 💬 Comment your thoughts!
📊 Stay disciplined. Trade smart. Protect capital.
#XRPUSDT #CryptoTrading #SwingTrade #BearishSetup #RippleTrade #CryptoAnalysis #TradingView #AltcoinTrading

$XRP Holding the Line?BINANCE:XRPUSDT CRYPTOCAP:XRP Holding the Line?
XRP is consolidating in a tight range after a strong rebound, currently testing key support at ~$2.10.
The trend looks bullish short-term if it holds here—volume spikes suggest accumulation, not capitulation.
Breakout above $2.55 resistance could target $2.70-$2.85 next, fueled by momentum.
But watch for a deeper dip to $1.95 if support cracks on low volume.
Key indicators: RSI at 55 (neutral, room to run), 50 EMA as dynamic support, and rising MACD histogram.
Stay vigilant! 📈🔍
#XRP #CryptoAnalysis #TradingView

$XRP Trendline Breakdown – Support Crucial for Reversal?BINANCE:XRPUSDT CRYPTOCAP:XRP Trendline Breakdown – Support Crucial for Reversal?
Current trend: XRP's in a bearish slide along the descending trendline, now testing the 2.39 support after rejection from 2.59 highs—sellers in command, but thinning volume suggests potential exhaustion 🛡️.
Hold support? Even odds yes; prior bounces and EMA confluence could ignite a sharp rebound if buyers defend the zone.
Breakout above resistance? Needs 2.59 close to flip trendline bullishly—could rally 5-7% to 2.70 if BTC stabilizes 🚀.
Dip risk? Elevated to 2.30 on break, accelerating downside momentum.
Target: Bounce to 2.50 on hold; downside 2.25 buffer.
Indicators tracking: RSI (38, oversold territory), Trendline integrity, and MACD bear divergence 📉.
#XRPTrading #CryptoSupport #AltcoinPioneers

XRPUSDT UPDATE#XRP
UPDATE
XRP Technical Setup
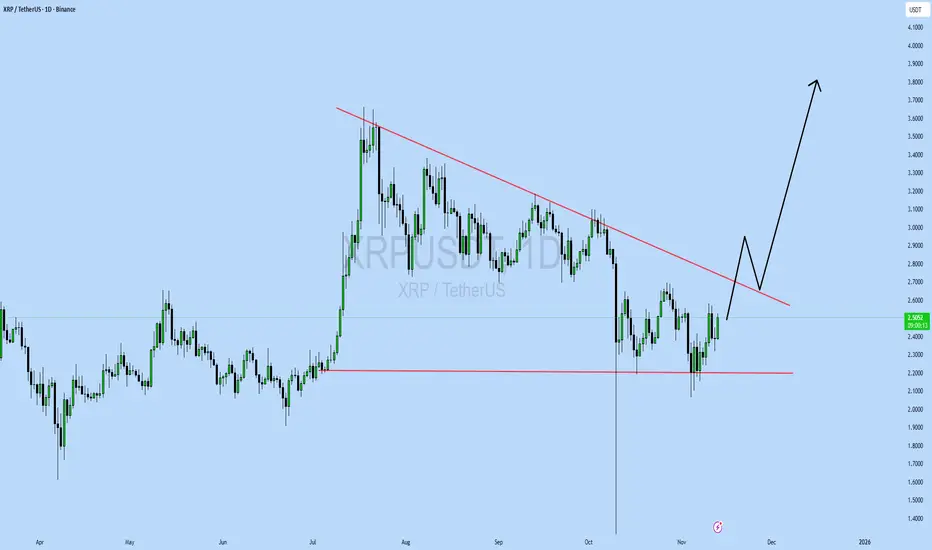
Pattern: Falling Wedge Pattern
Current Price: $2.49
Target Price: $3.80
Target % Gain: 52.61%
Technical Analysis: XRP is forming a falling wedge pattern on the 1D chart, suggesting bullish momentum is building. The price is approaching the upper resistance trendline and is expected to break out soon. A successful breakout, supported by volume expansion, could push XRP toward the $3.80 zone, aligning with previous structural highs.
Time Frame: 1D
Risk Management Tip: Always use proper risk management.
Nasdaq Approves Spot $XRP ETFThe first spot CRYPTOCAP:XRP ETF (ticker:XRPC) is scheduled to go live today, signaling another step forward for the broader crypto-ETF market.
This marks a major legitimacy boost for XRP—something the asset hasn’t seen in years. Whether it becomes a true catalyst now depends on one thing: sustained inflows.
TECHNICAL VIEW:
CRYPTOCAP:BTC continues to dictate broader market direction, while XRP remains stuck in a multi-month range. The structure still leans bearish, with a clear sequence of lower highs showing that momentum has yet to return.
CRYPTOCAP:XRP is currently ranging between $2.06 and $2.70, with the upper boundary holding as firm resistance. Price made an attempt to break through the liquidity curve, but if price just stall here without a decisive break above $2.60, then we do have a risk of breaking down into $1.80-$1.70 zone.

XRP Downward Move Incoming? Market Manipulation at Play?I’m watching XRP closely on the 1H chart, and something feels off. This recent push up looks like a liquidity grab — classic manipulation to trap late long entries before a potential reversal.
The structure still shows lower highs forming, and we haven’t reclaimed key resistance levels convincingly. I believe we could see a move down from current levels, possibly retesting the demand zone below before any sustainable bounce.
Let’s see how it plays out — stay patient, stay sharp, and don’t get caught in the trap.
📉💡

$XRP Support Siege – Flip to Bulls on Hold?BINANCE:XRPUSDT CRYPTOCAP:XRP Support Siege – Flip to Bulls on Hold?
Current trend: XRP's in a corrective slide, probing the sturdy 2.31 support after topping out near 2.56 resistance—low-volume wicks suggest exhaustion, with alts eyeing a relief rally 🛡️.
Hold support? Solid odds yes; doji formations and volume pickup on greens signal buyers loading up for defense.
Breakout above resistance? On deck if closes over 2.56—could spark 5-7% rip to fresh highs 🚀.
Dip risk? Low-moderate to 2.25 on BTC drag, but MACD divergence limits downside.
Target: Near-term 2.55 retest, then 2.70 if momentum flips.
Indicators tracking: MACD for crossover signals, RSI (hovering 42) for oversold snapback, and VWAP as pivot 📊.
#XRPTrading #AltcoinRebound #CryptoSupport

XRP Update📊 XRP Update
XRP is approaching the green support zone 🟢
Now the question is — will it bounce or break below? ⚖️
If it holds, we could see a strong rebound 📈
But if it breaks, expect a deeper correction 🔻

XRP/USDT — Reversal Incoming or Deeper Breakdown?XRP is now standing at a make-or-break point. After weeks of movement inside a well-defined descending channel, price is once again testing the critical support zone at 2.32–2.17 — the level that has repeatedly acted as the last line of defense for the bulls.
This zone has held multiple times, yet each bounce has been capped by the upper boundary of the channel — forming a classic corrective structure where bearish momentum gradually weakens, preparing for a potential breakout phase.
---
📊 Pattern & Technical Structure
The chart reveals a descending channel pattern, typically signaling a corrective or consolidation phase within a broader market cycle.
Lower boundary of the channel → potential accumulation area and source of rebound.
Midline → dynamic resistance that has repeatedly rejected upward attempts.
Support box 2.32–2.17 → the decision zone, where bulls and bears will soon reveal the next major trend.
Failure to hold this level could trigger another leg down, while a strong defense here could mark the beginning of a larger trend reversal.
---
🚀 Bullish Scenario
A bullish breakout setup will be confirmed if:
1. Price closes above the descending channel with strong daily momentum.
2. The breakout is followed by a successful retest of 2.75 as a new support.
3. Upside targets then lie at 3.09 – 3.32 – 3.56 – 3.66, representing potential wave extensions.
If validated, this move could trigger a powerful recovery rally and possibly signal a major bullish reversal on the higher timeframes.
---
🔻 Bearish Scenario
On the flip side, if the 2.17 support fails to hold and a daily close occurs below this zone, then:
Price could continue sliding toward the lower boundary of the channel (1.95–1.80),
Extending the correction phase,
And potentially forming a lower-low structure in continuation of the broader downtrend.
This would confirm a sustained bearish control in the medium term.
---
📍 Conclusion
XRP is at the edge of compression, where the next decisive move will define its next big trend.
This descending channel may soon reveal whether it’s a bear trap before a breakout, or the start of another downward leg.
The reaction at the 2.32–2.17 zone will decide everything — this is the battlefield between reversal and breakdown.
Watch for daily closes, volume confirmation, and price behavior around the upper boundary of the channel.
Smart traders know — the calm before the breakout is where the biggest opportunities are born.
---
#XRP #XRPUSDT #Ripple #CryptoAnalysis #TechnicalAnalysis #DescendingChannel #PriceAction #SupportResistance #CryptoBreakout #SwingTrade #ChartPattern

#XRPUSDT: Bullish Reversal Coming With Price Heading Back To 3.5## XRPUSDT Analysis: Long-Term Perspective
In the long term, we anticipate the XRPUSDT price to revert to its all-time high of 3.5. From a fundamental analysis standpoint, we maintain a positive outlook, with the potential for the price to surpass 3.5. We have identified a favourable trading opportunity, as illustrated in the chart.
Our approach is neutral, as the trend remains undecided. Based on the duration of your positions, you can set two targets:
1. **Short-Term Target:** If you intend to hold your positions for a short period, aim for a price level above 3.5.
2. **Long-Term Target:** For long-term investors, a target price of 4.0 or higher is plausible.
We are committed to providing comprehensive analysis and support. Should you have any inquiries or require further clarification, please do not hesitate to contact us.
Additionally, we would appreciate your insights on which cryptocurrency pair you would like to explore next.
Regards,
Team Setupsfx_
