EURZAR (CONTINOUS DOWNTREND)I am looking at this pair to continue down
owing to the current weak EUR and strong ZAR fundamentally an tech.
I would love to see this retrace for better entry and small SL.
or keep selling and breaking the support for good entry.
ZAR

ZAR/JPY 1H Chart: Rising wedge in sightThe ZAR/JPY currency pair breached a long-term descending channel north at the beginning of November. The South African Rand has been depreciating against the Japanese Yen since the end of August. This movement has been bounded in a rising wedge.
Currently the exchange rate is testing the resistance level formed by the Fibonacci 50.00% retracement at 8.23. Given that the pair is being supported by the 55-, 100– and 200-hour SMAs, it is expected that the pair target the upper wedge line located circa 8.46 in the nearest future.
If given wedge holds, it is likely that a reversal south occurs within the following trading sessions.

USDZAR approaching resistance, potential drop! USDZAR is approaching our first resistance at 6.8172 (horizontal pullback resistance, 50%, 61.8% Fibonacci retracement, 100% Fibonacci extension) where a strong drop might occur below this level pushing price down to our major support at 6.6009 (horizontal swing low support, 100% Fibonacci extension).
Stochastic (34,5,3) is also approaching resistance and we might see a corresponding drop in price.

USDZAR approaching support, potential bounce!USDZAR is approaching our first support at 6.6135 (horizontal swing low support, 61.8%, 100% Fibonacci extension) where a strong bounce might occur pushing price up to our major resistance at 6.7134 (horizontal swing high resistance, 61.8% Fibonacci extension, 23.6%, 50% Fibonacci retracement).
Stochastic (34,5,3) is also approaching support and seeing a bullish divergence and we might see a corresponding bounce in price.

USD/ZAR 1H Chart: Downside potentialThe US Dollar has been depreciating against the South African Rand gradually since the beginning of August. This movement has been bounded in a falling wedge.
During this week the pair has been trying to breach the resistance level formed by the weekly R1 at 14.54. Given that the exchange rate is being pressured by the 55-, 100– and 200-hour SMAs, it is expected that the rate targets the lower wedge line located circa 13.85 within the following sessions. Technical indicators also support bearish scenario.
If given wedge does not hold, a breakout south might occur. Potential downside target is the Fibonacci 50.00% retracement at 13.58.

EUR/ZAR - Buying OpportunityThere is currently a bullish opportunity with EUR/ZAR.
As long as it does not close under it's current support zone which is at ~1.1612 the bullish move is valid.
Trade safe.

USDZAR is approaching resistance, potential drop! USDZAR is approaching our first resistance at 6.8630 (horizontal overlap resistance, 100% Fibonacci extension, 38.2% Fibonacci retracement) where a strong drop might occur below this level pushing price down to our major support at 6.6179 (horizontal swing low support, 100% Fibonacci extension).
Stochastic (21,5,3) is also approaching resistance and we might see a corresponding drop in price.


USDZAR approaching support, potential bounce! USDZAR is approaching our first support at 6.7169 (horizontal swing low support, 61.8%, 100% Fibonacci extension, 23.6% fibonacci retracement) where a strong bounce might occur pushing price up to its resistance at 6.8762 (horizontal overlap resistance, 100% Fibonacci extension, 38.2% Fibonacci retracement).
Stochastic (21,5,3) is also approaching support and we might see a corresponding bounce in price.


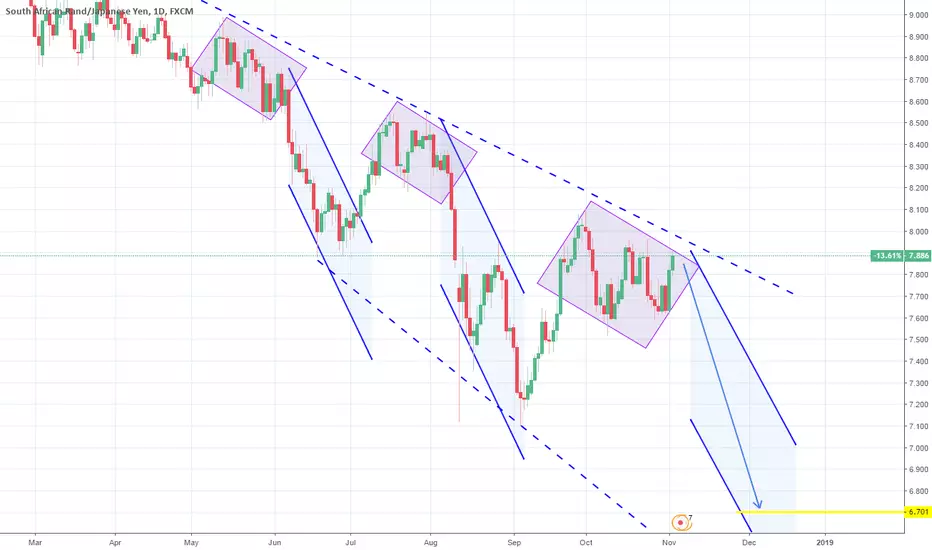
ZARJPY: Extreme scenario based on recurring patterns.This pair has been trading on a very long term bearish pattern on the 1M chart (RSI = 44.631, MACD = -0.196, Highs/Lows = -0.1826, B/BP = -0.8800) and the neutrality on the 1W chart (5 indicators) suggests that a High has been reached. The bands appear to be widening for the supports, so we are short with TP = 6.700.
EURZAR: Significant long term downside gap. Short.The pair is trading on a very long term 1M Channel Up (RSI = 57.375, MACD = 0.349, Highs/Lows = 0.2662, B/BP = 1.5626) that has a sizable downside gap to fill in the attempt to price a Higher Low. Our action plan is to short towards 15.08674 and then buy for the next Higher High (pattern continuation) with TP = 18.5000.

AUDZAR: 1D Channel Down. Short.The pair is attempting to develop a Channel Down on 1D by currently pricing a Lower High. 9.9000 can be taken as a potential short target.


USDZAR - huge triangle, 3 % moves aheadNot trading this one, just following how the triangle pattern works out

