Scottish Mortgage Investment Trust PLC. Analysis 14 June 21
LSE:SMT
Scottish Mortgage Investment T
Weekly TL is Broken.
With Weekly Supply Above.
Next Monthly potential area of
Demand Below.
Zone

CHFJPY Short... FinallyCHF has been gaining strength over the past day or so as i've been trading against it. If anyone can let me know why that is, then that would be appreciated, lol.
Anyway, CJ has entered the zone where price last visited at the end of May, and this opportunity is the last one i'm going to take with this pair for this week. I'm looking to short with a SL of about 10-20 pips depending on my entry (will probably have a couple positions on).
Trendline drawn from the daily/4H and we'll probably see CJ drop once that trend is broken. Until then, we may see price bounce up from it for a bit but my bias is long-term bearish.
I'll be targeting up to 150 pips, updates to follow.

US30/DowJones Long (short-term)Trendline drawn from 4H TF. Lots of rejection to the downside as you can see in that zone. Will look for confirmation to enter with a small lotsize as i'll need to place the SL about 80 points below entry, below the trend line.
Inflation report being released tomorrow 1.30pm GMT and if the results are bad (i.e. inflation is high/worse than expected), we'll likely see a drop on indices as investors drop out... hence why this set-up is a short-term one.
Updates to follow.
ULong

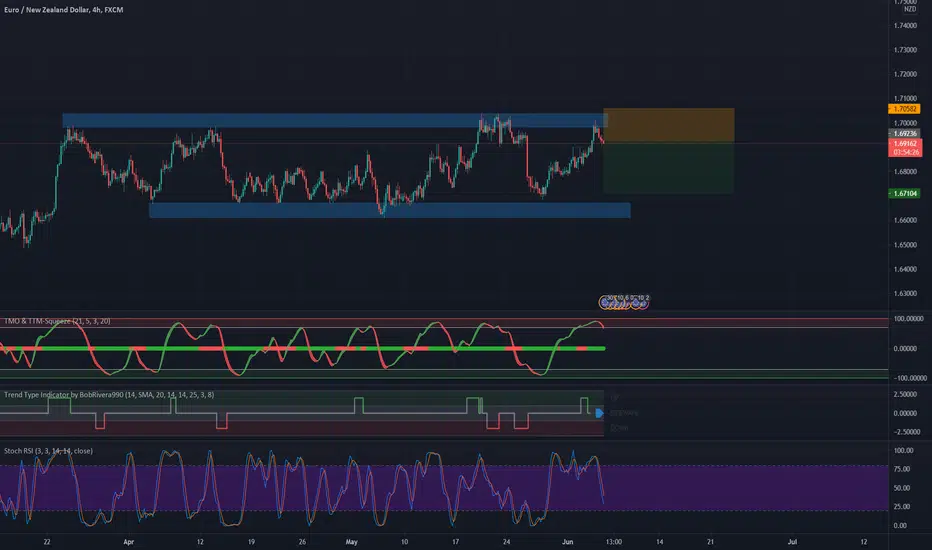
EURNZD - 07 – 11 June 21 Week Trade PlanEURNZD
This is my 07 – 11 June 21 Week Trade Plan for EURNZD
Previous Month : Bullish
Previous Week : Bullish
Daily : Bearish
As anticipated last week, EURNZD played the range from 6650/7020 and with the daily solid close on 28 May it pushed it to the range high at 6980/7020 Res Zone with some Res formation on the way up at 6820/6860.
As EURNZD still in range and no clear break out, i expect EURNZD to again test the range lows at 6700/6650.
COT report showing that NZD shorts had increased their positions but still not convincing as it's only one week that showed that increase. Longs are still holding their positions. A confirmation that NZD shorts are into the market when i see 2 to 3 weeks consecutive increases in short positions .
Seasonality showing that NZD will weaken till mid May and strength till end of May continuing into June to create new NZD highs which will lead EURNZD to create a new low.
Technically, i'm looking for EURNZD to still range between 7020/6650, which makes me look for longs from range lows and shorts from range highs as long no break and support/resistance formation above Sup/Res zones marked.
My plan for this week as EURNZD reached the top of the range, i'll look for resistance formation below the daily resistance formed and below the Res zone at 6980/7020 to short back to the range low at 6700/6650.
My preferred longs will be above the Res zone 6980/7020 with support formation above on 4H.
No major news this week for NZD and Monday is NZD Bank Holiday.


Check out my analysis for CADJPYPossible setups for next week. There could be a possible double bottom forming in the 1 Hr TF. Price has already respected price 90.500 and could respect it again.
Other possible scenario is that price can drop down to 90.000. It does seem like there was a head and shoulders pattern that formed this week.
Always remember to make time for backtesting. Its so crucial and very beneficial for your forex trading.

EURNZD Short SetupTrend: Ranging
Structure: Support and Resistance zones
Plan: We have seen price respect the upper resistance zone and now look for it to fall back into the lower resistance zone or 0.5 Fib level.
AUDUSD Long SetupTrend: Ranging
Structure: support and resistance / Zone
We have identified a buy zone test multiple times on the 4HR time frame.
We now see price has once again respected this zone, however the stochastic on the one hour timeframe is at 90 so we look for a small pullback for a long entry.

Potential upcoming trading rangesSome potential BTC trading ranges in the upcoming weeks/months to keep an eye on.

EURJPY Analysis 5/30Hello traders, this is my analysis of EURJPY. Price has continued to keep closing under price 134.000. Although, there is a potential fakeout from last week. Over bullish, but correction is needed.
Two scenarios.
1. Price can fall drown since it has been closing under price 134.000 and drop down to price 133.000
or
2. Price can just continue bullish to 134.400
Like if you agree with any scenario.

BITCOIN BUY ZONE - CONSOLIDATION FOR NEW HIGHSThe Purple Box is the consolidation zone. This is my buy zone. I think from here we will go to ATH in the next weeks or months. As long as we ain't breaking it to the downside- it's not invalidated.
We can also see the RSI bullish divergence on Daily timeframe. That is a powerful sign that often indicates strong move to the upside.

Illustrated strategy mixSpotted this on silver monthly yesterday, and illustrated how triple threat plays off structure breaks.
But these same set ups are found down on most smaller time frames. especially with 5-15 min delorians. So when your delo, or purple zone trade smashes a TP, tripple threat will get you back in at the retest of your TP/structure break when your in a trending market.
Applicable on all instruments.
Of course: Fundamentals drive the direction of a market and risk management discipline is the only way to grow an account long term.

GBPJPY Analysis complete, 0.382 is our fib confluence zoneAfter price bounces off the 0.382 fibonacci confluence zone, it should head all the way up to 155+ which will surpass our previous idea that also went all the way to 154,660 from 153.750.
I am Long long (a long buy).

TRONUSDTShaky steps
TRON Currency, like the market as a whole, instills in us a sense of dread of Bitcoin's next move.
If the trend can move between the resistance and support zones or break upwards, it indicates that the currency has stabilized.

BTCUSDTThree Determinant Limits for Bitcoin
The first and defining area was the green area that prevented further bitcoin from falling, which included the support zone and the channel floor area.
The second limit is the price range of 63,000, and if Bitcoin can break this range and stabilize above it, we can expect that Bitcoin will maintain its upward trend for at
least half a year. But if it fails to break this resistance zone, the doublet trend will decline and it will at least reach the bottom of the canal again.
The third determinant range in this range is the risk of investing in bitcoin, so if the downward trend of bitcoin is expected to fall sharply, first to the price range of 49,000 and then continue to fall to the price range of 41,000 and finally the price range of 30,000 Touch.


BNBUSDTBainance baby game on the ascending channel
Although this currency has a short life, it has shown that it has a lot of growth potential.

XLong

CHZUSDTCHILIZ 's fateful decision
We see that the Chiliz trend has formed a descending triangle because most of the failures in this type of triangle have been descending.
Unfortunately, Chiliz is following a major downturn, so it is more likely to fall in the near future.

NANOUSDTExit from the Triangular Prison
Nano currency has the ability to achieve higher goals.
chart :
At the moment, the trend is stuck under the Ichimoku cloud in the triangular dungeon. But there is also a support zone and a moving average below it. However, we can hope that we will have a bullish defeat.
But we should not be unaware of unpredictable events
N

BTCUSDTAn important and influential point in the bitcoin process
Take a closer look at the blue area shown here. There are support factors, including the Ichimoku cloud range and the moving average within it, that the trend has not been able to defeat.
Now, if it continues to support the trend, it will cause Bitcoin to rise.
And if it can't stop the fall, it will face a serious challenge on the canal floor.

Tesla Retracing short, Longer term bullishRiding a short down to a buy zone on Tesla.
Expecting this market to bounce to bullish in the purple zone 1.618 Fib, Limit order set. Invalid if the short gets stopped out.
