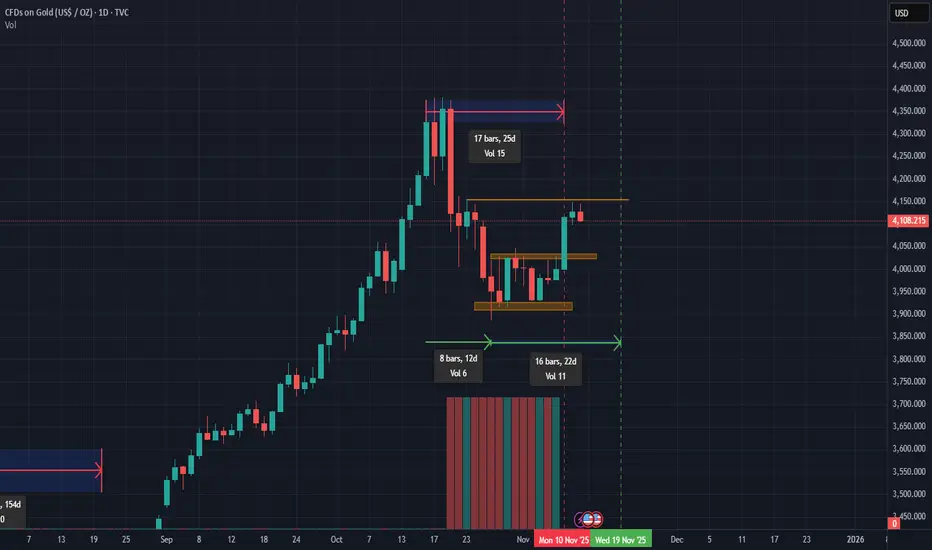
Gold sell setup This trade based on Daily TF and and deply analyzed on 6h TF
Gold has broken a strong supply level yesterday on aisa & london sessions and kept the momentum all the way to to 21 Oct and 23 Oct swing high but NY session rejected and engulfed the previous session at the swing high with high volume . After the breakout structure has to be retested , with all those confirmation there is a high probability market will retest 4050 .
Futures market

Gold at a Turning Point — The Final Breath of Wave (ii)?Following our previous Gold analyses, where we perfectly anticipated the major drop, it now appears that the corrective wave (ii) is nearing completion.
Although a small push higher could still occur, the current price zone is extremely risky for long positions, and it’s time to start looking for sell setups instead. 📉
Based on the Elliott Wave structure and Fibonacci projections, once this correction ends, the market is likely to enter wave (iii) to the downside — typically the strongest and most aggressive part of the entire sequence.
At this stage, patience and disciplined risk management are key, as the main bearish trend may soon reclaim full control of the market. ⚔️
-----------------------------------------------------------------------------------------------
🚀 Who am I?
I'm Mahdi, a prop firm trader with 7+ years of experience in technical analysis, mainly focusing on Smart Money Concepts and Elliott Wave theory.
I specialize in delivering high-quality trading signals, market insights, and educational content tailored for serious traders and investors.
📊 My Tools: SMC, Elliott Wave, Fibonacci, Liquidity Grabs, Order Blocks
💼 Prop Challenge Passed: Yes | Funded Account: In Progress
🔗 Follow for consistent updates and trading insights.

GOLD SELL WITH LIMIT ORDER!!!!!!Gold completed +350pips from my last analysis predictions on sell we have a strong sell zone 4,142 after my inducement liquidity zone am setting a sell limit from that zone selling till price arrives my target at 4,074....

Opportunities are plentiful; what's lacking is patience.Gold Technical Analysis: On Wednesday, a large bullish candlestick broke through the 4150 resistance level during the US session, ending the recent sideways consolidation. The price reached a high of around 4210. As we repeatedly emphasized on Wednesday, after consolidation, further upward movement was expected, opening a new upward channel. The market has largely lived up to expectations. The key focus now is on the sustainability of this upward move. Structurally, with this strong rally, all timeframes are in a bullish alignment. The immediate resistance levels to watch are around the 4-hour upper Bollinger Band at 4215, and the 0.786 Fibonacci retracement level, around 4275. These two levels are expected to provide some temporary resistance for the bulls. As the price has risen, the support level has gradually moved higher. The primary support level to watch in the short term is 4150. This level is a previous resistance zone that has repeatedly faced downward pressure and is currently a top-to-bottom reversal point. As long as the gold price holds above this level, the bullish trend will continue. The important support level is around 4100. As long as the price stays above this level, the upward trend will not change. Therefore, for the end of the week, we will continue to be bullish with 4150 and 4100 as support levels.
Gold prices have broken through the previous resistance zone around 4150 on the 4-hour chart. Both bulls and bears have made substantial profits over the past few trading days. If the price can hold above 4150, it is highly likely to reach 4250-4270 tomorrow. At the end of the trading day, pay attention to whether there will be a pullback followed by a second upward move. Also, watch for support around 4160-4150 in the final minutes of the trading day. The upward momentum after the recent breakout should continue, although the deviation in the smaller timeframes is slightly large. We should watch for any short-term corrections. On the hourly chart, watch the low of 4097 from Tuesday's pullback. The US session saw a rapid rise above 4150, indicating a low probability of a significant drop; at most, it will only be a pullback. Short-term focus should be on buying on dips, using the 4150 level (a previous support/resistance level) as support, and also looking for opportunities to buy at the 0.5 Fibonacci retracement level. In summary, today's gold trading strategy should prioritize buying on dips, with selling on rallies as a secondary approach. Key resistance levels to watch are 4250-4275, and key support levels are 4150-4170. Please stay on track.

How to Trade Crude Oil with Smart Money Concepts SMC Explained
Smart Money Concepts is one of the most reliable techniques for trading WTI Crude Oil.
In this article, I will teach you a profitable SMC strategy for analysing and trading USOIL futures and CFD.
This simple strategy is based on an important event every SMC trader should know - a break of structure BoS.
In a bullish trend, the best break of structure will be based on a violation and a candle close above a current higher high.
It will signify a highly probable bullish continuation and provides a great opportunity to buy
Though you can spot a bullish break of structure on any time frame, the most reliable one is a daily.
After a formation of a new high, I suggest waiting for a short term intraday correctional movement.
With a high probability, the market will retest a recently broken structure and smart money will manipulate the market, pushing the price below that, making buyers close their positions.
Once the market starts retracing, analyze an hourly time frame. The price will need to establish an i ntraday minor bearish trend.
In this bearish trend, 2 trend lines should connect lower highs and lower lows composing an expanding, parallel or contracting channel - a bullish flag pattern.
Your best signal will be a breakout of a resistance line of the flag and a violation of the level of the last lower high - a bullish change of character of a liquidity grab.
It will confirm a completion of a correction.
Buy the market on a retest of the level of the last higher low, it will be your best entry.
Set your stop loss at least below a trend line and aim at the next strong daily resistance.
That will be a perfect model for trading break of structure on WTI Crude Oil.
We spotted such a setup in my trading academy on one of the live streams with my students.
WTI Crude Oil was trading in an uptrend on a daily time frame.
A bullish violation of the last Higher High and a candle close above that confirmed a Break of Structure BoS.
The price started a correctional movement then, and we spotted a bullish flag pattern on an hourly time frame.
The market completed a correction after grabbing a liquidity below a broken structure.
A bullish movement started then, and the price violated a resistance line of the flag and the level of the last lower high.
These 2 breakouts confirmed a completion of a correction and a resumption of a bullish trend.
We opened a buy position immediately on a retest of a broken level of the last lower high.
Stop loss was below a trend line, take profit was based on the closest key daily resistance.
And the price went straight to the target.
Break of Structure BoS will be useful for analysis, forecasting and trading WTI Crude Oil.
Combining that with top-down analysis and lower time frames confirmations will provide accurate signals and profitable trading setups.
Integrate a price model that I shared in your strategy, and good luck to you trading USOIL!
❤️Please, support my work with like, thank you!❤️
I am part of Trade Nation's Influencer program and receive a monthly fee for using their TradingView charts in my analysis.
Gold on excellent recoveryTechnical analysis: The Hourly 1 chart's Ascending Channel increases it’s gains towards Overbought levels as #4,152.80 psychological benchmark (so far) is showcasing durability. Both Weekly chart (#1W) and Monthly (#1M) are on encouraging gains (# +4.13% and # +2.48% respectively) and with ranging candles I can't see any rebound possibility before #4,200.80 benchmark test. Yesterday the #4,100.80 benchmark was tested twice and as I mentioned on my remarks balanced MA periods to settle within the #4,122.80 - #4,132.80 range. More and more Buying signs are appearing as I am confident in my Bullish model. Trade accordingly.
My position: As I spotted #4,100.80 benchmark test, I started Buying Gold on each dip towards #4,116.80 first Resistance. On another #4,106.80 Support sweep, I engaged strong Buying orders towards #4,127.80 extension last night. I will continue Buying every dip on Gold from my key entry points. That is my practical suggestion.

Gold. About the time for 5400 pips. 12/Nov/25Xauusd is timing boom for 5400 not just 5300 pips drop as previous ideas..

XAUUSD Trade Setup: Gold at Resistance, Here's my Trade PlanXAUUSD Gold has seen a strong rally recently, pushing into a key resistance zone 🧱. With capital currently rotating out of safe-haven assets like gold and flowing into the stock markets, we could see a potential pullback from this level. 📉
At the moment, I’m avoiding buying at a premium price. Instead, I’ll be watching for a retracement back into equilibrium — around the 50% level of the recent swing range ⚖️.
If price pulls back, then breaks market structure to the upside, that could confirm renewed bullish momentum, and I’ll be looking for a long entry setup from that point. 🚀
⚠️ This analysis is for educational purposes only and not financial advice.

Breakout Confirmed – Watching for 4H FVG RebalanceAfter a full week of sideways chop, Gold finally broke structure on Monday with a strong bullish impulse. The breakout clears the 7-day range and confirms higher-timeframe bullish intent.
I’m now watching the 4H FVG sitting just below the previous day’s low — that’s where I’d like to see price rebalance before continuing the next leg higher.
If price respects that zone and holds structure, it could mark the start of a sustained bullish push for the week.
Bias stays bullish unless price breaks back below the H4 FVG or fails to hold the weekly open.

The Dual Catalyst: Why Silver's \$50 Breakout is SustainableSilver (XAG/USD) recently broke the crucial $50 per ounce level, signaling a fundamental shift in its market dynamics. While the price edges lower in the short term, primarily due to a strengthened US Dollar (USD), its long-term trajectory is decisively bullish. This surge is not merely speculative. It is driven by an unprecedented convergence of geopolitical risks, critical industrial demand, and shifting macroeconomic policy. Analyzing these catalysts across multiple domains confirms silver's evolving role from a precious metal to a critical industrial asset.
Macroeconomics and Geopolitics
Silver's price strength reflects global systemic risk and monetary policy uncertainty. Current market expectations strongly favor a Federal Reserve (Fed) rate cut by December, with a nearly 68% probability priced in by the CME FedWatch Tool. Lower interest rates reduce the opportunity cost of holding non-yielding silver, making it relatively more attractive than bonds or cash. This dovish outlook provides a powerful structural floor for the price.
From a geopolitical perspective, ongoing global tensions and elevated political risks, like recent US government funding debates, accelerate safe-haven demand. Investors seek hard assets to hedge systemic risks. While gold often leads as the primary safe haven, silver's lower cost and dual-use nature attract broader retail and institutional flows, pushing it higher. A strong, sustained rally will require the price to hold above $50 and overcome the next major resistance near the historical high of $54.50.
Technology, Science, and Patents
Industrial demand now constitutes over 50% of silver’s total annual consumption, fundamentally redefining its market. Its unmatched electrical and thermal conductivity makes it indispensable in high-growth sectors.
* Renewable Energy: Silver is critical for photovoltaics (PV), specifically in solar cells, which form the conductive paste that harvests electrons. The global push for green energy and solar capacity expansion creates structural, persistent demand that consistently tightens the market.
* High-Tech and EVs: Electric Vehicles ( EVs) require significantly more silver (25–50 grams per unit) than traditional vehicles for inverters, battery management systems, and high-voltage contacts. The expansion of 5G technology, advanced computing, and the Internet of Things (IoT) further relies on silver-based components for seamless connectivity and efficiency.
Geostrategy and Supply Chain Risk
Silver is now recognized as a critical mineral by several major economies. This reclassification acknowledges its essential role in national security, advanced manufacturing, and the energy transition. This status highlights a geopolitical vulnerability: silver's supply chain is increasingly seen as a strategic concern.
The market currently runs a persistent supply deficit, depleting above-ground stockpiles to critically low levels. Mining silver often occurs as a byproduct of copper, lead, and zinc, meaning its supply cannot easily scale up based on price alone. Trade conflicts or export controls imposed by major producing nations could severely disrupt supply, immediately spiking the price due to its non-substitutable role in key high-tech applications.
Cyber and Economics: The Future Nexus
Silver’s unique properties extend into emerging fields like cybersecurity* and advanced computing. Research integrates silver nanoparticles and quantum materials into sophisticated systems. These materials enhance data processing efficiency and bolster the security of financial supply chains. Furthermore, flexible electronics using silver nanowires* will drive the next generation of wearable and flexible displays, creating entirely new demand vectors.
The long-term economic case for a $100 silver price remains dependent on this confluence of factors. Sustained high industrial consumption, a breakdown in global supply chains, and a continued environment of monetary debasement must align. Silver has truly become a dual-catalyst metal, positioned to thrive as both a financial safe haven and a fundamental building block of the twenty-first-century green and digital economy.

Gold Regains Its Shine as Buyers Take Control of the Market!Hello traders,
After days of consolidation, gold surged sharply during the Asian session , reclaiming the key psychological level of $4,000/oz. The weakness of the U.S. dollar, combined with expectations that the Federal Reserve may cut interest rates in December , has reignited investor optimism. Meanwhile, efforts by the U.S. Congress to end the government shutdown have further strengthened gold’s position as a safe-haven asset.
On the chart, gold is showing a strong rebound from the $4,000 support zone , where buyers previously stepped in with significant volume. The potential scenario suggests that price may pull back slightly toward $4,000 before continuing its climb toward the $4,200 resistance area, which aligns with the previous swing high and a key supply zone.
If price breaks above $4,200, the bullish momentum could extend further , targeting the $4,300 area in the medium term. Market sentiment remains firmly in favor of the bulls, and gold appears ready for a fresh breakout this week .
Wishing you all successful trades!

GOLD Free Signal! Sell!
Hello,Traders!
GOLD formed a clear double-top at the premium area and broke below the neckline, confirming bearish intent. A retest of structure offers short opportunities toward discount liquidity.
---------------------
Stop Loss: 4,149$
Take Profit: 4,097$
Entry: 4,126$
Time Frame: 1H
---------------------
Sell!
Comment and subscribe to help us grow!
Check out other forecasts below too!
Disclosure: I am part of Trade Nation's Influencer program and receive a monthly fee for using their TradingView charts in my analysis.

GOLD GOES " ̶T̶R̶I̶P̶L̶E̶ ̶V̶O̶D̶K̶A̶" TRIPLE TOP PATTERNGold has recently exhibited strong technical momentum, rebounding from its $3,900 support and surpassing the 50-day moving average, which marks a bullish reversal after a late-October dip.
Immediate support is at $4100 per ounce.
The Relative Strength Index (RSI) is rising, confirming buyers have regained control in the short-term and signaling the possibility for further upside.
BUY THE DIP SCENARIO
Current trading strategies suggest buying near support and targeting resistance upward, demonstrating an underlying “buy on dips” scenario as gold consolidates above $4100.
WHAT IS " ̶T̶R̶I̶P̶L̶E̶ ̶V̶O̶D̶K̶A̶" TRIPLE TOP PATTERN
The triple top pattern is a bearish reversal technical chart pattern signaling the potential end of an uptrend and the beginning of a downtrend.
It forms after an asset price hits the same resistance level three times but fails to break above it, creating three distinct peaks at roughly the same price level. Between these peaks are pullbacks or troughs, forming support levels. The pattern is confirmed only when the price breaks below the support (neckline) formed by these troughs.
The psychology behind this pattern shows weakening buying power as the price fails to surpass the resistance level on three attempts. Each peak typically has declining volume, reflecting decreased buying enthusiasm. After the third peak, sellers could gain control, and the price could falls below support with increased volume, confirming the reversal.
CONCLUSION
Traders use the triple top to anticipate the exhaustion of bullish momentum, signaling caution and opportunities to enter short positions or exit longs.
The pattern reflects supply overwhelming demand after repeated failed rallies, indicating a shift from bullish to bearish sentiment. It is considered a reliable indicator after a sustained uptrend and is used with risk management strategies to navigate market turns effectively.
TECHNICAL SUMMARY
Just simply take a look at history of Gold. It says: " ̶T̶R̶I̶P̶L̶E̶ ̶V̶O̶D̶K̶A̶" TRIPLE TOP.
--
Best wishes,
@PandorraResearch Team

VX1! INDEXPreferably suitable for scalping and accurate as long as you watch carefully the price action with the drawn areas.
With your likes and comments, you give me enough energy to provide the best analysis on an ongoing basis.
And if you needed any analysis that was not on the page, you can ask me with a comment or a personal message.
Enjoy Trading ;)

GOLD BUY ANALYSISLong-Term Buy Opportunity (Wave (V) Impulse)
Buy Zone: $4,080 – $4,090 (completion of minor dip / retest of breakout)
Target (TP1): $4,200
Target (TP2): $4,240 – $4,250 (completion of Wave (V))
Stop Loss: $4,050
Reasoning:
The structure suggests an ongoing bullish channel.
Once Wave (IV) holds, the next upward leg should complete Wave (V), targeting the resistance zone around $4,250.
Notes:
The market structure remains bullish in the medium term.
Watch for confirmation of a bullish breakout from the triangle consolidation.
Manage risk carefully and trail stops once Wave (V) progresses toward resistance.
#Gold #XAUUSD #ElliottWave #Forex #Commodities #WaveAnalysis #TradingSetup #TechnicalAnalysis #BuyTheDip #SwingTrade

Sell Setup GoldHi All,
I hope everyone is doing fine and had good day yesterday and today as well. I am here with buy & sell setup. Whatever triggers first will see.
Note: All information is for only Educational Purposes
Check the screenshot for Sell Setup
Green Pips To All
Amen

#xauusd pullback short from %61.8 level 4192 ? #gold🔹 61.8% Fibonacci level: ≈ 4,196
🔹 Setup idea:
• Short zone: 4,190 – 4,200
• Stop loss: Above 4,210 – 4,220 (to allow for wicks)
• Take profit targets:
• TP1: ~4,150 (minor structure)
• TP2: ~4,100
• TP3: ~4,000 (major swing support)
If gold rallies back to 4,190–4,200 and shows:
• Bearish candle rejection (e.g. 4-hour pin bar / engulfing)
• Weakening momentum or divergence on RSI
• Confluence with prior resistance
Then this 61.8% Fib zone is a technically valid pullback short area.

Gold Short Ahead of House VoteGold and stock market corelation turn negative again, meaning market is not pricing the liquidty crunch anymore rather than economy as a whole. Rising risk over jobs market showed itself this week and it got markets spooked. Is today's jupm because of protection againts risks or today's vote is expected to fail that I don't know but I will bet on a house passing the stopgap because risk/reward ratio will be more suited for me. I'm not an inseder so I will continue to play for statistics.
4200-4220 is the resistance zone that I follow and I'm going short.

Gold consolidates between $4100–$4115, awaiting breakout📊Market Overview
Gold (XAU/USD) is currently fluctuating around $4104 after a mild pullback from the $4112 zone.
The bullish momentum has paused as traders await fresh U.S. data, while the USD shows a short-term technical rebound.
Asian session liquidity remains thin — this is mainly an accumulation phase ahead of the European and U.S. sessions.
📉 Technical Analysis
• Resistance: $4118 – $4125 – $4140
• Support: $4100 – $4090 – $4078
• EMA50 (H1): Price is retesting dynamic support around $4100.
• RSI: 52 → Neutral, no clear selling pressure.
• Candlestick Structure: H1 candles are tightening, indicating a potential breakout setup.
📌 Outlook
Gold is consolidating in a narrow range.
If the price holds above $4100, the bullish trend could extend toward $4125–$4140.
However, a strong rejection at $4120–$4125 could trigger a short-term reversal.
________________________________________
💡 Trading Strategy
🔺 BUY XAU/USD : $4100 – $4097
🎯 TP: 40 / 80 / 200 pips
🛑 SL: $4093
🔻 SELL XAU/USD : $4122 – $4125
🎯 TP: 40 / 80 / 200 pips
🛑 SL: $4128

GOLD USD📊 GOLD / USD – 2H Technical Analysis
Price is currently trading around 4,195, still below the key 4,254 pressure zone.
The market remains in a clear bullish channel with momentum gradually slowing down as price approaches this critical area.
🔹 Current Structure:
The uptrend is still intact with higher highs and higher lows.
4,254 acts as a potential liquidity / reaction zone where short-term rejection or consolidation may occur.
If the price holds above 4,232 – 4,213, continuation toward the 4,336 – 4,370 supply zone is likely.
A strong rejection from 4,254 could trigger a correction toward 4,100 (major demand area).
🔹 Expected Scenario:
Price may first push up to test 4,254, then react with a minor pullback before continuing higher.
If momentum breaks through cleanly, bulls may target the 4,336 – 4,370 range.
📈 Bias: Bullish, but with caution near 4,254 (liquidity zone).
⚠️ Disclaimer:
This analysis represents personal opinion only and is not financial advice.
Always manage your own risk before taking any trades.

Monitoring AI Valuation - Precision on Upcoming CorrectionThese are the three largest market-cap listed companies on the Nasdaq.
If we are concerned about an AI bubble, I’m going to show you how I perform a quick glance at some top companies and their index to determine the likelihood of an upcoming short-, mid-, or long-term correction.
In 2017, Microsoft’s P/E reached its highest at 45 — and it continued to rise after that.
In 2023, Nvidia’s P/E reached its highest at 147 — and it continued to rise after that.
In 2024, Apple’s P/E reached its highest at 40 — and it continued to rise after that.
Micro E-mini Nasdaq-100 Index
Ticker: MNQ
Minimum fluctuation:
0.25 index points = $0.50
Disclaimer:
• What presented here is not a recommendation, please consult your licensed broker.
• Our mission is to create lateral thinking skills for every investor and trader, knowing when to take a calculated risk with market uncertainty and a bolder risk when opportunity arises.
CME Real-time Market Data help identify trading set-ups in real-time and express my market views. If you have futures in your trading portfolio, you can check out on CME Group data plans available that suit your trading needs www.tradingview.com

Gold Price Forecast | Smart Money Levels (Nov 12, 2025)OANDA:XAUUSD GOLD ANALYSIS - What’s Moving the Market Today?
(Updated: November 12, 2025)
💠 Trade with DECRYPTERS
We keep it simple - Smart Money zones define the battlefield. Follow institutional footprints, not noise.
🔮 ASTROLOGY INSIGHT
Mercury ♂ Mars = Mixed → Bearish if risk-on
Expect volatility and fake-outs near resistance as sentiment stays uncertain.
📊 MARKET OVERVIEW
Gold trades around $4,135-$4,145, showing resilience despite U.S. dollar swings.
* DXY slips to ~99.35 amid shutdown uncertainty and weaker risk tone.
* Fed holds rates steady at 3.75–4.00%; next cut odds at 55% for December.
* Central banks continue strong buying (+220t in Q3, led by Poland’s +67t).
* ETF inflows remain firm at +222t - investor demand steady.
* Geopolitical tensions (Mideast + US–China tariffs) sustain safe-haven flows.
Gold remains locked between institutional buy/sell blocks, Smart Money setting up heavy positions from 4,028–4,206.
🧭 SMART MONEY LEVELS (LIVE UPDATE)
Smart Money Sell Area: 4206–4191 → Major liquidity zone; rejection likely.
Sell Reaction Zone: 4165–4153 → Intraday resistance, ideal for quick fades.
Smart Money Buy Area: 4028–4011 → Deep liquidity accumulation zone for swing buys.
📍 Millions in pending institutional orders rest within these zones.
📅 WHAT TO WATCH NEXT
* Nov 13 CPI: Expect ~3.0% core, shutdown delays may trigger volatility.
* Dec FOMC: 55% odds of a 25bps cut; Fed cautious until full data returns.
* Geopolitical Risk: Mideast or tariff escalation = 🟢 bullish spike.
Resolution = 🔴 USD rebound → gold pressure.
Break Zones:
🔸 Hold above 4,120 → targets 4,165–4,170
🔸 Break below 4,100 → slide toward 4,050–4,028
🎯 TRADE PLAN
Stay tactical — trade zones, not emotions.
* Buy Dips: 4,090–4,120 → Targets 4,150–4,170
* Sell Rallies: 4,165–4,190 → Stops above 4,206
Bias remains bullish while above 4,120; short-term sentiment may turn mildly bearish if risk appetite improves.
🧠 CONCLUSION
Gold remains supported by central bank demand and geopolitical risk, even as Fed policy and DXY limit major upside.
Expect range-bound volatility with bullish lean above 4,100.
Trade reaction, not prediction.

"XAUUSD"Gold quickly reached the resistance targets it had on its upward path.
The shape of the candles formed shows that it no longer has the strength to reach higher targets within the remaining time,
so a pullback of gold toward 3900 seems more likely.
Please review the previous analyses.