M2 money supply ‘holds the key’ for Bitcoin’s next move — Market analyst
The growing money supply in the United States could be the key to unlocking more upward momentum for Bitcoin ![]() BTCUSD, according to market analysts and historical chart patterns.
BTCUSD, according to market analysts and historical chart patterns.
M2 money supply growth could catalyze the next bull run
The M2 money supply estimates all cash and short-term bank deposits across the United States, and its growth has historically been correlated with previous Bitcoin bull runs.
The growth of the money supply could hold the key for the next leg up for the Bitcoin cycle, according to Jamie Coutts, chief crypto analyst at Realvision, who wrote in a May 16 X post:
However, the changes in the money supply seem more important for Bitcoin price than the nominal value, according to Coutts:
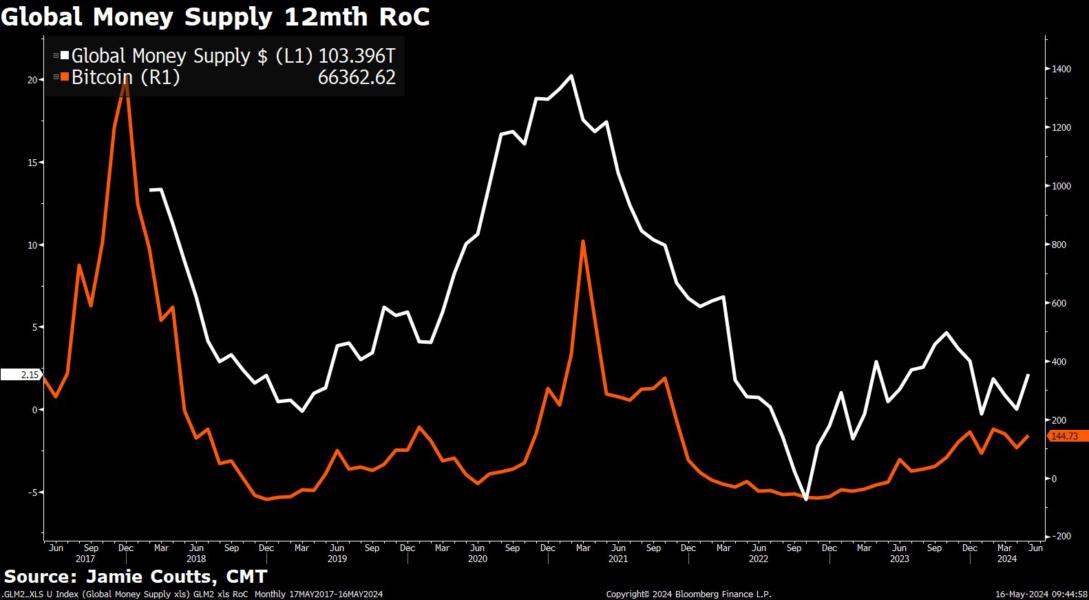
At the beginning of May, the M2 money supply turned positive year-over-year for the first time since November 2023, signaling that investors could soon start looking for hedges against inflation, such as Bitcoin.
The price action of the U.S. dollar could be another catalyst for Bitcoin price if it breaks below the 101 mark, according to Coutts:

Related: Crypto trader turns $3K into $46M in one month as PEPE price soars
Bitcoin breaks month-long downtrend analyst
Bitcoin broke its month-long daily downtrend on May 16, according to popular crypto analyst Rekt Capital, who wrote to his 468,000 followers in an X post:

Over on the four-hour chart, Bitcoin price saw a breakout to the upside, after a nearly five-week downtrend that started on April 8.
However, Bitcoin’s relative strength index (RSI) peaked at 77 on May 16 before retracing to its current value of 66. While this suggests that Bitcoin is trading at fair value, it may need to fall to around the 50 mark before BTC price could see more upside momentum.
The RSI is a popular momentum indicator used to measure whether an asset is oversold or overbought based on the magnitude of recent price changes.
Bitcoin price faces significant resistance around the $66,500 mark. A potential move above would liquidate over $111 million worth of leveraged short positions across all exchanges, according to Coinglass data.
Related: Altcoins will bottom in early summer before bull run — Analyst
This article does not contain investment advice or recommendations. Every investment and trading move involves risk, and readers should conduct their own research when making a decision.