Price analysis 5/15: BTC, ETH, BNB, SOL, XRP, TON, DOGE, ADA, AVAX, SHIB
The S&P 500 Index (SPX) and the Nasdaq Composite soared to a new lifetime high after the United States Consumer inflation report came in less than expected. That ignited a rally in Bitcoin ![]() BTCUSD, pushing the price above $66,000. The farther Bitcoin moves from $60,000, the less likely a breakdown is. However, that does not guarantee the start of a new uptrend.
BTCUSD, pushing the price above $66,000. The farther Bitcoin moves from $60,000, the less likely a breakdown is. However, that does not guarantee the start of a new uptrend.
Galaxy Digital founder and CEO Mike Novogratz said during the firm’s first quarter earnings call that Bitcoin was likely to consolidate between $55,000 and $75,000 before moving higher at the end of the current quarter.
The failure of the bears to sink Bitcoin below $60,000 seems to have attracted buyers. CoinShares’ “Digital Asset Fund Flows Weekly” report showed inflows of $130 million into digital asset investment products this past week, the first such occurrence in five weeks.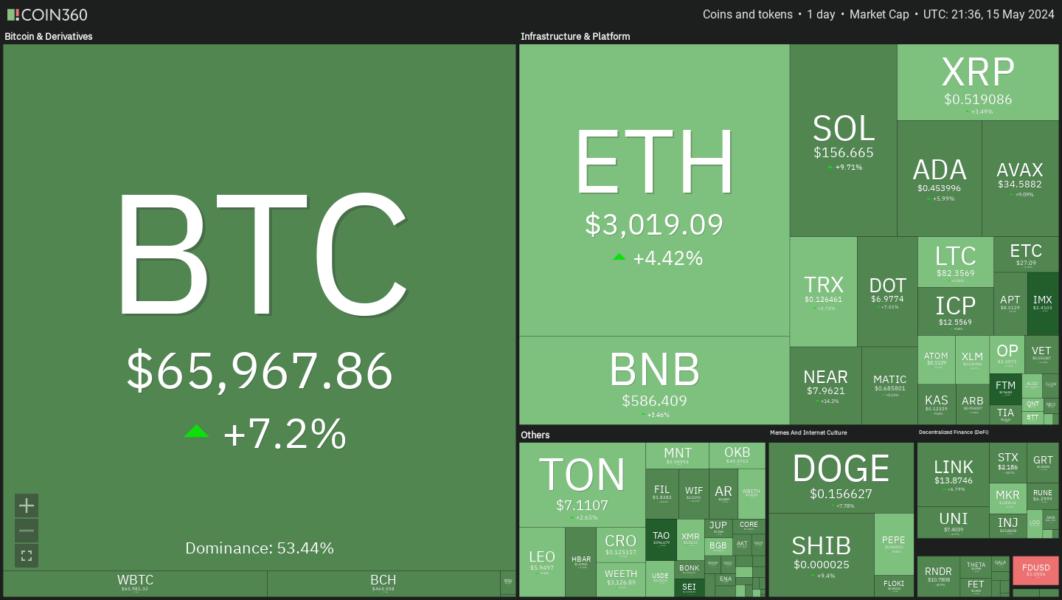
The State of Wisconsin Investment Board (SWIB) disclosed investments in spot Bitcoin exchange-traded funds worth roughly $164 million. Bloomberg ETF analyst Eric Balchunas said in a X post that more such investments by institutions could be expected as they “tend to move in herds.”
Could Bitcoin and select altcoins overcome the near-term resistance and move higher? Let’s analyze the charts of the top 10 cryptocurrencies to find out.
Bitcoin price analysis
Bitcoin surged above the 20-day exponential moving average ($62,765) on May 15, indicating that the bulls have absorbed the supply.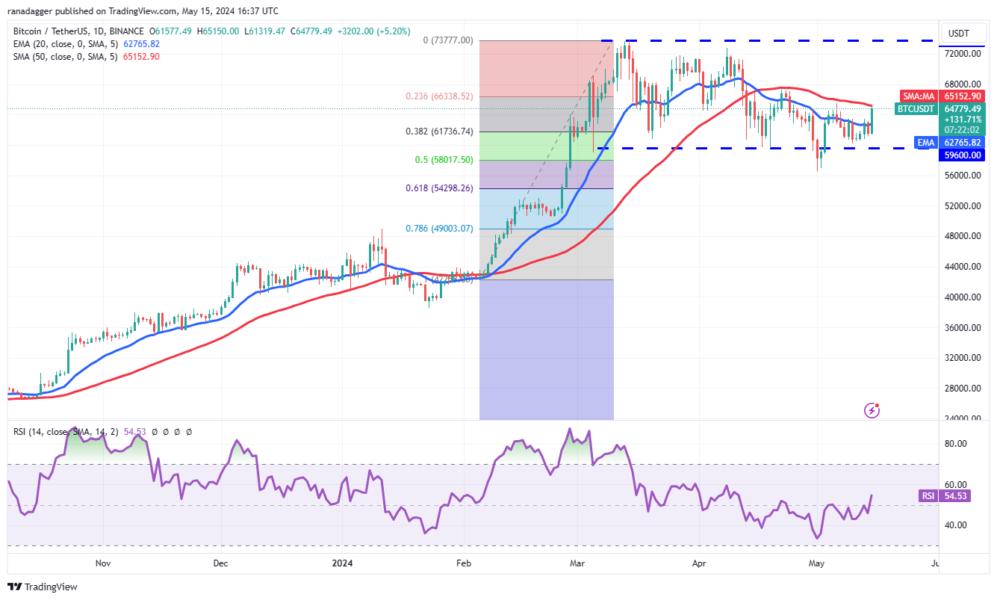
If buyers maintain the momentum and propel the price above the 50-day simple moving average ($65,152), it will open the gates for a possible rally to the formidable resistance at $73,777. The bears may defend this level with all their might.
If bears want to prevent the upside move, they will have to defend the 50-day SMA and tug the price to the $59,600 support. The bulls are likely to defend this level aggressively, because if the support cracks, the ![]()
![]() BTCUSDT pair may plunge to 61.8% Fibonacci retracement level of $54,298.
BTCUSDT pair may plunge to 61.8% Fibonacci retracement level of $54,298.
Ether price analysis
Ether’s (ETH) strong bounce off the $2,850 support on May 15 suggests that the bulls are fiercely defending the level.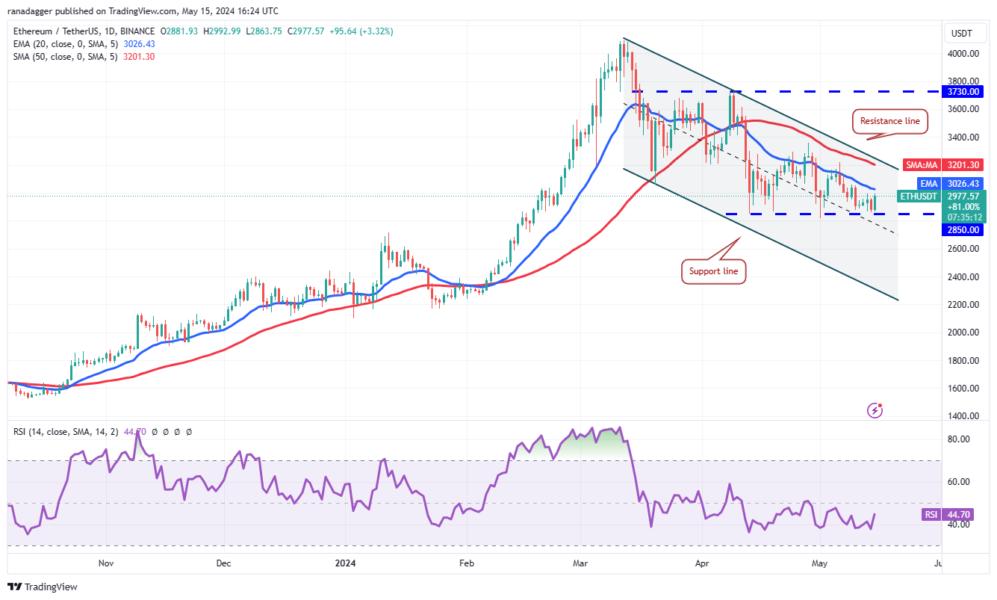
If buyers shove the price above the 20-day EMA ($3,026), the ![]()
![]() ETHUSDT pair could rise to the resistance line of the descending channel. The bears are likely to mount a vigorous defense at the resistance line, but if the bulls prevail, the pair may start a rally to $3,400.
ETHUSDT pair could rise to the resistance line of the descending channel. The bears are likely to mount a vigorous defense at the resistance line, but if the bulls prevail, the pair may start a rally to $3,400.
On the contrary, if the price turns down from the 20-day EMA, it will signal that bears are selling on every minor rally. The pair could then retest the strong support at $2,850. A break below this support could start a downward move toward the support line of the descending channel.
BNB price analysis
BNB (BNB) fell below the moving averages on May 14 but rebounded sharply off the support line of the symmetrical triangle pattern. This suggests aggressive buying at lower levels.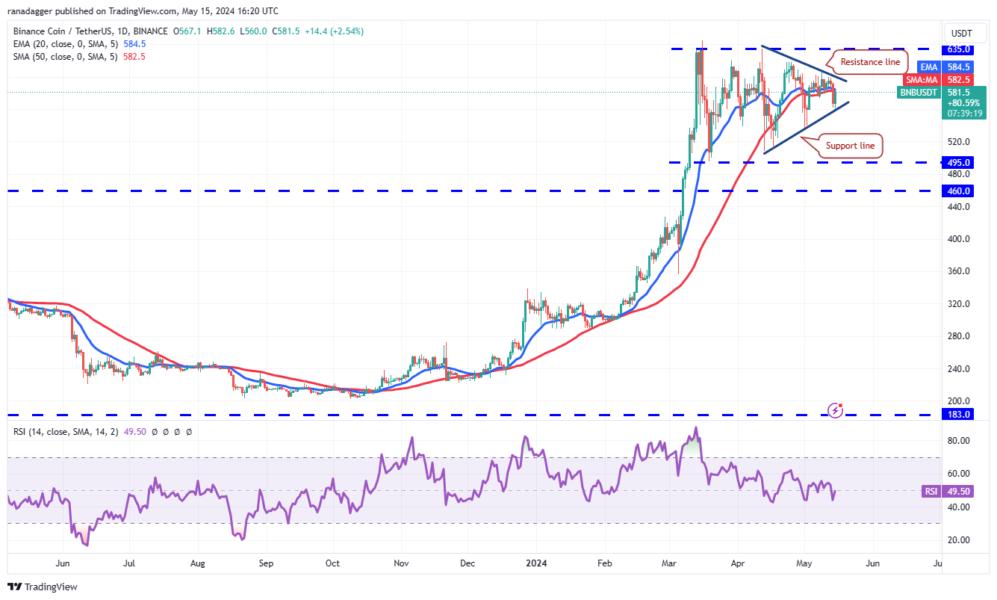
Buyers will try to gain control by kicking the price above the resistance line of the triangle. If that happens, the ![]()
![]() BNBUSDT pair could surge to $634 and then to $692. The pattern target of the setup is $726.
BNBUSDT pair could surge to $634 and then to $692. The pattern target of the setup is $726.
Conversely, if the price turns down and breaks below the triangle, it will suggest that bears have gained control in the near term. The pair could dive toward $495 and subsequently to the pattern target of $434.
Solana price analysis
Solana (SOL) broke above the 20-day EMA ($146) on May 15, indicating that the selling pressure is reducing.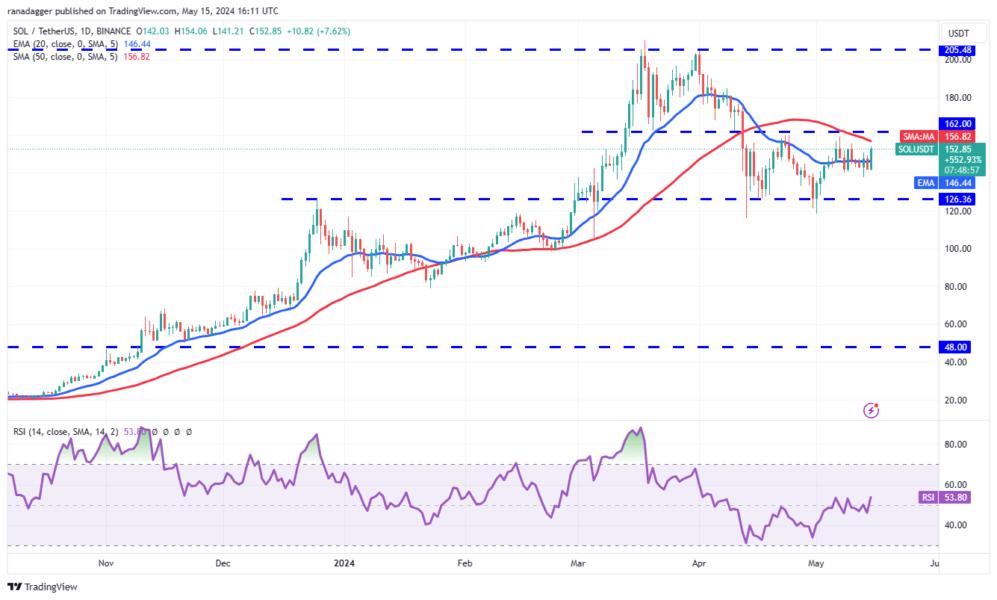
If the price maintains above $145, the ![]()
![]() SOLUSDT pair could rally to $162. In a range, traders generally sell close to the resistance, and they are likely to do that again near $162. If the price turns down from the overhead resistance, it will signal that the pair may remain range-bound for a while.
SOLUSDT pair could rally to $162. In a range, traders generally sell close to the resistance, and they are likely to do that again near $162. If the price turns down from the overhead resistance, it will signal that the pair may remain range-bound for a while.
A break above $162 or below $126 could start the next trending move. If the $162 level is taken out, the pair may climb to $205. On the other hand, a break below $126 could sink the pair to $100.
XRP price analysis
The bulls tried to push XRP (XRP) above the 20-day EMA ($0.51) on May 14, but the bears held their ground.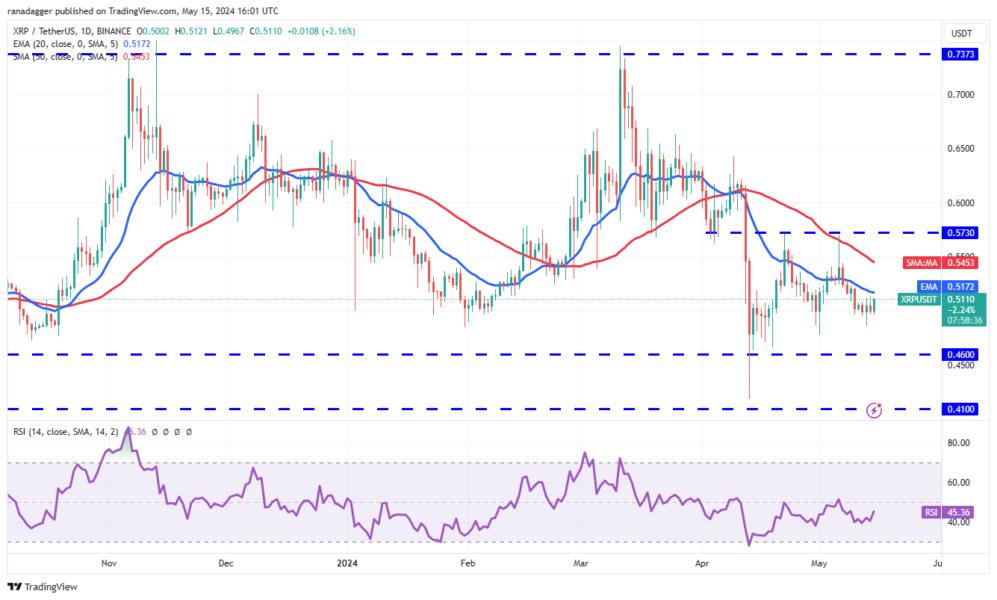
The bulls are again attempting to drive the price above the 20-day EMA on May 15. If they can pull it off, the ![]()
![]() XRPUSDT pair may rally to the overhead resistance at $0.57. This level could prove to be a difficult barrier to cross.
XRPUSDT pair may rally to the overhead resistance at $0.57. This level could prove to be a difficult barrier to cross.
Alternatively, if the price turns down from the 20-day EMA, the bears will try to strengthen their position by pulling the price to the critical support at $0.46. Buyers are expected to defend this level aggressively. A strong rebound off $0.46 will signal that the range-bound action may continue for some more time.
Toncoin price analysis
Buyers tried to push Toncoin (TON) above the $7.67 resistance on May 13, but the long wick on the candlestick shows selling at higher levels.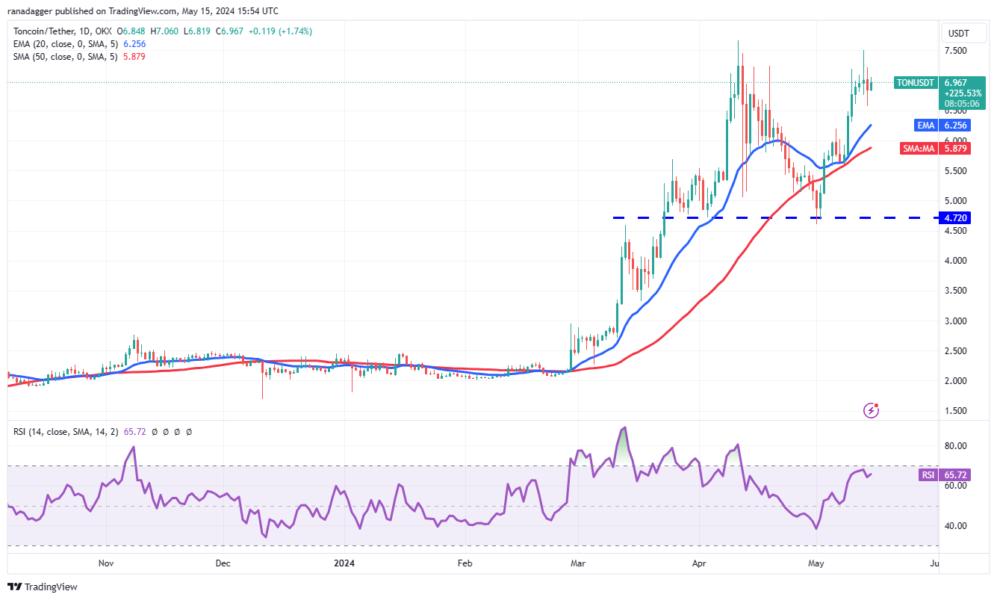
A minor advantage in favor of the bulls is that they have not ceded much ground to the bears. This suggests that the bulls may take one more shot at the overhead resistance. If buyers propel and maintain the price above $7.67, it will signal the resumption of the uptrend. The ![]()
![]() TONUSDT pair could rally to $9.
TONUSDT pair could rally to $9.
This positive view will be invalidated in the near term if the price turns down from the current level and plummets below the moving averages.
Dogecoin price analysis
The bulls are trying to prevent Dogecoin (DOGE) from slipping below the neckline and completing a bearish head-and-shoulders pattern.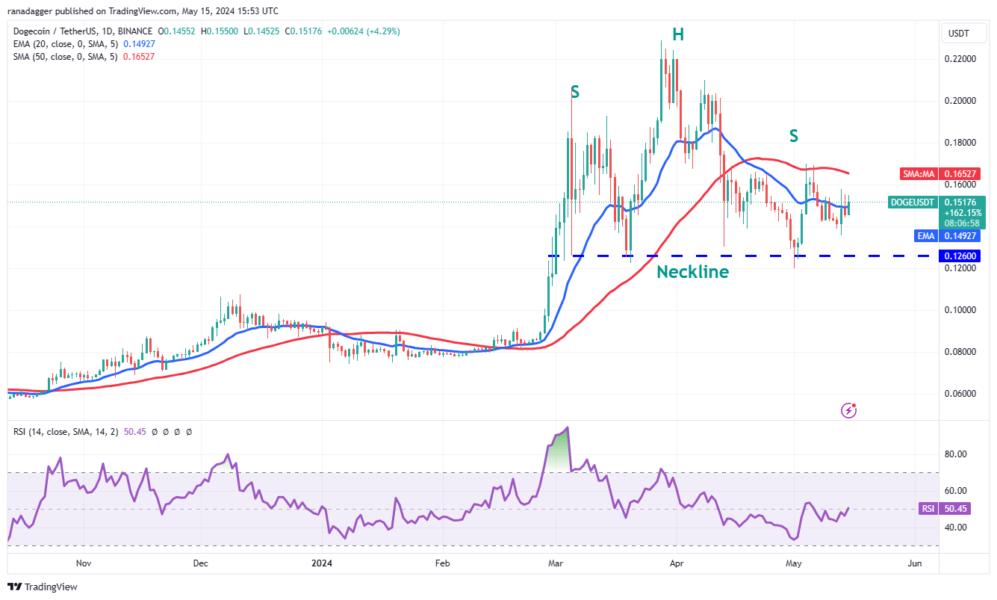
The flattish 20-day EMA ($0.15) and the RSI near the midpoint suggest a range-bound action in the near term. If the price rises above the 20-day EMA, the ![]()
![]() DOGEUSDT pair could reach the 50-day SMA ($0.17). This is an essentialt level for the bears to defend because a break above it could clear the path for a rally to $0.21.
DOGEUSDT pair could reach the 50-day SMA ($0.17). This is an essentialt level for the bears to defend because a break above it could clear the path for a rally to $0.21.
The bears will seize control if they sink and sustain the price below the neckline of the H&S pattern. That could start a drop to $0.08.
Cardano price analysis
The failure of the bears to maintain Cardano (ADA) below the support line on May 15 attracted solid buying by the bulls.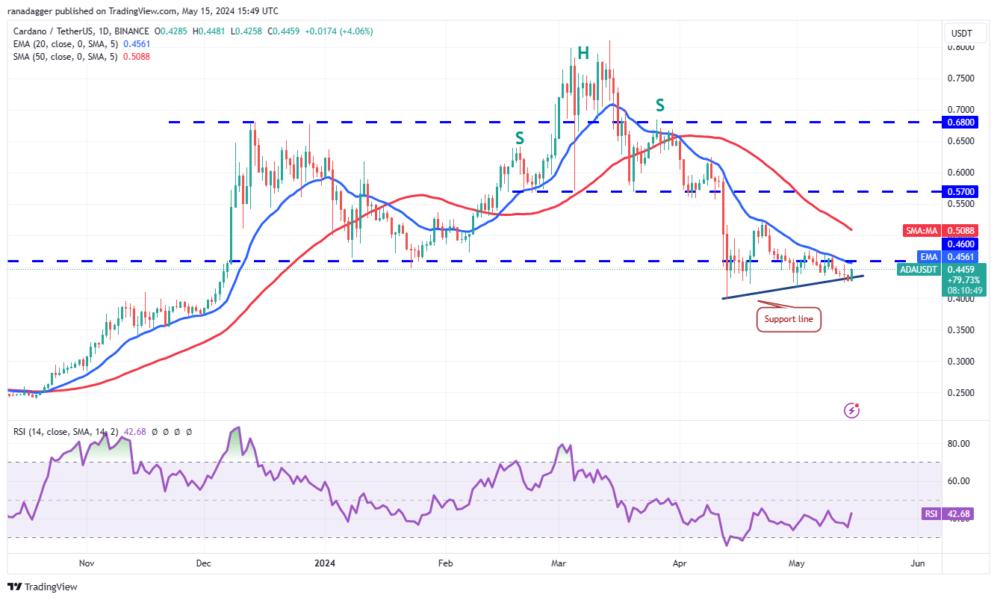
The downsloping 20-day EMA and the RSI in the negative territory suggest that the bears have the upper hand. If the price turns down from the 20-day EMA and sustains below the support line, it will signal the start of the next leg of the downtrend. The ![]()
![]() ADAUSDT pair could descend to $0.35.
ADAUSDT pair could descend to $0.35.
Instead, if the price continues higher and jumps above the 20-day EMA, it will suggest that the bears are losing their grip. The pair may climb to the 50-day SMA ($0.51) and later to $0.57.
Avalanche price analysis
Avalanche (AVAX) has been trading below the 20-day EMA ($35) for the past few days, but the bears have failed to pull the price to the support of the range at $29. This suggests that selling dries up at lower levels.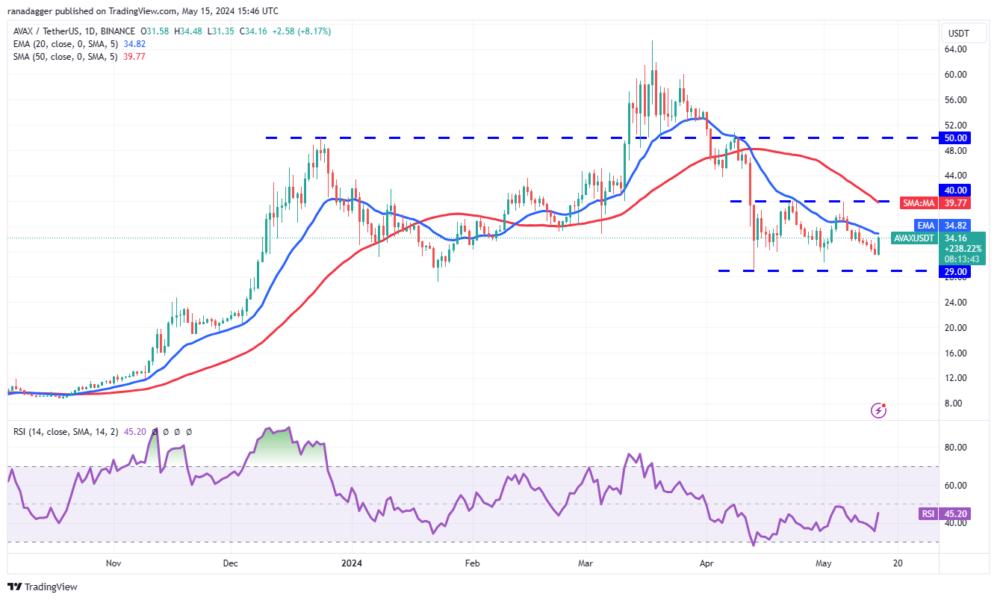
The bulls will try to push the price above the 20-day EMA. If they succeed, it will suggest that the ![]()
![]() AVAXUSDT pair could remain range-bound between $40 and $29 for a few more days. A break above $40 could start a rally to $50.
AVAXUSDT pair could remain range-bound between $40 and $29 for a few more days. A break above $40 could start a rally to $50.
Contrary to this assumption, if the price turns down from the 20-day EMA, it will signal that the bears are trying to take charge. The pair may then slump to the strong support at $29. If this level breaks down, it will indicate the start of the next leg of the downtrend. The pair may then decline to the next support at $25.
Shiba Inu price analysis
The bulls successfully guarded the support line of the symmetrical triangle pattern in Shiba Inu (SHIB) on May 13.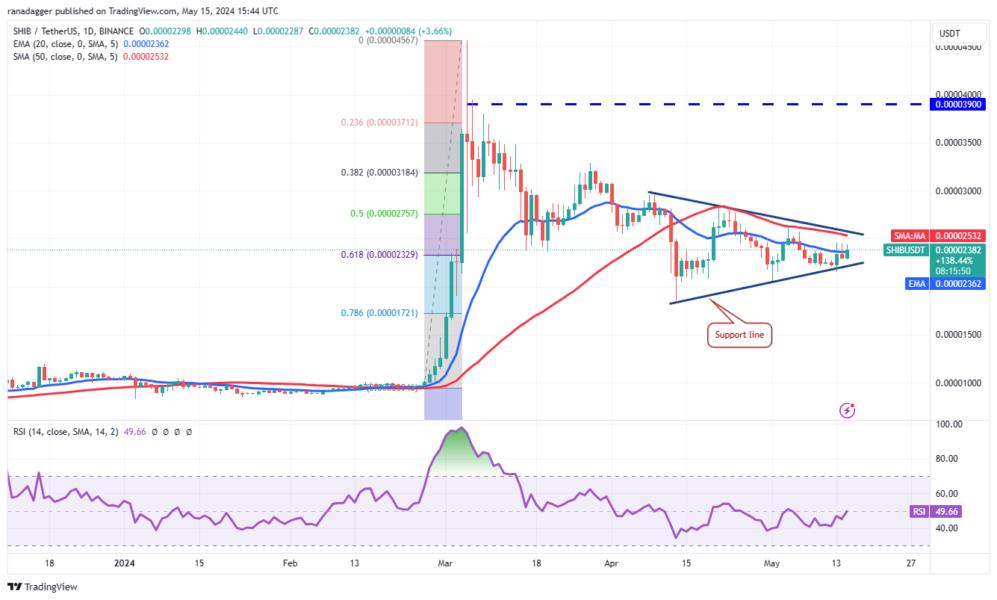
The flattening 20-day EMA ($0.000023) and the RSI near the midpoint do not give a clear advantage either to the bulls or the bears. It is difficult to predict the direction of the breakout with certainty, hence it is better to wait for the price to rise above or fall below the triangle before placing large bets.
If the price breaks above the triangle, it will suggest that the corrective phase may be over. The ![]()
![]() SHIBUSDT pair could rise to $0.000030 and then to $0.000033. On the contrary, a break below the triangle could open the doors for a fall to the 78.6% Fibonacci retracement level of $0.000017.
SHIBUSDT pair could rise to $0.000030 and then to $0.000033. On the contrary, a break below the triangle could open the doors for a fall to the 78.6% Fibonacci retracement level of $0.000017.
This article does not contain investment advice or recommendations. Every investment and trading move involves risk, and readers should conduct their own research when making a decision.